HAL Id: hal-03047095
https://hal.archives-ouvertes.fr/hal-03047095
Submitted on 16 Dec 2020
HAL is a multi-disciplinary open access
archive for the deposit and dissemination of
sci-entific research documents, whether they are
pub-lished or not. The documents may come from
teaching and research institutions in France or
abroad, or from public or private research centers.
L’archive ouverte pluridisciplinaire HAL, est
destinée au dépôt et à la diffusion de documents
scientifiques de niveau recherche, publiés ou non,
émanant des établissements d’enseignement et de
recherche français ou étrangers, des laboratoires
publics ou privés.
Discriminating value of HR-pQCT for fractures in
women with similar FRAX scores: A substudy of the
FRISBEE cohort
Sylvie Cappelle, Michel Moreaux, R. Karmali, L. Iconaru, F. Baleanu, V.
Kinnard, Marianne Paesmans, S. Rozenberg, M. Rubinstein, M. Surquin, et al.
To cite this version:
Sylvie Cappelle, Michel Moreaux, R. Karmali, L. Iconaru, F. Baleanu, et al.. Discriminating value of
HR-pQCT for fractures in women with similar FRAX scores: A substudy of the FRISBEE cohort.
BONE, Elsevier, 2021, 143, pp.115613. �10.1016/j.bone.2020.115613�. �hal-03047095�
Discriminating value of HR-pQCT for fractures in women with similar FRAX scores: a
1
substudy of the FRISBEE cohort
2
3
Cappelle S.I.1, Moreau M.², Karmali R.3, Iconaru L. 3, Baleanu F.3, Kinnard V.3, Paesmans M.², Rozenberg S.4,
4
Rubinstein M.5, Surquin M.1, Blard P.-H.6, Chapurlat R.7, Body J.J.3, Bergmann P.8
5
1 Department of Geriatrics, CHU Brugmann, Université Libre de Bruxelles (ULB), Brussels, Belgium
6
2 Data Centre, Bordet Hospital, Université Libre de Bruxelles (ULB), Brussels, Belgium
7
3 Department of Internal Medicine, CHU Brugmann, Université Libre de Bruxelles (ULB), Brussels, Belgium
8
4 Department of Obstetrics and gynaecology, Université Libre de Bruxelles (ULB) and Vrije Universiteit (VUB), Brussels, Belgium
9
5 Department of Nuclear Medicine, Ixelles Hospital, Université Libre de Bruxelles (ULB), Brussels, Belgium
10
6 CNRS CRPG Research Unit 7358, Vandoeuvre-lès-Nancy, France
11
7 INSERM Research Unit 1033-Lyos, Hôpital E. Herriot, Lyon, France
12
8 Department of Nuclear Medicine, CHU–Brugmann, Université Libre de Bruxelles (ULB), Brussels, Belgium
13
14
15
16
17
18
19
Corresponding author : Cappelle S.I., e-mail: sylvie.cappelle@chu-brugmann.be
20
21
22
23
Acknowledgements: the study was supported by IRIS-Recherche, CHU Brugmann and the GIPOB. We sincerely thank all
24
the members of the INSERM Research Unit 1033 of Lyon and more particularly Stéphanie Boutroy for her precious
25
expertise. We are also grateful to Pr Thierry Pepersack for his kind and constructive comments.
26
Manuscript Click here to view linked References
1 2 3 4 5 6 7 8 9 10 11 12 13 14 15 16 17 18 19 20 21 22 23 24 25 26 27 28 29 30 31 32 33 34 35 36 37 38 39 40 41 42 43 44 45 46 47 48 49 50 51 52 53 54 55 56 57 58 59 60 61
Highlights
27
417 women of the FRISBEE cohort, matched for FRAX, were evaluated by HR-pQCT
28
Some HR-pQCT parameters, mainly at radius, are discriminating for prevalent fractures
29
HR-pQCT provides valuable information
30
1 2 3 4 5 6 7 8 9 10 11 12 13 14 15 16 17 18 19 20 21 22 23 24 25 26 27 28 29 30 31 32 33 34 35 36 37 38 39 40 41 42 43 44 45 46 47 48 49 50 51 52 53 54 55 56 57 58 59 60Abstract
31
Areal bone mineral density (aBMD) has a low sensitivity to identify women at high fracture risk. The FRAX
32
algorithm, by combining several clinical risk factors, might improve fracture prediction compared to aBMD
33
alone. Several micro-architectural and biomechanical parameters which can be measured by high-resolution
34
peripheral quantitative computed tomography (HR-pQCT) are associated with fracture risk. HR-pQCT in
35
combination or not with finite element analysis (FEA) may be used to improve bone strength prediction.
36
Our aim was to assess whether HR-pQCT measurements (densities, cortical and trabecular microarchitecture,
37
biomechanical proprieties assessed by FEA) had an added value in predicting fractures in a subgroup of women
38
belonging to the Belgian FRISBEE cohort. One hundred nineteen women who sustained a fracture (aged 60 to
39
85 years) during the initial follow-up of our cohort had a radius and tibia examination by HR-pQCT and were
40
compared with controls matched for their FRAX score at baseline. We found that low distal radius total (OR=
41
1.41 [1.07-1.86] per SD, p< 0.05) and trabecular densities (OR= 1.45 [1.10-1.90], p< 0.01), trabecular number (OR=
42
1.32 [1.01-1.72], p< 0.05), intra individual distribution of separation (OR= 0.73 [0.54-0.99], p< 0.05) as several FEA
43
parameters were significantly associated with fractures. At the distal tibia, impaired cortical density (OR= 1.32
44
[1.03-1.70] per SD, p< 0.05) and thickness (OR= 1.29 [1.01-1.63], p< 0.05) and apparent modulus (OR= 1.30
[1.01-45
1.66], p< 0.05) were significantly correlated with fractures. A low ultra distal radial aBMD (UDR) measured at
46
the time of HR-pQCT was significantly associated with fractures (OR= 1.67 [1.22-2.28], p< 0.01). Women from
47
both groups were followed further after the realisation of the HR-pQCT and 46 new fractures were registered. In
48
this second part of the study, low UDR aBMD (OR= 1.66 [1.18-2.35], p< 0.01), total (OR= 1.48 [1.08-2.03], p< 0.05),
49
cortical (OR= 1.40 [1.04-1.87], p< 0.05)and trabecular (OR= 1.37 [1.01-1.85], p< 0.05)densities or apparent modulus
50
(OR= 1.49 [1.07-2.05], p< 0.05) at the radius were associated with a significant increase of fracture risk. At the
51
tibia, only the cortical density was significantly associated with the fracture risk (OR= 1.34 [1.02-2.76], p< 0.05).
52
These results confirm the interest of HR-pQCT measurements for the evaluation of fracture risk, also in women
53
matched for their baseline FRAX score. They also highlight that UDR aBMD contains pertinent information.
54
55
56
Key words: osteoporosis; fracture prediction; HR-pQCT; FRISBEE; FRAX; UDR aBMD
57
58
59
60
61
1 2 3 4 5 6 7 8 9 10 11 12 13 14 15 16 17 18 19 20 21 22 23 24 25 26 27 28 29 30 31 32 33 34 35 36 37 38 39 40 41 42 43 44 45 46 47 48 49 50 51 52 53 54 55 56 57 58 59 60 611. Introduction
62
63
Osteoporosis (OP) is a condition characterized by loss of bone mass and bone micro-architectural
64
deteriorations leading to an increased bone fragility and occurrence of fractures [1]. The mechanical properties
65
of bone tissue and the osseous resistance depend on bone mass and bone quality - a complex notion which refers
66
to a combination of micro-architecture, accumulated microscopic damage, collagen maturity and biomechanical
67
modifications, the degree of mineralization, mineral crystal size, non-collagenous proteins and bone turnover [2].
68
Both bone mass and quality deteriorate with ageing. With increasing life expectancy, the growing size of the
69
ageing population raises the burden of osteoporotic fractures (OFs) and makes it necessary to develop
cost-70
effective screening techniques to identify individuals at high risk of fracture in order to provide them an early
71
and appropriate treatment.
72
73
The operational diagnosis of OP is based on the measurement of areal bone mineral density (aBMD) by
74
dual-energy X-ray absorptiometry (DXA) and defined by a T-score value more than or equal to 2.5 standard
75
deviations (SD) below the young healthy adult mean at lumbar spine, femoral neck or total hip [1]. This classical
76
definition does not allow an optimal risk prediction since more than half of OFs occur in postmenopausal women
77
classified as osteopenic or with normal BMD [3]. The risk ascribable to bone density in subjects with a fragility
78
fracture is lower than 50% [4]. A better prediction of OFs should also take into account factors reflecting bone
79
architecture and biomechanical alterations. These are in part determined by several clinical risk factors (CRFs),
80
such as age, low BMI, corticosteroid therapy, a prior fragility fracture or a parental hip fracture history, which
81
are associated with fracture risk independently of BMD [5].
82
83
These CRFs, alone or in association with BMD, have been combined to construct different models to calculate
84
OFs probabilities at 5 and 10 years [5]. The most widely used is the FRAX score, which is based on a set often
85
CRFs with or without BMD measurement and provides a 10-year probability to sustain a major osteoporotic
86
fracture (MOF: forearm, shoulder, clinical spine or hip fracture) or a hip fracture. This user-friendly online
87
algorithm has largely proven its ability to improve the fracture prediction with regards to BMD alone, resulting
88
in a better selection of patients requiring a treatment on the basis of a threshold fracture risk, for instance a 10
89
year risk above 20% for MOFs [7].
90
Besides, some micro-architectural parameters not included in aBMD measured by DXA could be associated with
91
fracture risk, independently of aBMD. High-resolution peripheral quantitative computed tomography
(HR-92
1 2 3 4 5 6 7 8 9 10 11 12 13 14 15 16 17 18 19 20 21 22 23 24 25 26 27 28 29 30 31 32 33 34 35 36 37 38 39 40 41 42 43 44 45 46 47 48 49 50 51 52 53 54 55 56 57 58 59 60pQCT) has been developed to get insights into bone micro-architecture. It provides a quantitative 3D assessment
93
of the volumetric BMD (vBMD) for the cortical and trabecular compartments. Owing to a high resolution, it
94
allows the evaluation of cortical porosity and indices of trabecular micro-architecture. The data obtained with
95
HR-pQCT also allow a micro-finite element analysis (µFEA) of bone strength [8].
96
Multiple cross-sectional and several prospective studies have shown an association of some HR-pQCT
97
parameters with the presence of prevalent fractures or the risk of incident fractures in men and women, persisting
98
after adjustment for CRFs or hip aBMD [9–11].
99
100
The Fracture RISk Brussels Epidemiological Enquiry (FRISBEE) study is a large population-based
101
cohort study evaluating risk factors for osteoporotic fractures in post-menopausal Belgian women [12]. We used
102
this cohort to evaluate in an ancillary study the impact of HR-pQCT parameters on fracture risk. Bone quality
103
was evaluated by HR-pQCT in a sub-group of FRISBEE volunteers who fractured after inclusion in the study
104
and was compared to that of women with similar FRAX score at baseline but who did not fracture during the
105
same follow-up period. Both groups were then followed for several years to evaluate if HR-pQCT is a useful
106
predictor of OFs, independently of FRAX or aBMD.
107
108
109
2. Study population and methods
110
111
This study is a case-control study nested in the FRISBEE project that has been described elsewhere [12].
112
Briefly, 3560 postmenopausal women, aged between 60 and 85 years, living in the Brussels’ area were recruited
113
between July 2007 and June 2013. Their CRFs for OP or fracture were recorded at baseline and are reevaluated
114
each year by telephone contact. All women underwent a spine and hip aBMD measurement at inclusion.
115
Fractures occurring during follow-up were registered and systematically validated by radiological
116
documentation.117
118
2.1 Participants selection119
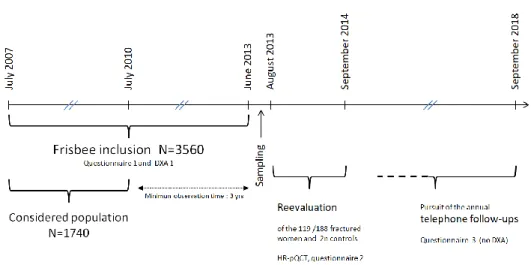
To ensure a minimum follow-up period of three years, only the first 1740 women included in the
120
FRISBEE cohort before July 2010 were considered in the present study (Fig. 1). In July 2013, 188 of them had
121
sustained at least one fragility fracture (for a total of 225 fractures as some participants presented multiple
122
fractures). Between August 2013 and September 2014, these 188 women were re-invited for a quantitative and
123
1 2 3 4 5 6 7 8 9 10 11 12 13 14 15 16 17 18 19 20 21 22 23 24 25 26 27 28 29 30 31 32 33 34 35 36 37 38 39 40 41 42 43 44 45 46 47 48 49 50 51 52 53 54 55 56 57 58 59 60 61qualitative assessment of their bone architecture by HR-pQCT, for a reevaluation of their CRFs and the
124
realization of a second DXA, including a radius aBMD measurement. One hundred and nineteen accepted to
125
participate. Reasons for non-participation of the 69 women with OFs were: refusal to take part at the
126
investigation for medical reasons or age (31), death (10), lost to follow-up (8), recent investigation by their GP,
127
remoteness or missed appointments (20). For each fracture case who accepted to participate, two controls,
128
matched for their baseline FRAX score, were randomly selected among the sub-group of 1740 women who were
129
similarly reevaluated (HR-pQCT, DXA, CRFs). In order to obtain unbiased estimates of relative risk, controls
130
have been selected by incidence density sampling, using the macro developed by Richardson [13]. This method
131
involves matching each fractured woman (case) to a sample of those with similar risk who had not already
132
fractured at the time of case occurrence (selection without replacement). In other words, women with a fracture
133
could be selected as control, as long as they had not fractured. For example, a woman, included in the study in
134
September 2007, who fractured in August 2009 (time to fracture = 2 years) can be considered as a control for
135
any other participant who fractured less than 2 years after her inclusion in FRISBEE (whatever the date of this
136
inclusion). This was the case of 24 participants. As HR-pQCT measurements were performed in more subjects
137
than were necessary for defining the control group, a total of 417 evaluations were available. All these 417
138
participants were followed up and fractures that occurred after the HR-pQCT assessment were registered with
139
the endpoint being the first fracture occurring after the HR-pQCT assessment. This design allowed a hindsight of
140
5.2 ± 0.9 yrs between the inclusion and the realization of the HR-pQCT and a follow-up of 3.6 ± 0.7 yrs after the
141
HR-pQCT (September 2018 evaluation).
142
143
All procedures were approved by the CHU-Brugmann Hospital ethical committee and participant consent was
144
obtained before study initiation(approval number B07720072493).
145
146
2.2 Clinical risk factor data collection - questionnaire and clinical assessments
147
At baseline, all women answered a standardized questionnaire that has been previously described [12].
148
The following clinical and historical data were collected for each subject: age, BMI, age at menopause,
self-149
reported personal history of low-trauma fracture after 50 yrs, history of parental hip fracture, corticosteroid use
150
for more than 3 months, current smoking or excessive alcohol intake (≥ 3 units/day) and chronic diseases known
151
to be causes of secondary osteoporosis. Risk factors not considered in the FRAX model were also collected:
152
notably, a history of falls during the last year, a sedentary lifestyle (defined as < 30 minutes of light activity per
153
day, e.g walking, carrying light loads, bicycling) [12,14], a simple muscle strength evaluation (evaluated by the
154
1 2 3 4 5 6 7 8 9 10 11 12 13 14 15 16 17 18 19 20 21 22 23 24 25 26 27 28 29 30 31 32 33 34 35 36 37 38 39 40 41 42 43 44 45 46 47 48 49 50 51 52 53 54 55 56 57 58 59 60‘sit-to-stand test’ [15]), the use of sleeping pills (benzodiazepines), proton pump inhibitors, selective serotonin
155
reuptake inhibitors and the socio-economic level. Hormone replacement therapy, calcium and vitamin D
156
supplementation or specific treatments for OP were also registered.
157
158
2.3 FRAX score calculation
159
BMD-FRAX score at inclusion was calculated for each participant, using the web application, available
160
at http://www.shef.ac.uk/FRAX/, on the basis of the different CRFs registered at baseline including BMD at the
161
femoral neck. Women with fractures(s) and controls were matched according to their probability of MOFs, with
162
a tolerance of ± 1% for FRAX scores ≤20%, ± 3% above 20% and up to + 8% above 30% (we systematically
163
selected controls with superior FRAX scores in that category). New FRAX scores with BMD were calculated
164
after the second evaluation considering the modifications of the CRFs and the changes in BMD.
165
166
2.4 Fracture ascertainment
167
Only the incident fractures that occurred with minimal or no trauma during follow-up were registered.
168
Fingers, toes, skull and face fractures were not considered. In addition to the MOFs considered in the FRAX
169
model (hip, shoulder, vertebra, wrist), ankle, pelvis, sacrum, elbow, humerus, tibia, scapula, femur and radius
170
fractures were also considered as “other major” fractures in the Frisbee study, as they can directly impact subject
171
morbidity or mortality [16]. If a participant sustained more than one fracture during the follow-up, only the first
172
one was taken into account. All fractures were confirmed by radiographs or surgical reports.
173
174
2.5 Bone mineral density and bone micro-architecture measurements
175
Lumbar spine (LS), total hip (TH) and femoral neck (FN) areal bone mineral density (aBMD, g/cm²)
176
was measured using dual energy X-ray absorptiometry (Hologic System 4500W) following conventional
177
procedures. Ultra distal radius aBMD (UDR aBMD) was measured once at the time of the HR-pQCT.
178
Volumetric density and bone micro-architecture were assessed by HR-pQCT (XtremeCT I; Scanco Medical AG,
179
enabling a nominal resolution or voxel size of 82µm) according to the manufacturer's standard in vivo
180
acquisition protocol (effective energy of 60 kVp, x-ray tube current of 95 mA and matrix size of 1536x1536).
181
Non-dominant distal radius and distal tibia were investigated (if a previous distal radius or tibia fracture was
182
reported, the opposite limb was scanned). Region of interest (ROI) at the radius consisted of a 9 mm length of
183
bone located from 9.5 to 18.5 mm proximal to the midjoint line of the endplate; at the tibia, it was located from
184
22.5 to 31.5 mm proximal to the tibial extremity [17,18]. The choice of a fixed offset distance to define the ROI
185
1 2 3 4 5 6 7 8 9 10 11 12 13 14 15 16 17 18 19 20 21 22 23 24 25 26 27 28 29 30 31 32 33 34 35 36 37 38 39 40 41 42 43 44 45 46 47 48 49 50 51 52 53 54 55 56 57 58 59 60 61rather a relative position scaled to the individual bone length yields ~2% and ~6% error measurement for tibia
186
and radius, respectively [19]. Such uncertainties are significantly lower than the observed inter-individual
187
variability in our cohort. HR‐ pQCT outcomes included: total, cortical and trabecular volumetric bone density
188
(Tt.vBMD, Ct.vBMD and Tb.vBMD, mgHA/cm3); cortical thickness (Ct.Th, μm, direct method [20]) and
189
porosity (Ct.Po, %); trabecular number (Tb.N, mm–1), thickness (Tb.Th; mm), separation (Tb.Sp; mm) and intra
190
individual distribution of separation (Tb.Sp.SD, mm). HR-pQCT precision errors (expressed as CV) vary from
191
less than 1.5% for density measurements to 4.5% for structural parameters [18]. All scans were scored for
192
motion artifact on a scale of 0 (no artifact) to 4 (significant blurring, cortical discontinuities or streaking): grade
193
4 images were excluded [21].
194
195
2.6 Finite element analysis (FEA)
196
FE models were generated using Image Processing Language (IPL) software provided by Scanco
197
Medical. Material properties were chosen isotropic and elastic. Cortical and trabecular bone elements were
198
assigned a Young’s modulus of 20 and 17 GPa, respectively [22]. We considered the following FEA-derived
199
variables: the percentage of load carried by the trabecular and cortical bone at the distal and proximal surface of
200
the volume of interest (Tb.Dist.Load, Tb.Prox.Load, Ct.Dist.Load and Ct.Prox.Load, %, respectively), the
201
average and SD values of the Von Mises stresses in the trabecular and cortical bone (Tb.Av.Stress and
202
Ct.Av.Stress; Tb.SD.stress and Ct.SD.stress, MPa, respectively), the stiffness (kN/mm), the apparent modulus
203
and the estimated failure load (N).
204
205
2.7 Statistical analyses
206
Student’s t-tests were used to compare densities, microarchitecture, and mechanical parameters of
207
women in the 2 groups. For the nested case control analysis, odds ratio estimates (OR) with their 95% CI were
208
obtained using conditional logistic regressions which consider subject matching. Because of the method of
209
controls selection (without replacement from all persons at risk at the time of case occurrence), the sample used
210
is representative of the full cohort and OR should be interpreted as hazard ratios (HR) [23]. Univariate and
211
bivariate (adjustment for OP treatment at the time of HR-pQCT) analysis were conducted.
212
For the 417 patients followed up after HRpQCT, relative risk estimates with their 95% CI were obtained using
213
Cox model, the endpoint being the first fracture occurring after the HR-pQCT assessment. Each parameter was
214
transformed in SD units in order to express outcomes as ORs or HRs per 1 SD diminution. To gain a better
215
understanding of the interrelationship among highly correlated HR-pQCT parameters, we also conducted in both
216
1 2 3 4 5 6 7 8 9 10 11 12 13 14 15 16 17 18 19 20 21 22 23 24 25 26 27 28 29 30 31 32 33 34 35 36 37 38 39 40 41 42 43 44 45 46 47 48 49 50 51 52 53 54 55 56 57 58 59 60parts a principal component analysis (PCA) for the radius and the tibia separately after standardization of the
217
variables. Very simply, PCA transforms the original interrelated variables into a new set of uncorrelated
218
variables called Principal Components (PCs) (e.g. [24]). PCs are linear combinations of the original variables
219
which represent most of the variance of the dataset. Each PC can be interpreted on the basis of the weight of the
220
initial variables. Finally, as these PCs are uncorrelated, they were used in multivariate analysis as predictor of
221
fracture. In the nested case control part, a multivariate conditional logistic analysis was performed using a
222
backward selection model with a p-value cut-off of 0.05. In the second part, we used a Cox model and a
223
backward selection of the PCs with a p-value cut-off of 0.05. All significance probabilities are for two-sided
224
tested and we set the threshold for significance at p<0.05.
225
226
227
3. Results
228
229
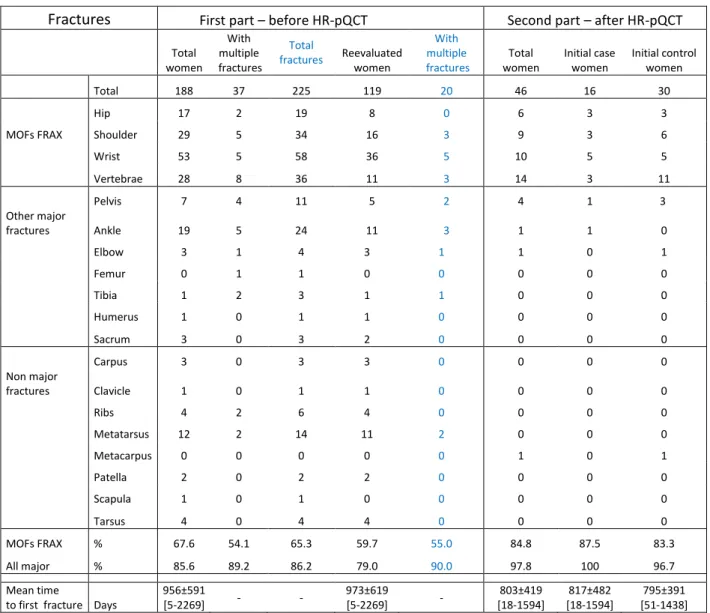
3.1 Fractures230
231
3.1.1 First part (fractures which occurred before HR-pQCT)
232
The main sites of the 225 fractures (including multiple fractures) were the wrist (25.7%), the spine (16.0%), the
233
shoulder (15.1%), the ankle (10.7%) and the hip (9.0%). Out of the 188 considered fractures, 127 were defined
234
as MOFs according to the FRAX model, 34 as “other major” fractures and 27 as minor fractures. Out of the 119
235
fractures of the HR-pQCT group, 71 were defined as MOFs (8 hips, 16 shoulders, 36 wrists, 11 vertebrae), 23 as
236
‘‘other major’’ fractures and 25 as minor fractures. The mean time to first fracture was 2.7 ± 1.7 yrs [5 days - 6.2
237
yrs]. All fracture types and numbers are summarized in Table 1.
238
239
3.1.2 Second part (fractures which occurred after HR-pQCT)
240
Forty six subjects (30 initially control women and 16 already fractured women) fractured after the HR-pQCT
241
evaluation. Thirty nine of these fractures were defined as MOFs (6 hips, 9 shoulders, 10 wrists, 14 vertebrae)
242
according to the FRAX definition and six as “other major” fractures. New incident fractures occurred 2.2 ± 1.1
243
yrs [18 days – 4.4 yrs] after the second evaluation date (Table 1).
244
245
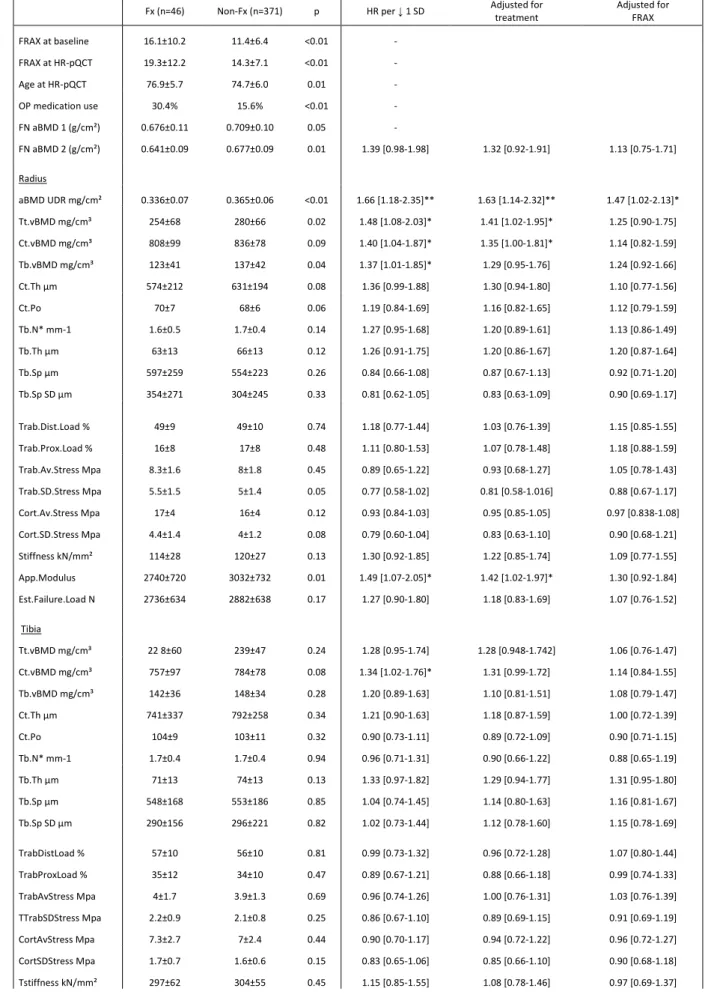
3.2 BMD and HR-pQCT246
247
1 2 3 4 5 6 7 8 9 10 11 12 13 14 15 16 17 18 19 20 21 22 23 24 25 26 27 28 29 30 31 32 33 34 35 36 37 38 39 40 41 42 43 44 45 46 47 48 49 50 51 52 53 54 55 56 57 58 59 60 613.2.1 First part (fractures which occurred before HR-pQCT, n=119)
248
Thirty radius and eight tibiae scans had to be excluded because of poor quality. The percentage of rejected scans
249
did not differ significantly between the fracture and control groups.
250
According to the study design, women with incident fractures after inclusion in FRISBEE did not differ from
251
FRAX-matched controls for the main CRFs included in the FRAX. As expected, FN aBMD was similar in the
252
two groups. On the contrary, ultra distal radial aBMD measured at inclusion in the sub-study was significantly
253
lower in the fractured group (Fx) (Table 2, left part).
254
As shown in Table 2, there were statistically significant differences between control and fractured women for
255
several micro-architectural parameters. Fracture cases had lower total and trabecular densities (p=0.02 and 0.01
256
respectively) and higher Tb.Sp SD (p=0.05) at the radius. At the tibia, women with fractures had lower cortical
257
density, thickness and higher porosity (p=0.01, 0.01 and 0.04, respectively) than controls.
258
Concerning biomechanical parameters: at the radius, both trabecular and cortical SD stresses were higher
259
(p=0.02) in Fx vs non-Fx. Cortical SD stresses were also higher at the tibia (p<0.01). Apparent modulus and
260
estimated failure load were significantly lower at the distal radius (p=0.001 and 0.05) and tibia (p<0.01 and
261
0.03). Women with fractures had lower stiffness at the tibia (p=0.01).
262
At the radius, each SD decrease of Tt.vBMD, Tb.vBMD, Tb.N, Tb.Sp.SD, Trab and Cort.SD.Stress, stiffness,
263
app. modulus and failure load values was significantly associated with fractures (p<0.05). The association
264
remained significant after adjusting for treatment, except for Tb.N. At the distal tibia, each SD decrease of the
265
value of Ct.vBMD, Ct.Th and app. modulus was significantly associated with fractures even after adjusting for
266
treatment (p<0.05) (Table 2. right part).
267
268
3.2.2 Second part (fractures which occurred after HR-pQCT)
269
Table 3 shows the follow-up results of the 417 women included in this sub-study (37 radius and 11 tibiae scans
270
excluded because of poor quality, no difference of percentage of rejected scans between the two groups). No
271
matching for FRAX was realized for this analysis. Women who sustained incident Fx after HR-pQCT had
272
significantly lower density parameters (Tt.vBMD, Tb.vBMD) at the radius (p=0.02 and 0.04 respectively), while
273
no significant difference was observed in structural parameters at the tibia. Ultra distal radial (UDR) aBMD was
274
also significantly lower in the fractured group (p<0.01). FEA showed only a significant difference in the radial
275
apparent modulus between Fx and non-Fx women (p=0.01).
276
In this second part, a decrease of aBMD, Tt.vBMD, Ct.vBMD, Tb.vBMD or app. modulus at the radius was
277
associated with a significant increase of fracture risk (p < 0.05), even after adjusting for treatment (except for
278
1 2 3 4 5 6 7 8 9 10 11 12 13 14 15 16 17 18 19 20 21 22 23 24 25 26 27 28 29 30 31 32 33 34 35 36 37 38 39 40 41 42 43 44 45 46 47 48 49 50 51 52 53 54 55 56 57 58 59 60Tb.vBMD). At the tibia, Ct.vBMD was the only parameter significantly associated with fracture risk. After
279
adjustment for treatment or FRAX recalculated at inclusion into the sub-study, none of the HR-pQCT parameters
280
were still significantly predictive but UDR aBMD remained significantly associated with fracture risk.
281
282
3.2.3 Principal component analysis
283
In the nested case-control study PCA, four principal components explaining at least 10% of the total variance
284
emerged for the radius and the tibia. Together they explained 91% and 86% of the total variability of our whole
285
set of bone characteristics parameters. For the follow-up, we found three (for the radius) and four (for the tibia)
286
principal components explaining at least 10% of the total variance and explaining 82% and 86% of the total
287
variability at the radius and the tibia, respectively. The correlations of each parameter with the PCs are presented
288
in Table 4, where the highest correlations are marked in bold. These correlations indicate the degree and
289
direction of each of the original variables’ contribution to each component.
290
In both PCAs, the composition of the first PC was quite similar at the radius and the tibia, regrouping the total
291
density (and aBMD for the radius) and several qualitative parameters (cortical and trabecular SD stresses,
292
cortical average stress, stiffness, apparent modulus and failure load). Only the first PC of the radius was
293
significantly associated with an increased fracture risk (HR 1.16 [1.04-1.28], p <0.01). This PC explained by
294
itself ~50% of the total variance for the radius. Again, the tibia was less predictive.
295
296
297
4. Discussion
298
299
In this Belgian study, we investigated the predictive value of HR-pQCT for osteoporotic fractures.
300
FRISBEE participants who sustained an incident fracture during the first five years of follow-up were compared
301
to women with similar initial FRAX score. To our knowledge, it is the first study where participants were
302
matched for their FRAX score at inclusion. This approach allows to examine whether HR-pQCT adds
303
information to bone fragility with regards to FRAX with BMD. Moreover, in the second part of the study, all
304
participants were monitored during an average follow-up of 3.6 yrs for the occurrence of fragility fractures.
305
306
In this cohort, only 35 out of the 188 women who sustained a fracture (19%) had a 10-year
307
probability of MOF ≥ 20 % at baseline so that more than 80% of these would not have been taken into account
308
for treatment considering this fixed threshold (76% would not have been treated if BMD alone had been taken
309
1 2 3 4 5 6 7 8 9 10 11 12 13 14 15 16 17 18 19 20 21 22 23 24 25 26 27 28 29 30 31 32 33 34 35 36 37 38 39 40 41 42 43 44 45 46 47 48 49 50 51 52 53 54 55 56 57 58 59 60 61into account). In countries where the threshold for therapy depends on age, these proportions are likely to vary,
310
but a majority of patients would still not be treated. Sornay-Rendu and colleagues found in the OFELY study
311
that approximately half of the women who sustained a fragility fracture were not identified as high risk by the
312
FRAX score [25]. The same was true for the Manitoba cohort-based study or the Lausanne University Hospital
313
study, reflecting that FRAX (and the different defined thresholds) is not always an optimal predictive criteria, as
314
it is the case for BMD [26,27]. Additionally, almost 40% of the women who sustained a fracture (74/188) had an
315
estimated fracture probability lower than 10% (low risk range). These figures and those from other retrospective
316
or prospective cohorts suggest that the FRAX, just as BMD, underestimates the risk of fragility fractures [7].
317
This observation is partially explained by the fact that the score does not consider some CRFs that might have an
318
impact on fracture risk. History of falls and physical activity for example could be important [28].
319
320
Bone strength first depends on bone density: this important factor explains, depending on the studies,
321
between 60 and 80% of the variability of bone strength. However, the bone quality, a concept that describes
322
aspects of bone composition and structure, also contributes to bone strength. There is thus room for possible
323
improvement of fracture prediction, using additional quantitative parameters reflecting the bone structure and/or
324
strength. Several studies suggest that HR-pQCT might outperform DXA in fracture risk prediction [10].
325
Our nested case-control analysis showed that several structural and/or biomechanical parameters characterized
326
those who suffered an incident fracture. This highlights the importance of the structural information.
G
reater327
impairments of the trabecular parameters (Tb.vBMD, TbN, Tb.Sp.SD) were observed at the radius of the
328
fractured women while only cortical density, porosity and thickness were statistically associated with fractures at
329
the tibia. The small number of hip fractures present in our sample may impact these results. However, such
330
discrepancies according to the site of measurement were previously noted in other cross‐ sectional studies
331
comparing HR
-
pQCT parameters in women with and without prevalent fractures [29,30]. It may be explained by332
the broader cortical thickness of the tibia and by the fact that the tibia, in contrast to the radius, is a
weight-333
bearing bone and is hence exposed to other mechanical stimuli that differently impact the architectural
334
parameters. This difference is also observed in FEA results: a majority of the bone resistance parameters were
335
significantly associated with fractures at the radius, while only the apparent modulus differed significantly
336
between the two groups at the tibia.
337
338
In the second part of the study, fewer parameters were predictive for fractures. They were mainly
339
density parameters (Tt.vBMD, Ct.vBMD, Tb.vBMD) and app. modulus at the radius and only D.cort at the tibia.
340
1 2 3 4 5 6 7 8 9 10 11 12 13 14 15 16 17 18 19 20 21 22 23 24 25 26 27 28 29 30 31 32 33 34 35 36 37 38 39 40 41 42 43 44 45 46 47 48 49 50 51 52 53 54 55 56 57 58 59 60No association remained significant after adjustment for the FRAX score, which was significantly higher in the
341
group of patients who sustained a fracture after the HR-pQCT. This can result from the valuable predictive
342
power of the FRAX tool. However this observation could also arise from an insufficient statistical power
343
resulting from a too small number of incident fractures.The 46 fractures observed during the prospective study
344
were indeed far below the total number of events needed considering the ORs of the retrospective part (i.e. 119
345
to 484 depending on the considered HR-pQCT parameter; http://sample-size.net/sample-size-survival-analysis
346
[31]). Nevertheless, the data of this subsequent analysis confirm our first conclusions, with both trabecular and
347
cortical densities lower at the radius when only the cortical density identifies those who will fracture at the tibia,
348
and the HRs of the follow up analysis are significantly correlated with the ORs of the nested case study (data not
349
shown). Moreover, the hazard ratios observed in our study are concordant with those of the large international
350
cohort recently described by Samelson et al, where the risk was increased by around 10 to 60% for 1 SD
351
decrease for each considered parameter [11] (Fig. 2). In that study, HRs were still significant after adjustment for
352
the FRAX.
353
354
We did not find any association of cortical porosity at the radius or the tibia with fractures. The association
355
between this parameter and the occurrence of OFs is indeed quite variable in the literature depending on the
356
method used to define the zone of interest for the evaluation. For example, Kral and colleagues using a new more
357
inclusive algorithm (non-threshold-based software) found a correlation between the cortical porosity and the
358
prevalence of non vertebral fractures, independent of the FRAX score [32]. In contrast and unexpectedly, in the
359
GLOW study, history of fracture was associated with lower cortical porosities [30]. The synthesis of the various
360
prospective studies published by Samelson et al did not show any significant association between cortical
361
porosity and fracture risk [11]. The average great age of our cohort (~75 yrs at HR-pQCT assessment) could also
362
be an explanation: the fact that the majority of bone loss occurs in the cortical compartment after the age of 65
363
years could have led to bias toward null differences between our groups of participants [33].
364
365
Additionally, our results do not indicate that failure load is an independent predictor for fracture (HR 1.22
[0.94-366
1.58]). This is at odds with the BoMIC results [11]. Apart from an insufficient power due to the low rate of
367
fracture events in our cohort, this discrepancy could be explained by different methods for failure load
368
calculation, hampering adequate comparison of our results. In the BoMIC consortium, the used FEA conditions
369
are different from one cohort to another. Authors harmonized the data using a modulus of 6.829 GPa (while we
370
considered two modulus of 17 and 20 GPa for trabecular and cortical bone, respectively). Compared to the
371
1 2 3 4 5 6 7 8 9 10 11 12 13 14 15 16 17 18 19 20 21 22 23 24 25 26 27 28 29 30 31 32 33 34 35 36 37 38 39 40 41 42 43 44 45 46 47 48 49 50 51 52 53 54 55 56 57 58 59 60 61BoMIC methodology, this leads to an increase of the Failure Load in our cohort [34] and therefore to a lower
372
risk. When our results are compared to those of the OFELY and STRAMBO studies (2 cohorts included in the
373
BoMIC), that used the same approach than in Frisbee, the HRs were similar (HR 1.44 [1.21-1.72] and 1.79
374
[1.44-2.23], respectively [29,35])
375
376
Furthermore, considering that, for economic reasons, the assessment of the bone structure and/or
377
strength by HR-pQCT will not replace the systematic screening of fracture risk by DXA and/or FRAX in a
378
nearby future, we examined if specific groups could benefit from this method. Considering the subgroup of our
379
HR-pQCT cohort having a FRAX score < 20% (low and intermediate risk): we found in the second analysis that
380
the trabecular thickness of the radius discriminated participants with incident fractures (p=0.05, data not shown).
381
However, the small number of fractures in this ancillary study precludes drawing definitive conclusions.
382
383
Finally, it is of interest that UDR aBMD provides a lot of information. Significant risk gradient was
384
associated with this parameter both in the nested case and follow up part of the study, with a risk increase of
385
almost 66% per SD decrease. The fact that almost all HR-pQCT ORs were no longer significant after adjustment
386
for UDR aBMD supports this conclusion. This results from the strong correlation between the HR-pQCT
387
parameters and the UDR aBMD. Additionally, UDR aBMD is the only variable that is still significant after
388
adjusting for the FRAX score in the follow-up study, keeping in mind that the statistical power of the
389
prospective part is limited. In their prospective study, Biver et al also demonstrated a very good performance of
390
the UDR aBMD for fracture prediction (HR ~1.75) [36]. This good predictive power is probably explained by
391
the fact that UDR aBDM combines both trabecular and cortical bone and is thus a pertinent composite predictor
392
of bone strength.
393
The strengths of our nested case-control study are that all fragility fractures were prospectively assessed
394
and X-ray verified, all CRFs were collected at baseline and confirmed each year by phone and at the time of
HR-395
pQCT measurements. A restriction of this analysis is the short delay between baseline and the second evaluation
396
(5.2 ± 0.9 yrs), while the FRAX predictions are based on a 10 year risk evaluation. Nevertheless, the design of
397
our study guarantees a similar follow-up duration for the Fx and the non-Fx groups. It is also relevant to note
398
that only 10% of the controls (30/298) had a subsequent fracture during the second period, so during a total
399
period of 8.8 ± 1.1 yrs. In addition to the small number of fractures, the relatively short follow-up (median 3.6
400
yrs) of the prospective part of the study is another weakness because, which can explain that some of the
401
measured parameters were not predictive of fractures.
402
1 2 3 4 5 6 7 8 9 10 11 12 13 14 15 16 17 18 19 20 21 22 23 24 25 26 27 28 29 30 31 32 33 34 35 36 37 38 39 40 41 42 43 44 45 46 47 48 49 50 51 52 53 54 55 56 57 58 59 60In conclusion, although HR-pQCT cannot be considered as a screening tool for now, it may be of
403
interest in some subgroups. It is especially of major interest in the understanding of the biomechanical process of
404
fracture as well as the action of anti-osteoporotic treatments. Our results highlight the superiority of the radius
405
measurements in postmenopausal women and confirm the interest of the UDR aBMD that contains major
406
information on fracture risk. As follow-up is ongoing, a further prospective analysis of incident fractures is
407
planned.408
409
410
411
412
413
1 2 3 4 5 6 7 8 9 10 11 12 13 14 15 16 17 18 19 20 21 22 23 24 25 26 27 28 29 30 31 32 33 34 35 36 37 38 39 40 41 42 43 44 45 46 47 48 49 50 51 52 53 54 55 56 57 58 59 60 61References
414
[1] Consensus development conference: Diagnosis, prophylaxis, and treatment of osteoporosis, The
415
American Journal of Medicine. 94 (1993) 646–650.
https://doi.org/10.1016/0002-416
9343(93)90218-E.
417
[2] I.R. Reid, Overview of Pathogenesis, in: C.J. Rosen (Ed.), Primer on the Metabolic Bone
418
Diseases and Disorders of Mineral Metabolism, John Wiley & Sons, Inc., Ames, USA, 2013: pp.
419
357–360. https://doi.org/10.1002/9781118453926.ch41.
420
[3] WHO, Assessment of Fracture Risk and Its Application to Screening for Postmenopausal
421
Osteoporosis, in: 1994: pp. 1–129.
422
[4] J.A. Kanis, on behalf of the World Health Organisation Scientific Group, Assessment of
423
osteoporosis at the primary healthcare level., WHO Collaborating Centre, University of
424
Sheffield, UK., 2008. http://www.shef.ac.uk/FRAX/ pdfs/WHO_Technical_Report.pdf.
425
[5] J.A. Kanis, Diagnosis of osteoporosis and assessment of fracture risk, The Lancet. 359 (2002)
426
1929–1936. https://doi.org/10.1016/S0140-6736(02)08761-5.
427
[6] J.A. Kanis, N.C. Harvey, H. Johansson, A. Odén, E.V. McCloskey, W.D. Leslie, Overview of
428
Fracture Prediction Tools, Journal of Clinical Densitometry. 20 (2017) 444–450.
429
https://doi.org/10.1016/j.jocd.2017.06.013.
430
[7] X. Jiang, M. Gruner, F. Trémollieres, W. Pluskiewicz, E. Sornay-Rendu, P. Adamczyk, P.F.
431
Schnatz, Diagnostic accuracy of FRAX in predicting the 10-year risk of osteoporotic fractures
432
using the USA treatment thresholds: A systematic review and meta-analysis, Bone. 99 (2017)
433
20–25. https://doi.org/10.1016/j.bone.2017.02.008.
434
[8] R. Krug, A.J. Burghardt, S. Majumdar, T.M. Link, High-Resolution Imaging Techniques for the
435
Assessment of Osteoporosis, Radiologic Clinics of North America. 48 (2010) 601–621.
436
https://doi.org/10.1016/j.rcl.2010.02.015.
437
[9] K.K. Nishiyama, E. Shane, Clinical Imaging of Bone Microarchitecture with HR-pQCT, Curr
438
Osteoporos Rep. 11 (2013) 147–155. https://doi.org/10.1007/s11914-013-0142-7.
439
[10] N. Mikolajewicz, N. Bishop, A.J. Burghardt, L. Folkestad, A. Hall, K.M. Kozloff, P.T. Lukey,
440
M. Molloy‐ Bland, S.N. Morin, A.C. Offiah, J. Shapiro, B. Rietbergen, K. Wager, B.M. Willie,
441
S.V. Komarova, F.H. Glorieux, HR‐ pQCT Measures of Bone Microarchitecture Predict
442
Fracture: Systematic Review and Meta‐ Analysis, J Bone Miner Res. 35 (2020) 446–459.
443
https://doi.org/10.1002/jbmr.3901.
444
[11] E.J. Samelson, K.E. Broe, H. Xu, L. Yang, S. Boyd, E. Biver, P. Szulc, J. Adachi, S. Amin, E.
445
Atkinson, C. Berger, L. Burt, R. Chapurlat, T. Chevalley, S. Ferrari, D. Goltzman, D.A. Hanley,
446
M.T. Hannan, S. Khosla, C.-T. Liu, M. Lorentzon, D. Mellstrom, B. Merle, M. Nethander, R.
447
Rizzoli, E. Sornay-Rendu, B. Van Rietbergen, D. Sundh, A.K.O. Wong, C. Ohlsson, S.
448
Demissie, D.P. Kiel, M.L. Bouxsein, Cortical and trabecular bone microarchitecture as an
449
independent predictor of incident fracture risk in older women and men in the Bone
450
Microarchitecture International Consortium (BoMIC): a prospective study, The Lancet Diabetes
451
& Endocrinology. 7 (2019) 34–43. https://doi.org/10.1016/S2213-8587(18)30308-5.
452
[12] S.I. Cappelle, I. Ramon, C. Dekelver, S. Rozenberg, F. Baleanu, R. Karmali, M. Rubinstein, M.
453
Tondeur, M. Moreau, M. Paesmans, P. Bergmann, J.-J. Body, Distribution of clinical risk factors
454
for fracture in a Brussels cohort of postmenopausal women: The FRISBEE study and
455
comparison with other major cohort studies, Maturitas. 106 (2017) 1–7.
456
https://doi.org/10.1016/j.maturitas.2017.08.010.
457
[13] D.B. Richardson, An incidence density sampling program for nested case-control analyses,
458
Occupational and Environmental Medicine. 61 (2004) e59–e59.
459
https://doi.org/10.1136/oem.2004.014472.
460
[14] A. de Bruin, H.S.J. Picavet, A. Nossikov, eds., Health interview surveys: towards international
461
harmonization of methods and instruments, World Health Organization, Regional Office for
462
Europe, Copenhagen, 1996.
463
[15] M. Csuka, D.J. McCarty, Simple method for measurement of lower extremity muscle strength,
464
The American Journal of Medicine. 78 (1985) 77–81.
https://doi.org/10.1016/0002-465
9343(85)90465-6.
466
1 2 3 4 5 6 7 8 9 10 11 12 13 14 15 16 17 18 19 20 21 22 23 24 25 26 27 28 29 30 31 32 33 34 35 36 37 38 39 40 41 42 43 44 45 46 47 48 49 50 51 52 53 54 55 56 57 58 59 60[16] D. Bliuc, D.N. Nguyen, V.E. Milch, T.V. Nguyen, J.A. Eisman, J.R. Center, Mortality Risk
467
Associated With Low-Trauma Osteoporotic Fracture and Subsequent Fracture in Men and
468
Women, Jama-Journal of the American Medical Association. 301 (2009) 513–521.
469
https://doi.org/10.1001/jama.2009.50.
470
[17] A. Laib, H. Haüselmann, P. Rüegsegger, In vivo high resolution 3D-QCT of the human
471
forearm., Technol Health Care. (1998) 6(5-6):329–37.
472
[18] S. Boutroy, M.L. Bouxsein, F. Munoz, P.D. Delmas, In Vivo Assessment of Trabecular Bone
473
Microarchitecture by High-Resolution Peripheral Quantitative Computed Tomography, The
474
Journal of Clinical Endocrinology & Metabolism. 90 (2005) 6508–6515.
475
https://doi.org/10.1210/jc.2005-1258.
476
[19] S.K. Boyd, Site-Specific Variation of Bone Micro-Architecture in the Distal Radius and Tibia,
477
Journal of Clinical Densitometry. 11 (2008) 424–430.
478
https://doi.org/10.1016/j.jocd.2007.12.013.
479
[20] A.J. Burghardt, H.R. Buie, A. Laib, S. Majumdar, S.K. Boyd, Reproducibility of direct
480
quantitative measures of cortical bone microarchitecture of the distal radius and tibia by
HR-481
pQCT, Bone. 47 (2010) 519–528. https://doi.org/10.1016/j.bone.2010.05.034.
482
[21] M. Sode, A.J. Burghardt, J.-B. Pialat, T.M. Link, S. Majumdar, Quantitative characterization of
483
subject motion in HR-pQCT images of the distal radius and tibia, Bone. 48 (2011) 1291–1297.
484
https://doi.org/10.1016/j.bone.2011.03.755.
485
[22] N. Vilayphiou, S. Boutroy, E. Sornay-rendu, B. Van rietbergen, F. Munoz, P.D. Delmas, R.
486
Chapurlat, Finite element analysis performed on radius and tibia HR-pQCT images and fragility
487
fractures at all sites in postmenopausal women, Bone. 46 (2010) 1030–1037.
488
https://doi.org/10.1016/j.bone.2009.12.015.
489
[23] B. Langholz, Case-Control Studies = Odds Ratios: Blame the Retrospective Model,
490
Epidemiology. 21 (2010) 10–12. https://doi.org/10.1097/EDE.0b013e3181c308f5.
491
[24] Principle component analysis of multivariate time series, in: Multivariate Time Series Analysis
492
and Applications, John Wiley & Sons, Ltd, Chichester, UK, 2019: pp. 139–161.
493
https://doi.org/10.1002/9781119502951.ch4.
494
[25] E. Sornay-Rendu, F. Munoz, P.D. Delmas, R.D. Chapurlat, The FRAX tool in French women:
495
How well does it describe the real incidence of fracture in the OFELY cohort, J Bone Miner Res.
496
25 (2010) 2101–2107. https://doi.org/10.1002/jbmr.106.
497
[26] W.D. Leslie, L.M. Lix, H. Johansson, A. Oden, E. McCloskey, J.A. Kanis, Independent Clinical
498
Validation of a Canadian FRAX Tool: Fracture Prediction and Model Calibration, Journal of
499
Bone and Mineral Research. 25 (2010) 2350–2358. https://doi.org/10.1002/jbmr.123.
500
[27] B. Aubry-Rozier, D. Stoll, M.-A. Krieg, O. Lamy, D. Hans, What was your fracture risk
501
evaluated by FRAX® the day before your osteoporotic fracture?, Clin Rheumatol. 32 (2013)
502
219–223. https://doi.org/10.1007/s10067-012-2106-1.
503
[28] E.W. Gregg, M.A. Pereira, C.J. Caspersen, Physical Activity, Falls, and Fractures Among Older
504
Adults: A Review of the Epidemiologic Evidence, Journal of the American Geriatrics Society.
505
48 (2000) 883–893. https://doi.org/10.1111/j.1532-5415.2000.tb06884.x.
506
[29] S. Boutroy, S. Khosla, E. Sornay-Rendu, M.B. Zanchetta, D.J. McMahon, C.A. Zhang, R.D.
507
Chapurlat, J. Zanchetta, E.M. Stein, C. Bogado, S. Majumdar, A.J. Burghardt, E. Shane,
508
Microarchitecture and Peripheral BMD are Impaired in Postmenopausal White Women With
509
Fracture Independently of Total Hip T -Score: An International Multicenter Study, J Bone Miner
510
Res. 31 (2016) 1158–1166. https://doi.org/10.1002/jbmr.2796.
511
[30] A.E. Litwic, L.D. Westbury, D.E. Robinson, K.A. Ward, C. Cooper, E.M. Dennison, Bone
512
Phenotype Assessed by HRpQCT and Associations with Fracture Risk in the GLOW Study,
513
Calcif Tissue Int. 102 (2018) 14–22. https://doi.org/10.1007/s00223-017-0325-9.
514
[31] M. Levine, M.H.H. Ensom, Post Hoc Power Analysis: An Idea Whose Time Has Passed?,
515
Pharmacotherapy: Official Journal of the American College of Clinical Pharmacy. 21 (2001)
516
405–409. https://doi.org/10.1592/phco.21.5.405.34503.
517
[32] R. Kral, M. Osima, T.T. Borgen, R. Vestgaard, E. Richardsen, Å. Bjørnerem, Increased cortical
518
porosity and reduced cortical thickness of the proximal femur are associated with nonvertebral
519
fracture independent of Fracture Risk Assessment Tool and Garvan estimates in postmenopausal
520
women, PLoS ONE. 12 (2017) e0185363. https://doi.org/10.1371/journal.pone.0185363.
521
1 2 3 4 5 6 7 8 9 10 11 12 13 14 15 16 17 18 19 20 21 22 23 24 25 26 27 28 29 30 31 32 33 34 35 36 37 38 39 40 41 42 43 44 45 46 47 48 49 50 51 52 53 54 55 56 57 58 59 60 61[33] R.M. Zebaze, A. Ghasem-Zadeh, A. Bohte, S. Iuliano-Burns, M. Mirams, R.I. Price, E.J.
522
Mackie, E. Seeman, Intracortical remodelling and porosity in the distal radius and post-mortem
523
femurs of women: a cross-sectional study, The Lancet. 375 (2010) 1729–1736.
524
https://doi.org/10.1016/S0140-6736(10)60320-0.
525
[34] D.E. Whittier, S.L. Manske, D.P. Kiel, M. Bouxsein, S.K. Boyd, Harmonizing finite element
526
modelling for non-invasive strength estimation by high-resolution peripheral quantitative
527
computed tomography, Journal of Biomechanics. 80 (2018) 63–71.
528
https://doi.org/10.1016/j.jbiomech.2018.08.030.
529
[35] P. Szulc, S. Boutroy, R. Chapurlat, Prediction of Fractures in Men Using Bone
530
Microarchitectural Parameters Assessed by High-Resolution Peripheral Quantitative Computed
531
Tomography-The Prospective STRAMBO Study: FRACTURE PREDICTION IN MEN BY
532
BONE MICROARCHITECTURAL MEASURES, J Bone Miner Res. 33 (2018) 1470–1479.
533
https://doi.org/10.1002/jbmr.3451.
534
[36] E. Biver, C. Durosier-Izart, T. Chevalley, B. van Rietbergen, R. Rizzoli, S. Ferrari, Evaluation of
535
Radius Microstructure and Areal Bone Mineral Density Improves Fracture Prediction in
536
Postmenopausal Women, J Bone Miner Res. 33 (2018) 328–337.
537
https://doi.org/10.1002/jbmr.3299.
538
539
540
541
542
543
544
545
546
547
548
549
550
551
552
553
554
555
556
557
1 2 3 4 5 6 7 8 9 10 11 12 13 14 15 16 17 18 19 20 21 22 23 24 25 26 27 28 29 30 31 32 33 34 35 36 37 38 39 40 41 42 43 44 45 46 47 48 49 50 51 52 53 54 55 56 57 58 59 60558
559
560
561
562
Figure 1 - Time line and follow-up of the cohort – Study design
563
564
565
566
567
568
569
570
571
572
573
574
575
576
577
1 2 3 4 5 6 7 8 9 10 11 12 13 14 15 16 17 18 19 20 21 22 23 24 25 26 27 28 29 30 31 32 33 34 35 36 37 38 39 40 41 42 43 44 45 46 47 48 49 50 51 52 53 54 55 56 57 58 59 60 61578
579
580
Figure 2 - Comparison of our results with those of the BoMIC study (data extracted from [11], supplementary
581
Table 2, women results)
582
Association between HR-pQCT indices and incidence of fractures. HRs are expressed per SD unit change in
583
bone parameters in the expected direction of increased fracture risk.
584
Shown error bars represent 95% confidence intervals.
585
586
587
588
589
590
591
592
1 2 3 4 5 6 7 8 9 10 11 12 13 14 15 16 17 18 19 20 21 22 23 24 25 26 27 28 29 30 31 32 33 34 35 36 37 38 39 40 41 42 43 44 45 46 47 48 49 50 51 52 53 54 55 56 57 58 59 60Table 1: Fractures distribution for Major Osteoporotic Fractures (MOF) according to FRAX and other fractures,
593
mean time to first fracture
594
595
596
Fractures
First part – before HR-pQCT Second part – after HR-pQCTTotal women With multiple fractures Total fractures Reevaluated women With multiple fractures Total women Initial case women Initial control women Total 188 37 225 119 20 46 16 30 Hip 17 2 19 8 0 6 3 3
MOFs FRAX Shoulder 29 5 34 16 3 9 3 6
Wrist 53 5 58 36 5 10 5 5 Vertebrae 28 8 36 11 3 14 3 11 Pelvis 7 4 11 5 2 4 1 3 Other major fractures Ankle 19 5 24 11 3 1 1 0 Elbow 3 1 4 3 1 1 0 1 Femur 0 1 1 0 0 0 0 0 Tibia 1 2 3 1 1 0 0 0 Humerus 1 0 1 1 0 0 0 0 Sacrum 3 0 3 2 0 0 0 0 Carpus 3 0 3 3 0 0 0 0 Non major fractures Clavicle 1 0 1 1 0 0 0 0 Ribs 4 2 6 4 0 0 0 0 Metatarsus 12 2 14 11 2 0 0 0 Metacarpus 0 0 0 0 0 1 0 1 Patella 2 0 2 2 0 0 0 0 Scapula 1 0 1 0 0 0 0 0 Tarsus 4 0 4 4 0 0 0 0 MOFs FRAX % 67.6 54.1 65.3 59.7 55.0 84.8 87.5 83.3 All major % 85.6 89.2 86.2 79.0 90.0 97.8 100 96.7 Mean time
to first fracture Days
956±591 [5-2269] - - 973±619 [5-2269] - 803±419 [18-1594] 817±482 [18-1594] 795±391 [51-1438]
597
598
1 2 3 4 5 6 7 8 9 10 11 12 13 14 15 16 17 18 19 20 21 22 23 24 25 26 27 28 29 30 31 32 33 34 35 36 37 38 39 40 41 42 43 44 45 46 47 48 49 50 51 52 53 54 55 56 57 58 59 60 61Table 2: HR-pQCT parameters of the women who fractured between inclusion and HR-QCT (Fx) and their
599
matched controls (C) (mean ± SD, OR [range])
600
Fx (n=119) C (n=238) p OR per ↓ 1 SD OR adjusted for
treatment
OR adjusted for UDRaBMD
Initial FRAX 12,6±6.7 12,6±6.7 NS - - -
Age at baseline (yr) 70.7±6.3 69.9±6.2 NS - - -
Age at HR-pQCT (yr) 76.5±6.3 75.2±6.1 NS - - - FN aBMD at baseline (g/cm²) 0.703±0.09 0.693±0.11 NS - - - FN aBMD at HR-pQCT (g/cm²) 0.668±0.09 0.667±0.09 NS 0.98 [0.71-1.35] 0.93 [0.66-1.30] - OP medication use 12.6% 21.8%. 0.02 Radius aBMD UDR mg/cm² 0.348±0.07 0.365±0.06 0.02 1.67 [1.22-2.28]** 1.63 [1.19-2.23]** - Tt.vBMD mg/cm³ 263±58 280±69 0.02 1.41 [1.07-1.86]* 1.39 [1.05-1.84]* 1.66 [0.99-2.80] Ct.vBMD mg/cm³ 822±78 832±87 0.30 1.16 [0.89-1.50] 1.15 [0.88-1.49] 1.02 [0.70-1.49] Tb.vBMD mg/cm³ 126±39 138±44 0.01 1.45 [1.10-1.90]** 1.43 [1.08-1.89]* 1.29 [0.87-1.92] Ct.Th µm 597±185 626±207 0.19 1.20 [0.92-1.57] 1.18 [0.90-1.55] 1.08 [0.70-1.68] Ct.Po 69±6 68±6 0.13 0.83 [0.65-1.07] 0.84 [0.65-1.08] 0.76 [0.55-1.05] Tb.N* mm-1 1.64±0.42 1.72±0.39 0.07 1.32 [1.01-1.72]* 1.29 [0.98-1.70] 1.05 [0.74-1.49] Tb.Th µm 64±12 66±13 0.25 1.23 [0.94-1.62] 1.21 [0.92-1.60] 1.28 [0.88-1.87] Tb.Sp µm 599±262 554±234 0.11 0.78 [0.59-1.03] 0.78 [0.59-1.04] 1.00 [0.69-1.44] Tb.Sp SD µm 365±296 298±236 0.05 0.73 [0.54-0.99]* 0.74 [0.55-0.99]* 0.90 [0.62-1.31] Trab.Prox.Load % 49±9 50±10 0.45 1.13 [0.87-1.47] 1.12 [0.86-1.46] 1.07 [0.78-1.47] Trab.Dist.Load % 16.7±8.7 17.5±8.2 0.39 1.18 [0.91-1.53] 1.17 [0.90-1.51] 1.08 [0.81-1.46] Trab.Av.Stress Mpa 8.2±1.7 8.1±1.7 0.72 0.90 [0.69-1.18] 0.92 [0.70-1.20] 1.15 [0.80-1.65] Trab.SD.Stress Mpa 5.4±1.4 5.0±1.4 0.02 0.66 [0.49-0.89]** 0.67 [0.50-0.90]** 0.74 [0.47-1.17] Cort.Av.Stress Mpa 16.4±3.9 15.9±3.8 0.21 0.91 [0.83-1.01] 0.92 [0.83-1.01] 0.98 [0.83-1.15] Cort.SD.Stress Mpa 4.3±1.3 4.0±1.2 0.02 0.67 [0.50-0.88]** 0.68 [0.51-0.90]** 0.67 [0.44-1.02] Stiffness kN/mm 116±28 122±27 0.06 1.55 [1.12-2.15]** 1.53 [1.10-2.14]* 1.41 [0.79-2.51] App.Modulus 2802±631 3062±765 0.001 1.67 [1.24-2.25]*** 1.65 [1.23-2.23]** 2.41 [1.43-4.08]** Est.Failure.Load N 2774±665 2919±634 0.05 1.60 [1.14-2.23]** 1.58 [1.13-2.21]** 1.44 [0.82-2.25] Tibia Tt.vBMD mg/cm³ 227±50 237±48 0.07 1.21 [0.94-1.55] 1.20 [0.93-1.54] 1.23 [0.85-1.79] Ct.vBMD mg/cm³ 761±86 785±84 0.01 1.32 [1.03-1.70]* 1.33 [1.04-1.71]* 1.28 [0.94-1.73] Tb.vBMD mg/cm³ 144±34 146±36 0.59 1.04 [0.82-1.32] 1.01 [0.79-1.31] 0.91 [0.66-1.26] Ct.Th µm 713±261 785±272 0.01 1.29 [1.01-1.63]* 1.29 [1.01-1.64]* 1.30 [0.96-1.77] Ct.Po 105±16 103±8 0.04 0.79 [0.62-1.02] 0.79 [0.62-1.02] 0.66 [0.46-0.95]* Tb.N* mm-1 1.7±0.4 1.7±0.4 0.36 0.90 [0.72-1.14] 0.88 [0.69-1.12] 0.82 [0.61-1.09] Tb.Th µm 71±13 74±15 0.07 1.16 [0.92-1.46] 1.15 [0.91-1.46] 1.09 [0.82-1.46] Tb.Sp µm 559±217 558±182 0.98 0.99 [0.78-1.25] 1.01 [0.79-1.29] 1.01 [0.75-1.34] Tb.Sp SD µm 307±257 300±208 0.78 0.96 [0.77-1.21] 0.98 [0.78-1.24] 0.96 [0.73-1.28] Trab.Prox.Load % 57±9.5 56±10.2 0.34 0.95 [0.76-1.18] 0.94 [0.75-1.17] 0.87 [0.68-1.12] Trab.Dist.Load % 35±9.7 34±10.7 0.53 0.91 [0.73-1.11] 0.89 [0.71-1.12] 0.86 [0.66-1.11] Trab.Av.Stress Mpa 4.0±1.3 3.9±1.1 0.28 0.91 [0.73-1.13] 0.92 [0.74-1.14] 0.96 [0.75-1.23] Trab.SD.Stress Mpa 2.2±0.8 2.1±0.7 0.06 0.86 [0.68-1.08] 0.86 [0.68-1.09] 0.95 [0.72-1.25] Cort.Av.Stress Mpa 7.3±2.5 6.9±2.0 0.18 0.89 [0.72-1.13] 0.91 [0.72-1.14] 0.98 [0.74-1.28] Cort.SD.Stress Mpa 1.7±0.7 1.5±0.5 <0.01 0.79 [0.62-1.01] 0.79 [0.62-1.01] 0.84 [0.63-1.12] Stiffness kN/mm 289±58 305±55 0.01 1.27 [0.98-1.66] 1.26 [0.97-1.65] 0.97 [0.68-1.39] 1 2 3 4 5 6 7 8 9 10 11 12 13 14 15 16 17 18 19 20 21 22 23 24 25 26 27 28 29 30 31 32 33 34 35 36 37 38 39 40 41 42 43 44 45 46 47 48 49 50 51 52 53 54 55 56 57 58 59 60
App.Modulus 3242±728 3451±704 <0.01 1.30 [1.01-1.66]* 1.29 [1.01-1.66]* 1.31 [0.94-1.82] Est.Failure.Load N 7040±1244 7338±1269 0.03 1.22 [0.94-1.58] 1.21 [0.93-1.57] 0.93 [0.66-1.31] Significant levels: * p<0.05, ** p<0.01, *** p<0.001
![Figure 2 - Comparison of our results with those of the BoMIC study (data extracted from [11], supplementary 581](https://thumb-eu.123doks.com/thumbv2/123doknet/14786355.598961/21.892.132.761.374.907/figure-comparison-results-bomic-study-data-extracted-supplementary.webp)