HAL Id: insu-02889811
https://hal-insu.archives-ouvertes.fr/insu-02889811
Submitted on 3 Feb 2021
HAL is a multi-disciplinary open access
archive for the deposit and dissemination of
sci-entific research documents, whether they are
pub-lished or not. The documents may come from
teaching and research institutions in France or
abroad, or from public or private research centers.
L’archive ouverte pluridisciplinaire HAL, est
destinée au dépôt et à la diffusion de documents
scientifiques de niveau recherche, publiés ou non,
émanant des établissements d’enseignement et de
recherche français ou étrangers, des laboratoires
publics ou privés.
Observations of atomic deuterium in the mesosphere
from ATLAS 1 with ALAE Instrument
Jean-Loup Bertaux, Eric Quémerais, Florence Goutail, Gaston Kockarts, Bill
R. Sandel
To cite this version:
Jean-Loup Bertaux, Eric Quémerais, Florence Goutail, Gaston Kockarts, Bill R. Sandel.
Observa-tions of atomic deuterium in the mesosphere from ATLAS 1 with ALAE Instrument.
Geophysi-cal Research Letters, American GeophysiGeophysi-cal Union, 1993, 20 (6), pp.507-510. �10.1029/93GL00077�.
�insu-02889811�
GEOPHYSICAL
RESEARCH
LETTERS,
VOL. 20, NO. 6, PAGES
507-510,
MARCH 19, 1993
OBSERVATIONS OF ATOMIC, DEUTERIUM IN THE MESOSPHERE FROM ATLAS 1 WITH ALAE INSTRUMENT
Jean-Loup Bertaux, Eric Qudmerais, Florence Goutall Service d'a.•ronomie du CNRS, Verri[res le Buisson, FRANCE
Gaston Kockarts
InstiCut d'arSrono•nie spa. tia,le de Belgique, Bruxelles, BELGIUM
Bill Sa,nclel
Lunar and Planetaw La. bora, tory, Tucson, USA
Abst'ract. During the first ATLAS' mission, the ALAE Lyma. n a spectropho•ometer collected v,xrious measure- ments ot' hydrogen and deuterium atoms, from the meso- sphere, the therlnosphere, the exosphere and the inter- pla. netary medium. In this paper is presented a prelimi-
nary analysis o1' some obserwztions of atomic deuterium,
which Lyma. n a emission is excited by resonance scatter-
ing of solar photons. Na. dir measurements along the sunlit Earth pa.rt ot' the orbit show that the emission changes as
a •unction of solar zenith Jingle. Comparison with a simple
model shows that,fi'om the shuttle a. ltitude of 300 km and
at low solar zenith angles, the line-of-sight probes atomic
deuterium down t,o S0 km of altitude (where O2 absorp-
tion is complete), whereas at angles from 60 ø to 90 ø, the
mesospheric part of the emission progressively vanishes.
Then, the remaining emission mainly consist of the ther-
toospheric part (" • [00 kin). This type of observations
provides a, som•cli•g of atomic deuterium at its peak pro-
duction a.•d concentra.tion, a, nd D atoms can be used as a
proxy to H atoms (which cannot be observed from • satel-
lite) in this pa. rtic•tlarly active region of the mesosphere. 1. Introduction
The ALAE (Atn•ospheric Lyman Alpha Emissions) in-
strument has successfully flown on board the ATLAS 1
shuttle mission, ['rom.•Ma, rch 24 to April 2, 1992. Tlfis Ly-
man a spectrol)l•oto•netcr, proposed a,nd built in ,% cooper- ation prograph between Service d'A&onomie du CNRS a. nd
the institut d'A•ro•mmie $patiale de Belgique, is devoted
to the study of 1,1•e va.rious Lyma. n a emission processes
from
atoms
of' hydrogen
and deuterium.
During l;he 9 d•ys of the ATLAS I mission, the instru- ment was operated 84 times during a. total of 103 hours, collecting n•ore than twice the amount of data which was originally pla.nned. With various modes of operation of the instrun•ent, m•d various attitudes of the Atlantis shut-
tle, ol)serva, tiotts o1' I-/ and D Lyman c• emissions were
Copyright
1993
by the American
Geophysical
Union.
Paper number 93GL00077
0094-8534/93/93GL-00077503.00
obt;a. ined l¾om the mesosphere, the thermosphere, the exo-
sphere, some [a.int aurorae and the interplanetary medium,
when looking to the na, dir, the limb or the zenith. During the first flight, of ALAE on the Spacelab 1 mis- sion in 1983, the Lynxan a emission of deuterium atoms
wa.s detected [or the first time when looking at the limb,
by t,a. king adva, ntage of the long slant path above 110 km
of altitude (Bert•mx et a.1. 1984). However, the smaller
enfissio•t corning h'om the nadir could not be identified
in the sig•al. This time, thanks to a much higher sensi- tivity of the rel:url)ished Flight Unit •2, placed on board ATLAS 1, the nadir emission of D at, ores coming from
the mesosphere and lower thermosphere could be easily
detected. In this pa, per, we wish to present a sample of
such observa.tions and discuss the significance of this new
type of observation, which allows to probe D atoms in an
important chemical region (85 km of altitude) where H at, ores ca, nnot I)e observed directly [¾om a sa.tellite.
2. tXlodel o1' na. dir deuterium Lyman ce emission
Figure I illustrates a model of vertical distributions of a.t, omic hydrogen and deuterium in the atmosphere. The D profile wa.s ol)ta,ined by scaling tlxe H concentration at the peak by a. factor 1.6 10 -4, which is the D/H ratio in the sea
wa. ter. The two profiles were theIx computed taking into
account the height oœ the turbopause, the thermal escape
flux a.t the exoba,se, and the mass ratio of 2 for D and H
at, Olllb.
In tl•e n•esosl)here, a,nd in particular in the region of product, ion from I-1•0 photodissociation (80-90 kin), the D profile may be considered as parallel to the H profile, in a. first, approxima, tion.
On the dayside, D and H atoms are excited by the res- onance sc•ttering of the intense solar Lyman a, line, two distinct wa.veleng•h: 121.566 nm for H, and 121.533 nm for D. There are m,o resulting Lyman a emissions ,'red Jr), well separated spectra, lly, since the thermal width
of ea,ch of them is oœ the order of 0.003 nm. The ratio
or i•tensities ]r)/l• is larger than the D/H ra, tio, because deuteriu•n is optica. lly dfin, whereas t, he medium is opti- ca. lly thick for H, a,n([ the H Lyman c• emission is saturated when looking downwa,rds fi'om the Aria,ntis a.l•itude of 300 k•n. In hct, it, ca.• be computed that for H, the Lyman a emission genera, l, ed a,l: 85 km cannot reach the altitude 507
508 Berl;aux el al. ß A1;oinic Deuterium in the Mesosphere
250
150
Solar Lycx photons I Solar Lycx photons
1215.33 ',i• 1215.66 ]k
t•rium
•g•ne
'.' Li•i.e.wing
.' ' ß ' ' ' •Solar Lye penetration
O2
.,h__o_,rizon
•.,
depth .•4.•.
. • 02 tb• sorption • . 2O0 Ioo
570z 103 10
•
l0
s
106 l0
?
CONCENTRATION (cm -3)Fig. t. Model of vertical distributions of D a,nd H in the
at, mosphere bet, ween 50 a. nd 250 kin of alt, itude. The D dis- tribut, iou lta,s bee• used to compute ID, taking a. bsorp[ion
of 02 into a.ccou•d,,
'•
[ ...
[!i;...•...!l:
...
x=
60
...
[ for
various
solar
zenith
angles•
•. 14. ... -': • 10 ._o
'•
b
...
•,
;.,.,
:;...-•-...';::•.-.
•--
½0
...
• . ... • ... ,a', ... .':: ...o ....
...
.,
...
>
...
::...:
...
0 • ... ":" ... I .... , .... , ... œ ... 75 100 125 150 175 201 Altitude in kmFig. 2. 1\io(lel of tl•e vo]u•te emission ra.•,e of D atoms as • !'ut•ct,iou of t, lte att, il, ude comput, ed for vm'ious solar
zenith
angles.
The dependence
on •:he
solar
zeni•:h
angle
is due to 02 a.i)sorl)rion. Above 110 kin_, where there is no
(92 a.1)sorl)t, ion, •:r) is independent on
of 300 kin, making impossible •he mea,surement of H a• i•s peak production by remote sensing from a sa•ellke. To our knowledge, •here was only one direc• measuremen• of H wi•h a night-lime rocket experimen• (Sha,rp and Ki•a 1987).
Lyll•a,11 (• ra, diatiotl l'rolll the Sttn or re-emitted by H
or D a[mns is a, bsorbed by O2 in the a.•mosphere. Wi•h
a cross seeLion of 1.69 10 -20 cm -2 for O2 absorption at
12•,533 nm, •he vertical optical depth r for O2 absorption is 0.84 (lbr a, US sCa. itclard a[mosphere model) a• 80 km of a.lt;itude, just below Lite pea!< concentration of H. This is no fortuitous coincidez•ce, since solar Lyman a radiation is the main source o[ H20 photodissociation. Clea, rly, the
penet;ra,tion depth o[ solar Lyman a depends on the solar
zenith a, ngle X- In figure 2 is displayed the volume emission ra•,e eD(-) of D atoms as a function of altitude z and for va. rious va.lues of a,ng]e X, comput. ed from the D profile of
figure 1 and a US sta,ndard atmospheric model for O2
•v(z) (7re
= , ...2
f) F,(vo)[O](z)e-,o•-•,• '(,,•,
(1)?/•'e C
where
ϥ(AD)
= ];•.(VD)
&'
• = 2.75 10 phot,
zt
cm
-2
s-Z
.&-• is the excit,
ing sola.r
flux a.t fhe resona,
nce
wavelength
o[D atoms.
Figure 2 illus[ra.•es ½h•, from a spa.cecr&2 looking a,t •he nadir, •he depdt a• which the D a•oms are observed depends on the solar zenith angie Z. As ½he solar zenith a,ng!e increa.ses, the ]nesospheric contribution progressively
vanishes. Therefore, measuremen½s performed for various
values o[ 5 will provide a. sounding of D a•oms beeween
m 80 knt (X = O) a.i•cl
• 110 km df altitude
(.X = 90ø).
The model predicts a va,riation of ID from 72 Rayleigh at .k = 0ø to 4[ R a.t 'k = 90ø, ibr an observing altitude of 300 kin, showing tl•at, 40 % of the emission I• comes from a part of the mesosphere between 80 and 110 km.
In summary, measuring the nadir Lyman a emission of deuterium atonxs off•rs a new possibility to sound the
chemically very active region where H20 (and HDO)is phot, odissocia•ed, the D at, ores serving as •he most appro-
pria.t,e proxy [o •,he H atoms which cannot be observed
t. hemselves direcl. ly.
Severa.l fa.cLors will have t;o be taken int, o accoun• when
a, ssessing tlte uttcert, aint,y on tl•e determination of D abso- lute dettsity. 'l'he pitotolivet, rio sensitivity of ALAE will be derived from observa.tiolis according t,o the method applied for Spacelab [ observations (Bertaux el, al. 1989)which im- plies a coiItpa,risolt of data, to geocorona,1 H models,
The solar fluxes •;(AD) and 2;' {&i•i) were mea,sured sev- eral t. il•es in the past. Leona. ire el a!. (1978) used with OHO 8 spa.cecraJ't a, high resolution solar profile averaged over n•a•Ly l•Oi•tt, s of t,l•e solar disk, yielding F•(&•) = 2.75
10 • phot (cu• 2 s ,•)-• and 15(&n) = 3.3 10 • pho[ (cm 2 s A)-• Both rallies were measured •o vary wi•h solar
tivity (Vidal-Madjar 1975). The final es•ima.[e of D con-
centralion in the •esosphere will eventually be measured wit, h a• est, i•a,t. ed uncer[a.in•y of • 25 %. A• present, our estimate n•ay be wrong by up [o a, fackor of 2.
The D/H ratio in the mesosphere is unknown a• present,
The sea value at [.6 10 -4 wa.s l, aken in •he presen• model
for illusl. ra. Live purposes. Para. doxically, ALAE is able t0 mea.sure 1,1•e deut,eriunx concent, ration, but no• [l•e D/H ratio in [l•e n•esosphere.
The diurnal varia,[ion of D al,oms was ignored in present, crude modeling. As a firs[ cu•, this is justified
because •nore sopl•istica.[ed photochenfica.1 models show
day •o nigh[ va.
ria[ion of H atoms
(and presumably
D
at, ores) n•ainly below 80 km (Moreels el al. 1977), from wltere the D Lyman o emission is no• visible fi-om highera.ltit,
t•de. ['towever,
a •nore
refined
a.
nMysis,
well beyond
the scope
of ellis
l)aper,
will ga,ke
in•o accoun•
such
a di-
urnal variation, Logether wi•h •he O2 diurnal variations,equa.lly
ignored
here.
and [ra,•spor[,
such
as discussed
by
Liu a•d Dona.
hue
(1974)
and Hunt.
en and S[robel
(1974),
3. Nadir observaLions of deuterium from ATLAS 1
Bertaux
et al. ß Atomic
Deuterium
in the Mesosphere
509t I J. HOLOGRAPHIC CONCAVE
I J HYDROGEN
CELL
GRATIN•G
3200
Lines/ram
.I ; / Mg Ft..• ,.LensOEUTERIUM CELL
H ond D LYMAN-• 5PECTROPHOTOM[TER
SPACELAB-1
Pig. 3. Optical diagra. n• of ALAE. If2 and D2 absorption
cells ma.y I>e a,ctivated separately or simultaneously.
rotating n•irror allows to look in a plane perpendicular to ll•e lol•g axis of the sl•uttle, and was kept fixed toward nadir during the observations presented below, Atlantis
presenting its ca, rgo bay to the Earth. The field-of-view
is 2.5 ø diaaneter, circular, and the holographic grating iso-
lates a ba•dwidth o1' about 4.,5 nm centered at Lyman c•,
therefore excludi•g the strong 0I line at 130.4 nm but in- eluding of cottrse both IH a, nd ID Lyreart c• emissions and
also some A'•I 120 nm emission. One H= and one D2 absorp-
tion cell are placed a. long the light path. Each ceil can be
activated indel•e•dently, when a tungsten filament is elec-
trically heated, dissociating molecules into atoms which scatter a, wa3 • h'om the ma, in light path the photons at the
line center. Phot, o•m a, re counted in two counters, sequen-
tially ope•ed in phase with a. 5 Hz modulation of the D2 cell: one cott•ter Cl, is devoted to photons when the D= cell is off, tile other counter C= being devoted to photons
when tile D2 cell is activated. Each second, counts are
accumula.t, ed in cou•ters C• and 02 for a total counting
time of 0.4 second ead•. The difference 6_5'• - C2 measures
the absorptio• of light by the D-2 cell, thetel'ore is directly li•tked to the lr• en•ission intensity. Usually the D2 cell is used when t, he H2 cell is already on.
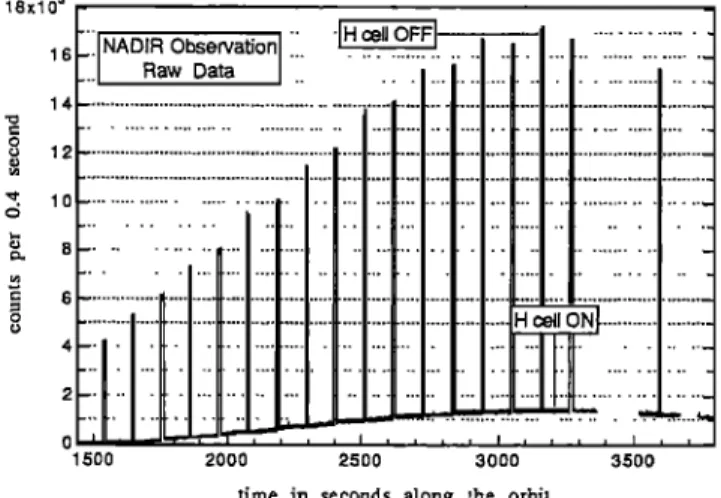
In t-igure 4 is represented the counting rate of C• counter
iD,_, cell ot:t3') during a p2ai?•icula. r orbit for constant nadir ob-
servations, froin slightly before tim morning terminator to
somewhat after tile IDea.1 •oon. The H= cell was activated
most oœ time, and tunted of[' ['or a short while at regular
intervals t,o measure the tot,d Lyman c• emission plus NI 120 nm contribution (strong pea,ks regularly spaced). The intensity varies because the solar zenith angle varies along
the orbil,. T!•e •naxin•uln counting rate is 17 x 10 a counts
per 0.4 second, corresponding roughly to an intensity of :t0 kR (•odel prediction).The H2 cell, when activated, sorbs more than 90% of the total emission (Lyman c• and
TI,, re•na. ining sig•a,l is also strongly va.riable with the pea. l< intensity being • 2.5 kR. It includes the full
c0ntributio, oF ,/¾'I 120 n•n, not affected by the absorption
cell, at a level of 1.5 kR (Meier 1991) and some H Lyman
not absorbed l>y the cell. A similar variation is obtained for counter ('.,, not sllow• here for clarity. The difference G'•-
('= is entirely clue to the pa.rtia, l absorption of the D Lyman
a emission by the D2 cell when the H= cell is a,ctiva.ted.
The
da,ta,
are sho•v•
in figure
5, aRer
averaging
over
60
18xl 03 14 •' 10 4 2 0 • 1500 2000 2500 3000 3500
time in seconds along the orbit
Pig. 4. Nadir n-tw da,ta. for counter C• as a function of
tinm (the tiine scale is the same for figures 4, 5 and 6). These data were obtained with the large field of view (cir-
cular 2.5ø). Tile peaks correspond to periods when the ]'/2
cell is off and measure the total emission. When the H2 cell is on, roughly 90 % of the total emission is absorbed.
4O 36 •, 32 • 28 24 •5 20 [16 • 12 4 0 -4 -8
-..--=w.[-.e--data averaged over 60 seconds ... 110 • ... I with 1 o error bars ... :':•---- solar zenith an•Ie ... 100
90 • 80 • 50 • 40 •' 30 o 20 o : ... !0 :.{ .... ß .... • ... •.-.•.•--:•1 .... t---.•--,-, .... , .... 4 ... ½ .... , .... , .... , .... i .... , .... , .... •.:..• ... }.--•----•---- 0 500 2000 2500 3000 3500
time in seconds along the orbit
Fig. 5. Difference of counters C•- 6'2 as a function of time (san•e tinge scale a.s in figure 4, same session). C• •ea,sul'eS t, lte sig]•al xvit, h the 3_/2 cell on and the D•. cell off
whereas ('2 nleasttres t,l•e signal with both cells activated.
The dif['erence ('• - 6"2 a, ccounts for the fraction of the D
Lyman a eanissioa• which is a. bsorbed by the D2 ceil. The sola.r ze•titlt a•gle, which varies between 43 ø and 100 ø here,
has !)ee• added ['or cmnpa, rison (right-hand scale).
seconds, along with the ! cr statistical error bar. Da•ta shown in l:igures -I and .5 come from the same observation period and a, re representa, tive of tile scale of each signal. Typically the dif[eren('e (.]- C2 is slightly more them 1 % of ('• whe]t the _/'/2 cell is activated, and about 0.1 93 of ('z when the I']2 cell is off. Since, for the moderate absorptio]• power o!' the D2 cell a,s calibrated on the ground with a dettterit,•) resm•ance cell, about half of/'r) should be absorbed, the aver,tg(, ot' 16 counts for C• -C2, measured izt tl•e ra,]•ge 43 ø _< \ _< (50 ø (figure (5), corresponds to iD = 60 R witl•in a factor of 2, in fair agreement with the model ('alcula, tio]t which pre(licts (57 Rayleigh.
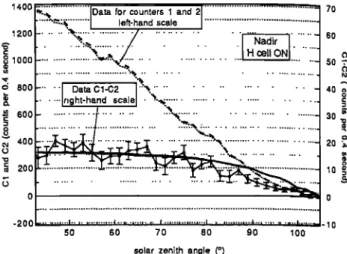
510 Bertaux et al. ß Atomic Deuterium in the Mesosphere .1. Da, ta-nlodel co,npa, rison for ID as a function of solar
zenith angle
In [igure 6, we ha.re a.veraged the data. over a,lmost 4 hours of •a, dir observation and plotted them as a function of \. Tile riglit-hand scale is for the difference between
counters 1 and 2 wl•en file H2 cell is on and is 20 times
sl•mller t. lta, n tlw left-hand scale, which has enabled us to plot bot,h C.'• and 6:2 data, a, long with their difference in
tile saane figure. The 6'1 -6'2 curve, with the 1 ½ statis-
tical eri'or ba.r, clea.rly shows the dependence of the nadir
i•ttensity on the solar ze•lith a, ngle •.
Tills cttrve is COml)ared to a nmdel calculation of ID
(solid line), adjusted to fit, t, he da, ta in the range 4.3 ø < ß
t <- 60ø. The model predicts 67 Rayleigh. The density distributiotl of D was assu•ned to be the one in figure 1,
with no diurnal va, ria, tion. ID was computed as
f300
lB = 10
-•
e• (:) •-•(=) dz
(2)
Jo
where the emissivity was computed in the appropria,te spherica,1 gemnet, ry (equation (1), which holds for plane parallel geometry, is no longer va,lid forx _> 80 ø).
The rcla,tively good agreement of the data and the model
suggests that indeeel the variatio]• in the dat• is due, as
in the model, to tl'•e progressive ma.sking of D atoms by O2 when \ it•creases, a, llowing a. sounding of the region betwee• 80 and 110 km of altitude as explained in section 2.
However, there mW be also some diurnal variation of 02 and of D which ma,y also affect the variation of it) with X a.s suggester.[ by tile discrepmtcy between model and data
in the ra. llge 90ø-100 ø. A complete modeling is foreseen in
the [uture, bttt is beyolid the scope of the present paper.
5. Conclttsion
We l•ave shown ltere only a, limited sample of the 103 hours of data collected during tile ATLAS' 1 mission. It will take some ti•l•e to process this amount of data,, but as we have already shown, here is an opportunity to get intbrmation al)out deuterium and hydrogen in the meso- spl!ere.
The concentrations inferred from the nadir data will be
conapareal to the profiles derived h'om limb observation
data, which enad)les us to study both the mesosphere and
the thennosphere thus bringing information on this impof ta. nt region ot' ottr atmosphere.
A ck', owledg'n• eni s.
The autl•ors are piu-ticularly grateful to ALAE project manager, Em•na.nuel Dimarellis, fbr mastering in due time
all subtleties
of the Spa.
celab
Ground
Control
Center
Com-
bination (POCC) and to his a.ssociat, e, Frantz Semelin,
Tha,nks to the support of the astronaut Dirk Frimout, Gra-
han• Biddis, Mike Bridle, and the whole ATLAS I team at Marshall Space Flight (',enter, we could double our ob- serving t, in•e in respect to the nominal ntission. C•ptMn Bolden and his crew made a superb work in maintaining
Alia,ntis in various a.ttitudes, some of thein dedicated to
A EAE. And fi•a.lly, we wisll to express our best thanks to
Tony O'Neil, mission •nana,ger of ATLAS flights, a, nd to a.n a. noiumous referee R>r very usefill comments.
1400J"•:;
...
IDa
t'•
fo•
co,,nters
i and
21
...
•] 70
[' ... '"'=• ... L left-hand scale ... '1 12001- ... ::•. ... ':•": ... "'"/ .... '•'":'"' ... :'"" ... ,' ' ,:' ... ß
'-' L
'•'.,-,, ./,
I Nadir
]
.'] 60
• / ... i'"'i'" 7 ... I H cell ONI ... ']
1000 •- ... •:'-'%/; ... 6 800 ... I DataCl-C2 1'%. ... 40 • [- ... [right-hand ,ca, e I ... ... L.-..• ... •' 400 ... 0 • 0 - 2 0 0 -,...,-.v-.• ... • ... • ... ::l---r--,---,.--,-.-}--,.-.,.-., ... • ... • - 10 50 60 70 80 90 100
solar zenith angle (o)
Fig. 6. Nadir data for difference of counters (C:l -Cs) as a. functio• of tile solar zenith angle (right-hand scale) and
nadir data t'or counters C, a,nd C2 (left-ha.nd scale). The thick solid li•e sl•oxvs xla.clir !• coinpuled by integration of
the volttt•c et•issio• ra. te of figure 2 with extinction along
the lira-, of sigl•t,. 'l'ltc, curve has been scaled to fit the data lbr \ bet ween ,t:3 ø and (50 ø.
I•el'erences
llerta, ux J.L., (;Ot, tail F., Dimarellis E., Kockarts G. & Van
R.ansbeeck E. 1984, Pirst opticM detection of atomic deu-
terium in the upper mesosphere from Spacelab 1, Nature
309, 77 t-773
Berta, ux J.b., l•e Texier H., Gotttail F., La!!ement R. &
Kockarts G. 198.{.). l•yma. n a, observations of geocoronal and
int, erpla.neta. ry lkydrogen from Spacelab 1: exospheric tem-
pera, lure aa•d dettsity and hot emission, AnnMes Oeophysicae
7, ((5).
][unt, en I).M., Strobel D.F.. 1974, Production and escape of
terrestrial hydrogen, J. Atmos. Sciences, 31, 30,5-317
Lemaire P., Cha, rra ,l.,,]ouchoux A., Vidal-Madjar A., Artzner
G.E., Vial J.C., ]3onaet R..M. & Skumanich A. 1978, Cal- ibra. tod full disk solar H Lynta,n a, and Lyreart /• profiles,
As, trOl)..lourna.l Letters, 223, L$,5-L58
Liu S.L., l)oaahue T.M., L.974, The aeronomy of hydroge, n in the a.tmosphere c)l' lhe l"•arth, J. Atmos. Sciences, 31, 1118-
113(5
Meier R.i{., i991, Ultraviolet spectroscopy and remote sensing
of the upper atmosphere, Space Science Review, 58.1-185
Moreels G., M6gie (l., Va.lla, ce Jones A., Gatlinger R.L., 1979, An oxyge,t-hy(lrogeu a,tmospheric model a, nd its application
to the O I'I ontission problem, J.A.T.P., 39,551-570
Vida,l-Madja,r A. '1975, Solar Physics, 40, 65
Sharp W.E. & Kita. D. 1987, In situ mea,surmnent of atomic
hydrogen in the upI>,er mesosphere, JGR, 92, D4, 4319-4324
J.L. Bertaux, E. Qu&nerais, F. Gouta.il, Service d'A&'onomie
du (:NITS, BP 3, 91371, Vetfibres le Butsson, France
G. Kocka.rts, htstit, ut d'A(?ronomie Spattale de Belgique, 3
aveuue circulaire, B-i 180, UC, CLE Bruxelles, Belgique
B. Sandel, 901 (lould Simpson Building, University of Aft-
zona, Tucsou, AZ 85721. USA
(Received July 23, 1992;
]'ex:ised November 20, 1992;
![Fig. 2. 1\io(lel of tl•e vo]u•te emission ra.•,e of D atoms as • !'ut•ct,iou of t, lte att, il, ude comput, ed for vm'ious solar](https://thumb-eu.123doks.com/thumbv2/123doknet/14799402.605438/3.847.62.412.69.350/fig-lel-emission-atoms-iou-comput-ious-solar.webp)