HAL Id: hal-00302240
https://hal.archives-ouvertes.fr/hal-00302240
Submitted on 26 Oct 2006HAL is a multi-disciplinary open access
archive for the deposit and dissemination of sci-entific research documents, whether they are pub-lished or not. The documents may come from teaching and research institutions in France or abroad, or from public or private research centers.
L’archive ouverte pluridisciplinaire HAL, est destinée au dépôt et à la diffusion de documents scientifiques de niveau recherche, publiés ou non, émanant des établissements d’enseignement et de recherche français ou étrangers, des laboratoires publics ou privés.
Simultaneous ground-based observations of O3, HCl,
N2O, and CH4 over Toronto, Canada by three Fourier
transform spectrometers with different resolutions
D. Wunch, J. R. Taylor, D. Fu, P. Bernath, J. R. Drummond, C. Midwinter,
K. Strong, K. A. Walker
To cite this version:
D. Wunch, J. R. Taylor, D. Fu, P. Bernath, J. R. Drummond, et al.. Simultaneous ground-based ob-servations of O3, HCl, N2O, and CH4 over Toronto, Canada by three Fourier transform spectrometers with different resolutions. Atmospheric Chemistry and Physics Discussions, European Geosciences Union, 2006, 6 (5), pp.10883-10928. �hal-00302240�
ACPD
6, 10883–10928, 2006 Simultaneous Observations with Three FTSs D. Wunch et al. Title Page Abstract Introduction Conclusions References Tables Figures J I J I Back CloseFull Screen / Esc
Printer-friendly Version Interactive Discussion
Atmos. Chem. Phys. Discuss., 6, 10883–10928, 2006 www.atmos-chem-phys-discuss.net/6/10883/2006/ © Author(s) 2006. This work is licensed
under a Creative Commons License.
Atmospheric Chemistry and Physics Discussions
Simultaneous ground-based observations
of O
3
, HCl, N
2
O, and CH
4
over Toronto,
Canada by three Fourier transform
spectrometers with di
fferent resolutions
D. Wunch1, J. R. Taylor1, D. Fu2, P. Bernath2,3, J. R. Drummond1,4, C. Midwinter1, K. Strong1, and K. A. Walker1,2
1
Department of Physics, University of Toronto, Toronto, ON, M5S 1A7, Canada
2
Department of Chemistry, University of Waterloo, Waterloo, ON, N2L 3G1, Canada
3
Department of Chemistry, University of York, Heslington, York, YO10 5DD, UK
4
Department of Physics and Atmospheric Science, Dalhousie University, Halifax, NS, B3H 3J5, Canada
Received: 19 September 2006 – Accepted: 19 October 2006 – Published: 26 October 2006 Correspondence to: D. Wunch ([email protected])
ACPD
6, 10883–10928, 2006 Simultaneous Observations with Three FTSs D. Wunch et al. Title Page Abstract Introduction Conclusions References Tables Figures J I J I Back CloseFull Screen / Esc
Printer-friendly Version Interactive Discussion
EGU
Abstract
An intercomparison of three Fourier transform spectrometers (FTSs) with significantly different resolutions is presented. The highest-resolution instrument has a maximum optical path difference of 250 cm, and the two lower-resolution instruments have max-imum optical path differences of 50 cm and 25 cm. The results indicate that the two
5
lower-resolution instruments can retrieve total column amounts of O3, HCl, N2O and CH4 using the SFIT2 retrieval code with percent differences from the high-resolution instrument generally better than 3%, with respect to the high-resolution FTS. Total col-umn amounts of the stratospheric species (O3 and HCl) have larger differences than those of the tropospheric species (N2O and CH4). Instrument line shape (ILS)
informa-10
tion is found to be of critical importance when retrieving total columns of stratospheric gases from the lower-resolution instruments. Including the ILS information in the re-trievals significantly reduces the difference in total column amounts between the three instruments. The remaining errors for stratospheric species total column amounts can be attributed to the lower sensitivity of the lower-resolution FTSs to the stratosphere.
15
1 Introduction
Ground-based measurements of infrared solar absorption by atmospheric trace gases using Fourier transform spectrometers (FTSs), have led to many important advances in our understanding of the atmosphere. This study presents an investigation of the di ffer-ences in retrieved total column amounts of trace gases by three instruments of differing
20
resolution. Previous intercomparisons of ground-based FTS observations have mainly focused upon the agreement of the retrieved quantities with instruments of similar reso-lution (Paton-Walsh et al.,1997;Goldman et al.,1999;Meier et al.,2005;Griffith et al., 2003) based on different analysis techniques (Goldman et al.,1999;Hase et al.,2004), or addressed how the influence of individual instrument performance impacts the
re-25
ACPD
6, 10883–10928, 2006 Simultaneous Observations with Three FTSs D. Wunch et al. Title Page Abstract Introduction Conclusions References Tables Figures J I J I Back CloseFull Screen / Esc
Printer-friendly Version Interactive Discussion
et al.,1999). Paton-Walsh et al.(1997) compared two instruments operating at a 0.005 cm−1 resolution for retrieving total columns of HCl, N2O and HNO3, and at 0.07 cm−1 for retrieving HF columns. Goldman et al. (1999) compared N2, HF, HCl, CH4, O3, N2O, HNO3and CO2total columns measured by four FTSs at 50 cm maximum optical path difference (OPD).Meier et al. (2005) compared total columns of HCl, HF, N2O,
5
HNO3, CH4, O3, CO2and N2from two high-resolution instruments (the maximum OPD used is unspecified in the paper).Griffith et al.(2003) compared total columns of N2O, N2, CH4, O3, HCl, HNO3 and HF with two FTSs operating both at 180 cm maximum OPD (for all molecules except HF) and at 150 cm maximum OPD (for HF). There are no comparisons, to our knowledge, that look at total columns produced by data from
10
FTS instruments with significantly different resolutions.
In this study, we compare two FTS instruments that are used both on balloon platforms and on the ground to one that is used solely for ground-based measure-ments. The two balloon-based and ground-based instruments, called the University of Toronto’s Fourier Transform Spectrometer (U of T FTS) and the Portable Atmospheric
15
Research Interferometric Spectrometer for the Infrared (PARIS-IR), have spectral res-olutions corresponding to 50 cm and 25 cm OPD, respectively. Both instruments have participated in the 2004 Middle Atmosphere Nitrogen TRend Assessment (MANTRA) high-altitude balloon campaign (Strong et al.,2005). The ground-based FTS, called the Toronto Atmospheric Observatory Fourier Transform Spectrometer (TAO-FTS), has a
20
maximum OPD of 250 cm, and is a complementary instrument of the Network for the Detection of Atmospheric Composition Change (NDACC–formerly the Network for the Detection of Stratospheric Change (NDSC)Kurylo and Zander,2000).
The goals of this intercomparison are to retrieve total column amounts of ozone (O3), hydrogen chloride (HCl), nitrous oxide (N2O), and methane (CH4) from the data
25
recorded simultaneously by these three instruments, to determine which retrieval pa-rameters most affect and improve the retrieved column amounts for the lower-resolution instruments, and to determine the causes of any remaining discrepancies.
ACPD
6, 10883–10928, 2006 Simultaneous Observations with Three FTSs D. Wunch et al. Title Page Abstract Introduction Conclusions References Tables Figures J I J I Back CloseFull Screen / Esc
Printer-friendly Version Interactive Discussion
EGU
2 Instruments
2.1 TAO FTS
The Toronto Atmospheric Observatory (43◦400N, 79◦240W, 174.0 m) was established in 2001 with the installation of a high-resolution, DA8 model infrared Fourier transform spectrometer manufactured by ABB Bomem Inc. The TAO-FTS was designated a
com-5
plementary instrument of the NDACC in March, 2004. Since then, the TAO-FTS has taken part in both satellite validation activities (Mahieu et al., 2005;Dils et al.,2006) and scientific process studies (Wiacek et al.,2006).
The optical design of the TAO-FTS instrument consists of a vertically oriented, linear Michelson interferometer that records single-sided interferograms with a maximum
op-10
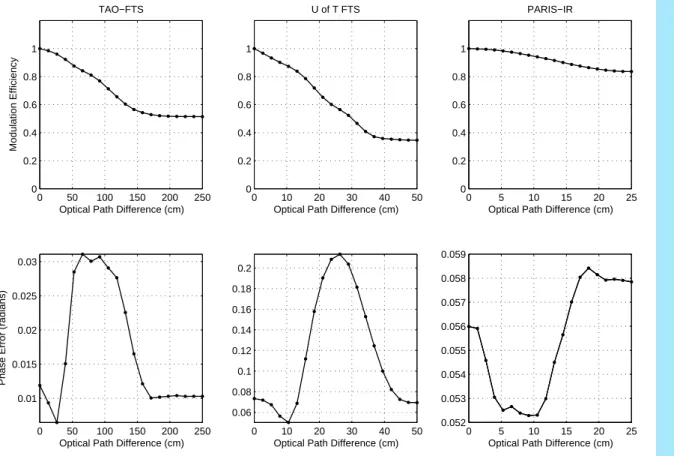
tical path difference of 250 cm (Wiacek et al.,in press). The modulation efficiency and phase error are shown in the left-most panels of Fig.1. Infrared solar absorption spec-tra are nominally recorded on indium antimonide (InSb) and mercury cadmium telluride (MCT) detectors using a potassium bromide (KBr) beamsplitter to cover the spectral region from 750 to 4400 cm−1 (2.3–13.3 µm). The external optical components include
15
a dedicated elevation-azimuth tracker (manufactured by AIM Controls Inc.) which ac-tively tracks direct solar radiation throughout the day, as well as several flat mirrors and a collimating mirror used to direct the radiation into the interferometer.
Observations are usually taken by sequencing through six different narrow-band opti-cal interference filters, all of which are widely used within the NDACC InfraRed Working
20
Group (IRWG). For the purposes of this campaign, only one of these filters is used with the InSb detector, reducing the spectral range to 2400–3100 cm−1 (3.2–4.2 µm). This range is ideal for this study because it contains signatures of the molecules of interest in a spectral region that is measured by the other two instruments. To attain a su ffi-ciently high signal-to-noise ratio, each spectrum is produced by co-adding four, 250-cm
25
optical path difference scans, resulting in one interferogram attained over a period of approximately 20 min. Each interferogram is Fourier transformed into a spectrum using
ACPD
6, 10883–10928, 2006 Simultaneous Observations with Three FTSs D. Wunch et al. Title Page Abstract Introduction Conclusions References Tables Figures J I J I Back CloseFull Screen / Esc
Printer-friendly Version Interactive Discussion
a boxcar apodization scheme (i.e. unapodized). 2.2 U of T FTS
The University of Toronto’s Fourier Transform Spectrometer is an ABB Bomem DA5 instrument that has a 50-cm maximum optical path difference, and records single-sided interferograms along a linear mirror path (Wunch et al., 2006). The instrument
5
measures simultaneously on InSb and MCT detectors. Both detectors are photovoltaic in order to ensure linearity. The U of T FTS has a spectral range spanning 1200– 5000 cm−1 (2–8.3 µm) that is constrained by the detectors, the calcium fluoride (CaF2) beamsplitter and a germanium solar filter.
The instrument has had new electronics and software installed so that it can be used
10
both on high-altitude balloon platforms and on the ground. The U of T FTS has also been fitted with a sun tracker with a small tracking range (±10◦ in both elevation and azimuth). The tracker is used for this intercomparison to easily couple the solar beam from the TAO sun tracker into the U of T FTS.
The instrument lineshape of the U of T FTS is imperfect (Fig. 1, middle panels),
15
due to a hard landing after the MANTRA 2004 balloon flight, reducing the effective resolution to near 0.03 cm−1 and causing a significant phase error. To make the best use of the data, interferograms from the U of T FTS are apodized with a triangular function. This improves the signal-to-noise ratio of the data without significant further loss of resolution.
20
For the purpose of this intercomparison campaign, only data from the MCT detector are shown as there were ongoing InSb detector mount changes. The ranges of the two detectors overlap in all regions of interest for this study.
2.3 PARIS-IR
The Atmospheric Chemistry Experiment Fourier Transform Spectrometer (ACE-FTS)
25
ACPD
6, 10883–10928, 2006 Simultaneous Observations with Three FTSs D. Wunch et al. Title Page Abstract Introduction Conclusions References Tables Figures J I J I Back CloseFull Screen / Esc
Printer-friendly Version Interactive Discussion
EGU was launched by NASA on 12 August 2003 (Bernath et al., 2005). The Portable
At-mospheric Research Interferometric Spectrometer for the Infrared is a new, compact, portable FTS built by ABB Bomem for the Waterloo Atmospheric Observatory (43◦ 280N, 80◦330W, 319.0 m) (Fu et al.,2006). PARIS-IR was primarily constructed from spare flight components that were manufactured for the ACE-FTS and consequently
5
has a very similar optical design, producing double-sided interferograms with the same maximum OPD (25 cm) and spectral range (750–4400 cm−1). The sandwich detectors are composed of a photovoltaic InSb detector and a photoconductive MCT detector, which is corrected for detector nonlinearity. The data presented here, however, are only from the InSb detector. To obtain a sufficiently long optical path difference within a
com-10
pact volume, ABB Bomem used a “double pendulum” interferometer and also used an “entrance mirror” to pass radiation through the interferometer twice. In addition to the MANTRA campaign in August 2004, PARIS-IR has participated in three ground-based ACE validation campaigns in the Canadian high Arctic at Eureka, Nunavut (Kerzen-macher et al.,2005). Currently, the instrument is regularly operated at the Waterloo
15
Atmospheric Observatory (WAO) for recording ground-based atmospheric absorption spectra. The PARIS-IR modulation efficiency and phase error are shown in the right-most panels of Fig.1. The PARIS-IR interferograms are unapodized.
3 Observation strategy and analysis method
The observation strategy for the campaign was constructed to focus on the effects
20
of the instrument resolution on the retrieved column amounts. This was achieved by measuring simultaneously from the same location, in the same spectral range, and using similar retrieval methods with identical a priori information, line parameters and forward model. All three instruments were located at TAO for the duration of the cam-paign. The data presented here were recorded on 24 August, 26 August, 1 September
25
and 2 September 2005, with at least 14 spectra recorded by the TAO-FTS on each day. Retrievals for all three instruments were executed using SFIT2 (v.3.82beta3)
(Rins-ACPD
6, 10883–10928, 2006 Simultaneous Observations with Three FTSs D. Wunch et al. Title Page Abstract Introduction Conclusions References Tables Figures J I J I Back CloseFull Screen / Esc
Printer-friendly Version Interactive Discussion
land et al.,1998;Pougatchev et al.,1995) and the same input parameters. SFIT2 is a retrieval algorithm based on the SFIT1 algorithm (Rinsland et al.,1982) that employs the optimal estimation method (OEM) ofRodgers (2000). This algorithm retrieves a state vector that consists of the primary trace gas volume mixing ratio (VMR) vertical profile represented on an altitude grid, interfering species fit from scaled VMR profiles,
5
and other ancillary fitting parameters.
The model atmospheres were generated by FSCATM (Gallery et al., 1983; Meier et al.,2004), a nonlinear forward model that uses an a priori state estimate, pressure profiles, and temperature profiles to perform refractive ray tracing and a calculation of the air mass distribution for a model atmosphere. The a priori state estimates of
10
VMR profiles and columns were constructed from a combination of climatological esti-mates from the HALogen Occultation Experiment (HALOE) v.19 satellite data (Russell et al.,1994) and mid-latitude daytime 2001 Michelson Interferometer for Passive Atmo-spheric Sounding (MIPAS) reference profiles (Carli et al.,2004). Details of the a priori construction can be found inWiacek et al.(in press) and in Sect. 4.1 ofWiacek(2006).
15
Pressure and temperature profiles were obtained from National Centers for Environ-mental Prediction/National Center for Atmospheric Research analyses provided by the NASA Goddard Space Flight Centre automailer (Schoeberl et al.). The HIgh resolution TRANsmission molecular absorption database (HITRAN) 2004 (Rothman et al.,2005) was used for the spectroscopic line parameters.
20
To measure the same atmospheric path simultaneously with all three instruments, two small pick-off mirrors were placed in the TAO suntracker’s solar beam to deflect a portion of the light into the U of T FTS and PARIS-IR (see Fig.2). Every attempt was made to ensure that the TAO FTS incurred a minimal loss of signal, and that its signal-to-noise ratio was reduced by less than 10%. The TAO instrument, as described
25
in Sect. 2.1, requires 5 min to record one interferogram and ∼20 min for a spectrum derived from 4 co-added interferograms. To further ensure simultaneity, the U of T FTS and PARIS-IR co-added individual spectra that were recorded during the 20-min inter-val required to produce one TAO-FTS spectrum. The PARIS-IR instrument measures
ACPD
6, 10883–10928, 2006 Simultaneous Observations with Three FTSs D. Wunch et al. Title Page Abstract Introduction Conclusions References Tables Figures J I J I Back CloseFull Screen / Esc
Printer-friendly Version Interactive Discussion
EGU the largest number of spectra per unit time, with a 20-s scan time, whereas the U of T
FTS measures one interferogram in 50 s. Table1summarizes the instrument details. The three FTS instruments measured solar absorption by O3, CH4, HCl, and N2O in overlapping regions of their spectral ranges. The five microwindows used in this campaign are listed in Table 2. Two microwindows for ozone (near 3040 cm−1 and
5
2775 cm−1) were chosen because they yielded the highest degrees of freedom for signal for the lower resolution instruments in the spectral range considered, compared with the more commonly used 3045 cm−1 microwindow (e.g., Goldman et al., 1999, Griffith et al.,2003). It should be noted that the best ozone retrievals for the PARIS-IR instrument come from the 1000 cm−1band, but in the interest of consistency, retrievals
10
of ozone are considered only in the spectral ranges measured by all three instruments. The only difference between the three retrieval methods is that the PARIS-IR re-trievals were performed on a 29-layer grid, whereas the TAO and U of T FTS rere-trievals were performed on a 38-layer grid. As discussed in Sect.3.4below, this made only a small difference in the resulting column amounts.
15
By eliminating atmospheric condition differences between measurements, eliminat-ing differences in line parameter characterization and minimizing the differences in the retrieval methods, the bulk of the discrepancies can now be attributed to differences in instrument resolution.
3.1 Instrument Line Shape
20
The importance of considering the influence of an individual instrument line shape (ILS) for ground-based comparisons has been previously addressed (Griffith et al., 2003) and is particularly important in this case because of the pronounced differences in the resolution of the three instruments. Information about the ILS can be incorpo-rated in the forward model by using tabular inputs to describe the effective apodization
25
and phase error as a function of OPD, or by using polynomial coefficients to describe effective apodization parameters (EAP) and phase error parameters (PHS).
spec-ACPD
6, 10883–10928, 2006 Simultaneous Observations with Three FTSs D. Wunch et al. Title Page Abstract Introduction Conclusions References Tables Figures J I J I Back CloseFull Screen / Esc
Printer-friendly Version Interactive Discussion
trometers must be analysed to determine the values of these empirical parameters. This can be done under controlled conditions using calibrated gas cells (Coffey et al., 1998) and an independent retrieval algorithm designed to determine ILS information. We used the LINEFIT code ofHase et al.(1999): version 9.0 for the U of T FTS and TAO-FTS and version 11.0 for the PARIS-IR. The U of T FTS and TAO-FTS measured
5
blackbody radiation through an HBr cell to calculate the ILS, and PARIS-IR measured blackbody radiation through an N2O cell. LINEFIT produces tabular modulation ef-ficiency and phase error results as a function of OPD, which, once the modulation efficiency values are converted to effective apodization values, can be used as inputs into SFIT2. Inherent in this technique is the assumption that the ILS measured under
10
these controlled conditions is identical to the ILS throughout the duration of all atmo-spheric measurements. This may be largely true over a few months for ground-based measurements, however, it will not generally be true for balloon-based measurements, since temperatures change significantly between daytime and nighttime, and both the atmospheric temperature and pressure vary significantly between the ground and the
15
float altitude. Both temperature and pressure can affect the instrument alignment and thus the ILS. Because of this, we may wish to calculate the ILS for each spectrum individually. Without a permanent gas cell in the optical path of each spectrometer during solar measurements (which none of these instruments possess), a method for retrieving ILS information from the solar spectrum itself is necessary.
20
SFIT2 provides a solution for this with a parameter that allows for EAP and PHS polynomial coefficients to be retrieved as part of the state vector. We chose to retrieve third-order polynomial coefficients for both the PHS and EAP parameters. In the sec-tions that follow, when we discuss “tabular” ILS information, we are referring to LINEFIT results used as an input to SFIT2. Retrievals using the LINEFIT tabular inputs will be
25
labeled “ILS input”. When we discuss “polynomial” ILS information, we are referring to the PHS and EAP parameters retrieved from SFIT2. Retrievals that contain PHS and EAP parameters from SFIT2 will be referred to as “PHS/EAP retrieved”. When neither the LINEFIT tabular nor SFIT2 polynomial ILS information is included in a retrieval, we
ACPD
6, 10883–10928, 2006 Simultaneous Observations with Three FTSs D. Wunch et al. Title Page Abstract Introduction Conclusions References Tables Figures J I J I Back CloseFull Screen / Esc
Printer-friendly Version Interactive Discussion
EGU will call this our “standard retrieval”. The TAO-FTS regularly retrieves a simple phase
parameter (SPHS) from SFIT2. SPHS is a single-parameter description of the asym-metry of a spectral line, and is included in all three retrieval types (ILS input, PHS/EAP retrieved and the standard retrieval).
The U of T FTS and PARIS-IR instruments retrieve PHS and EAP information
some-5
what differently. The method employed for the U of T FTS spectra retrieves third-order polynomial PHS and EAP parameters from the same microwindow as the retrieved species (that is, only one retrieval is necessary for each molecule). The method em-ployed for the PARIS-IR data, however, retrieves third-order polynomial PHS and EAP parameters from a very broad N2O band in the 2806.1–2808.1 cm−1 microwindow,
10
using a priori values from LINEFIT, and fixes the daily mean of those values for all spectra when retrieving the other species. (EAP and PHS parameters can also be re-trieved from each spectrum, but for reasons of efficiency, we use daily means, here.) This method was attempted for the U of T FTS data with less success than directly retrieving the parameters from the same microwindow. We believe that the success of
15
the second, dedicated microwindow for retrieving the ILS parameters for the PARIS-IR instrument may be in part due to the lower degrees of freedom for signal retrieved from the PARIS-IR spectra. Instead of retrieving profile, PHS and EAP information from a given microwindow with limited information, we are providing extra ILS information from the same spectrum, but in a different microwindow.
20
3.2 Effects of resolution
To simulate the effect of resolution on total column amounts, an ensemble of 16 spectra was simulated for the same atmospheric conditions for each of 12 cm, 25 cm, 50 cm, 100 cm, 150 cm, 200 cm and 250 cm maximum OPD. The signal-to-noise ratio was set to 250 for each spectrum to simulate a typical measurement noise value, and all four
25
molecules were retrieved using the same a priori values as our data from 1 September. Identical phase and effective apodization errors were applied to each spectrum, with values similar to the TAO instrument (Fig. 1, left-most panels). All results below are
ACPD
6, 10883–10928, 2006 Simultaneous Observations with Three FTSs D. Wunch et al. Title Page Abstract Introduction Conclusions References Tables Figures J I J I Back CloseFull Screen / Esc
Printer-friendly Version Interactive Discussion
consistent with an ensemble of measured spectra from a single day of TAO measure-ments for which the interferograms were truncated to the same set of OPD values.
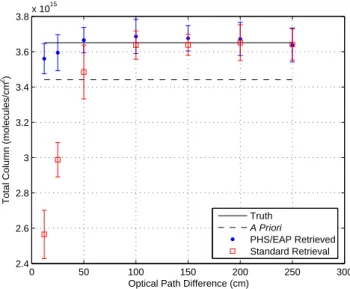
In Figs.3–7, the retrieved column amounts of O3, HCl, N2O and CH4are shown as a function of the optical path difference. The figures show the mean column amounts with the 2σ standard deviation of the ensemble for two sets of retrievals: one that
5
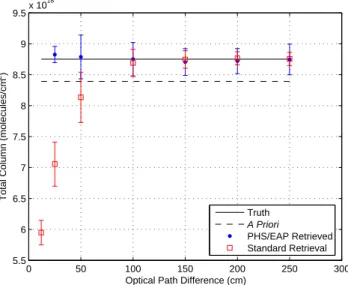
retrieves third-order polynomial coefficients for the PHS and EAP functions (“PHS/EAP retrieved”) from the microwindow itself, and one that does not retrieve coefficients (our “standard retrieval”). The a priori column value and the “truth” are plotted for reference. The truth in this case is the column amount used to create the model spectra.
For ozone in the 3040 cm−1 microwindow (Fig. 3), there is less than 0.67% di
ffer-10
ence in column amounts retrieved at 250 cm OPD between the standard and PHS/EAP retrieved cases, with the standard retrieval being essentially indistinguishable from the truth (∼0.07% larger). The PHS/EAP retrieved case changes less than the standard retrieval between the different OPD values, and retrieves columns that are closer to the truth at the lowest OPDs (except for 25 cm). The results are within 1% of the truth for all
15
OPDs for the PHS/EAP retrieved case and differ by more than 1% from the truth for the 50 cm OPD and 12 cm OPD standard retrieval. We would expect, then, good results from the lower resolution instruments using this microwindow if they retrieve PHS and EAP parameters.
Ozone retrieved from the 2775 cm−1microwindow is shown in Fig.4. At 250 cm OPD,
20
the columns differ by less than 0.06% from the truth, obtained by either the standard retrieval or the PHS/EAP retrieved case. The column average for the standard retrieval begins to decrease significantly below 100 cm OPD with the column mean over the ensemble differing by <7% from the truth at 50 cm OPD. The PHS/EAP retrieved case has less than 1% difference down to 25 cm OPD, whereas the standard retrieval gives a
25
mean that is 19.4% smaller than the true value at 25 cm OPD. The simulated retrievals did not converge for the PHS/EAP retrieval at 12 cm OPD, so are not plotted here. We may expect, then, that we should get good results for ozone for the lower-resolution instruments if they retrieve PHS/EAP parameters.
ACPD
6, 10883–10928, 2006 Simultaneous Observations with Three FTSs D. Wunch et al. Title Page Abstract Introduction Conclusions References Tables Figures J I J I Back CloseFull Screen / Esc
Printer-friendly Version Interactive Discussion
EGU For HCl (Fig.5), the difference in columns retrieved between the standard retrieval
at 250 cm OPD and the truth is 0.27% and between the PHS/EAP retrieved case at 250 cm OPD and the truth is 0.36%. The column amounts are within 1% of the truth until 50 cm OPD for the standard retrieval, and 25 cm OPD for the PHS/EAP retrieved case. At and below 50 cm OPD, the percent difference from the truth increases in both
5
cases, with the PHS/EAP retrieved case showing significantly better agreement than the standard case. We would expect, then, reasonable agreement for HCl for the lower resolution instruments if PHS and EAP parameters are retrieved.
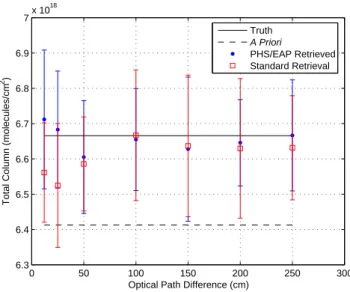
For N2O (Fig. 6), the difference between the columns retrieved with the standard retrieval at 250 cm OPD and the truth is ∼0.5%, and the difference in columns between
10
the PHS/EAP retrieval at 250 cm OPD and the truth is ∼0.02%. The N2O columns show good agreement with the truth (<1%) for all OPDs for the PHS/EAP retrieved case, and good agreement with the truth for all OPDs at or larger than 100 cm for the standard retrieval. Below 100 cm OPD, the standard retrieval stays within ∼2% of the truth, and does not have the drastic decrease that the stratospheric species show. We would
15
expect, then, that all three instruments would have good agreement for N2O if they perform either retrieval, but better results may be obtained from the lower resolution instruments if they retrieve PHS and EAP parameters.
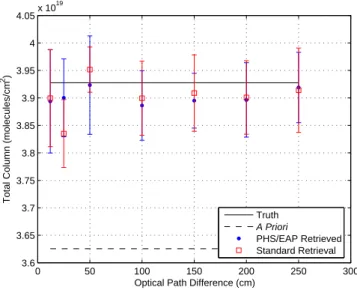
For CH4 (Fig. 7), the difference between columns retrieved using the standard re-trieval at 250 cm OPD and the truth is ∼0.34%, and the difference in columns between
20
the PHS/EAP retrieval at 250 cm OPD and the truth is ∼0.22%. The CH4 columns show good agreement with the truth (<1%) for all OPDs for the PHS/EAP retrieved case, except for 100 cm OPD, where the percent difference from the truth is ∼1.05%. There is good agreement with the truth for all OPDs for the standard retrieval, except for 25 cm OPD where the difference is ∼2.35%. Again, as for N2O, the two retrieval
25
cases stay within ∼2.5% of the truth, and do not show a significant decrease at smaller OPD. We would expect, then, that all three instruments would have good agreement for CH4if they perform either retrieval.
ACPD
6, 10883–10928, 2006 Simultaneous Observations with Three FTSs D. Wunch et al. Title Page Abstract Introduction Conclusions References Tables Figures J I J I Back CloseFull Screen / Esc
Printer-friendly Version Interactive Discussion
3.3 Comparison of columns using PHS/EAP and LINEFIT
It has been noted byGriffith et al.(2003) that stratospheric species (O3and HCl), which have narrow absorption lines, are highly sensitive to ILS distortions, while pressure-broadened tropospheric species (N2O and CH4) are less sensitive to them. We have confirmed this and have investigated column differences obtained when retrieving the
5
EAP and PHS with SFIT2 as compared with columns retrieved when using LINEFIT results as inputs to SFIT2. The first test run retrieved PHS and EAP parameters (“PHS/EAP retrieved”) using the microwindow itself in the U of T FTS case, and the broad N2O microwindow in the PARIS-IR case. The second test run used tabular LIN-EFIT inputs (“ILS input”) obtained from a gas cell measurement. The third test run used
10
only SPHS ILS information (“standard retrieval”). No significant differences in retrieved column amounts between the three ILS cases are seen for the TAO-FTS. Therefore, for our purposes, TAO-FTS data is considered to be closest to the truth.
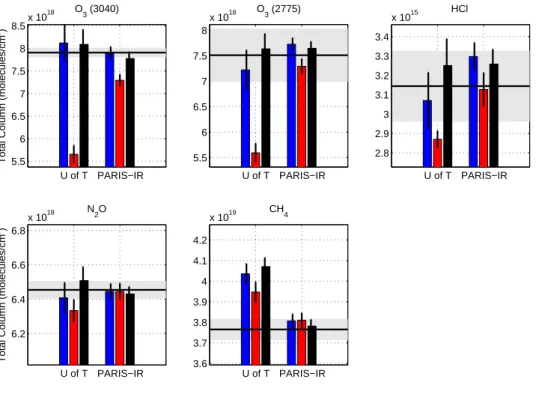
For the U of T FTS, the best ozone column comparisons were from using the ILS input run (Fig. 8). For O3 in the 3040 cm−1 microwindow, the ILS input run is only
15
slightly closer to the TAO-FTS mean values (by ∼0.4%) than the PHS/EAP retrieval and both are more than 20% higher than the values from the standard run. The spectral fits from the PHS/EAP retrieved and ILS input cases also show smaller residuals (see Fig.9). The PARIS-IR results are similar–retrieving PHS/EAP parameters improved the agreement in the column amounts by ∼8% over the standard retrieval (Fig.8) and the
20
spectral fits are better for the PHS/EAP retrieval and the ILS input cases than for the standard retrieval. Similar results are found for ozone in the 2775 cm−1 microwindow (Fig.8).
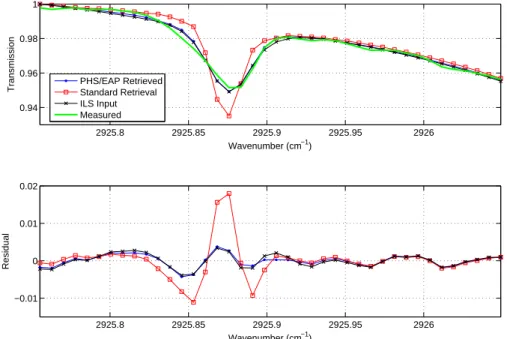
The sensitivity of the U of T FTS HCl retrieval to the ILS is also high, as illustrated in Figs.8and10, with the PHS/EAP retrieved run being closer (by ∼1%) to the TAO-FTS
25
columns than the ILS input run. The difference in HCl columns between the PHS/EAP retrieved and standard retrievals for the PARIS-IR instrument is ∼2%, with the stan-dard retrieval mean slightly closer to the TAO-FTS retrieved values (Fig.8). Residuals
ACPD
6, 10883–10928, 2006 Simultaneous Observations with Three FTSs D. Wunch et al. Title Page Abstract Introduction Conclusions References Tables Figures J I J I Back CloseFull Screen / Esc
Printer-friendly Version Interactive Discussion
EGU from the spectral fits for both the U of T FTS and PARIS-IR show, like in O3, that the
PHS/EAP retrieval and ILS input cases are smaller than for the standard retrieval. The U of T FTS N2O retrieval is much less sensitive to the ILS, as illustrated in Figs.8 and11, although the PHS/EAP retrieved values are closer to the TAO-FTS values than those from the standard retrieval. The sensitivity of the PARIS-IR retrieval to the ILS
5
in the PHS/EAP retrieved case is also quite low. There is only a ∼0.4% difference between the PHS/EAP and standard cases (Fig.8). The residuals from the spectral fits for both the U of T FTS and PARIS-IR instruments show only slightly better results for the PHS/EAP retrieval and ILS input cases than for the standard retrieval.
The sensitivity of the U of T FTS CH4retrievals to the ILS is also lower than that found
10
for O3and HCl, as illustrated in Figs.8and12. (The other two spectral microwindows for CH4 have similar residuals and are not shown.) Retrieving the PHS and EAP pa-rameters for the U of T FTS data produces poorer comparisons with the TAO-FTS data, because it induces spurious oscillations in the profile. There is systematic structure in the residuals from the CH4spectral fits for all three retrieval cases for both PARIS-IR
15
and the U of T FTS. The TAO-FTS residuals also show systematic structure, pointing to a possible problem with the methane spectroscopy. The sensitivity of the PARIS-IR re-trieval of CH4to the ILS is very low, with only ∼0.6% difference between the PHS/EAP retrieved and standard retrievals (Fig.8).
The U of T FTS ILS is much poorer than that of PARIS-IR (compare the central and
20
right panels in Fig.1). Accordingly, the difference in total columns retrieved by the U of T FTS for the PHS/EAP retrieved case and the standard retrieval will be exaggerated for the stratospheric species, which are most sensitive to ILS distortions. Nevertheless, using either the PHS/EAP retrieved or the ILS input cases for both lower-resolution instruments results in reasonable agreement with the TAO-FTS.
25
Using the results from this section, for what follows, we use the PHS/EAP retrieved case to compute columns of O3, HCl and N2O for the U of T FTS. The standard retrieval is used for CH4. For PARIS-IR, the PHS/EAP retrieved case is used for O3 and HCl, and the standard retrieval is used for N2O and CH4. Since the TAO-FTS line shape is
ACPD
6, 10883–10928, 2006 Simultaneous Observations with Three FTSs D. Wunch et al. Title Page Abstract Introduction Conclusions References Tables Figures J I J I Back CloseFull Screen / Esc
Printer-friendly Version Interactive Discussion
significantly narrower than both the stratospheric and tropospheric absorption lines, it is much less sensitive to instrument line shape distortions, and the standard retrieval is always used. Retrieving the PHS and EAP parameters for the TAO-FTS makes only small changes (<1%) in total columns retrieved. Table3summarizes the retrieval parameters for these results.
5
3.4 Number of grid levels
The PARIS-IR analysis retrieves profiles on a 29-layer vertical grid, whereas the TAO-FTS and U of T TAO-FTS retrieve profiles on a 38-layer grid. The 29-layer vertical grid was chosen for the PARIS-IR retrievals to reduce the size of the state vector, in order to compensate for the lower resolution of the measurements. To ensure that the number
10
of grid levels does not significantly affect the results in this intercomparison, we com-pared column amounts retrieved for a single day of measurements from the PARIS-IR instrument both on a 29-layer grid and a 38-layer grid.
For N2O and CH4, there was no noticeable difference (<0.1%) in column amounts retrieved from the PARIS-IR data between retrieving on a 29-layer grid and a 38-layer
15
grid. For ozone in the 3040 cm−1microwindow, the 38-layer results were ∼0.2% lower than the 29-layer results. For ozone in the 2775 cm−1microwindow, the 38-layer results were ∼0.6% higher than the 29-layer results. For HCl, the 38-layer results were ∼0.4% higher than the 29-layer results. The number of grid levels, therefore, is not a significant influence on the results in this comparison.
20
4 Results
These measurements took place during a nine-day period in late August and early September, 2005. Because of the relatively stable chemistry and dynamics of the at-mosphere during that time, we do not expect any significant trends in column amounts of any of these molecules. Total column amounts are, consequently, plotted as a
ACPD
6, 10883–10928, 2006 Simultaneous Observations with Three FTSs D. Wunch et al. Title Page Abstract Introduction Conclusions References Tables Figures J I J I Back CloseFull Screen / Esc
Printer-friendly Version Interactive Discussion
EGU tion of solar zenith angle (SZA) in Figs. 13–17. The total column errors in the
fig-ures consist of the interference error (Rodgers and Connor,2003), retrieval noise, and smoothing error (Rodgers,2000) added in quadrature. There is a clear discrepancy (most pronounced for CH4) between the column amounts at angles larger than and smaller than 40 degrees SZA. We believe that this may be due to suntracker error near
5
solar noon, and so we do not include the data taken at angles less than 40 degrees in our means. The total column means, as given in Table4, show that the lower-resolution instruments are capable of providing column amounts of all species to within ∼3% of the TAO-FTS. The agreement is worse than that found in theMeier et al.(2005) paper (also listed in the table) with two, similarly high-resolution instruments, and so our
re-10
sults may give an upper bound on the ability to measure total column amounts of these species by lower-resolution instruments.
Methane shows larger errors than might be expected from a tropospheric species re-trieval, with significantly different retrieved columns obtained from the three FTSs. This is possibly caused by the more poorly understood spectroscopy of methane,
specifi-15
cally the lack of accurate air-broadening coefficients and temperature dependencies, which has been noted byRothman et al.(2005),Brown et al.(2003) andWorden et al. (2004).
A possibility for the differences in the stratospheric total column amounts is due to the instruments’ column averaging kernels. In what follows, boldface capital variable
20
names represent matrices, boldface lowercase italic variable names represent vectors and lightface italic variable names represent scalars. The OEM retrieved profile, ˆx, is a
weighted average of the a priori profile, xa, and the “truth,” x, weighted by the averaging kernel,A= ∂ ˆx/∂x (Rodgers,2000):
ˆ
x= Ax + (I − A)xa. (1)
25
The retrieved total column, ˆc, is found by multiplying the retrieved profile by the
ACPD
6, 10883–10928, 2006 Simultaneous Observations with Three FTSs D. Wunch et al. Title Page Abstract Introduction Conclusions References Tables Figures J I J I Back CloseFull Screen / Esc
Printer-friendly Version Interactive Discussion
aρ,
aρ= ρA. (2)
Typically, the aρ is normalized by the density (i.e. aρ
iρ −1
i ) when plotted. However,
we prefer the density-weighted version, since it more accurately illustrates at what altitude the retrieved column amount is sensitive. In Fig. 18, the density-weighted
5
column averaging kernels, aρ, are shown for each instrument (the normalized column averaging kernels are shown in Fig.19for reference). There are significant differences between them, with the PARIS-IR results showing the lowest sensitivity.
To test the sensitivity of the U of T FTS and PARIS-IR retrievals to the stratosphere, the averaging kernels were applied to a profile that was 20% larger than the a priori
10
profile at each level and the column was computed using the air mass, ρ. That is, the profile and column estimates are
ˆ
x= A(1.2xa)+ (I − A)xa= (0.2A + I)xa, (3)
ˆ
c= ρ(0.2A + I)xa= (0.2aρ+ ρ)xa. (4)
In this case, shown in Fig. 20, there are significant column differences between the
15
TAO-FTS results and the U of T FTS and PARIS-IR results. The red lines indicate the a priori column and the green lines indicate the a priori column increased by 20% (the “truth”, here). Results with the a priori increased by a larger amount show larger differences between the retrieved columns and the truth.
For O3 in the 3040 cm−1 microwindow, the percent differences from the TAO-FTS
20
are: −0.9% for the U of T FTS and −1.8% for PARIS-IR; for ozone in the 2775 cm−1 microwindow: −0.2% for the U of T FTS and −6.7% for PARIS-IR; for HCl: −1.4% for the U of T FTS and −8.4% for PARIS-IR; for N2O: −0.01% for the U of T FTS and −0.5% for PARIS-IR; and for CH4: −0.2% for the U of T FTS and −0.6% for PARIS-IR. The stratospheric species clearly show larger differences as we have also seen in
Ta-25
ble4. The differences in the stratospheric species, therefore, can be partially attributed to the lower sensitivity of the lower-resolution instruments to the stratosphere and the
ACPD
6, 10883–10928, 2006 Simultaneous Observations with Three FTSs D. Wunch et al. Title Page Abstract Introduction Conclusions References Tables Figures J I J I Back CloseFull Screen / Esc
Printer-friendly Version Interactive Discussion
EGU consequent increased reliance on the a priori in that region. It is therefore particularly
important to choose appropriate microwindows and perform sufficient characterization of the lower-resolution instruments, to optimize the sensitivity.
5 Conclusions
Total column amounts of O3, HCl, N2O and CH4 were retrieved from PARIS-IR, the
5
U of T FTS and the TAO-FTS. Measurements were averaged during coincident 20-min periods and the total column amounts retrieved from these averaged spectra were compared directly. The results, given in Figs.13–17and summarized in Table4, show that the lower-resolution instruments can measure total columns of O3, CH4, HCl and N2O to within ∼3%, on average, of the truth (taken here as the results from the
high-10
resolution TAO-FTS) from the ground. The largest errors are obtained for the strato-spheric species, and these errors can be attributed to the averaging kernels of the lower-resolution instruments (Figs.18–20). The errors from the methane retrievals are possibly due to uncertainties in the spectroscopy.
Retrieving ILS PHS and EAP parameters from SFIT2 significantly improves the
col-15
umn comparisons of the stratospheric species for the lower-resolution instruments (Fig.8). The ILS information is less important for the pressure-broadened tropospheric species. Also, retrieving the SFIT2 PHS and EAP parameters as part of the state vec-tor can replace the LINEFIT ILS information for balloon-based measurements when retrieving the ILS from a gas cell is not feasible.
20
Acknowledgements. The authors wish to thank P. Fogal, K. Sung, N. Jones and F. Hase for
helpful discussions, and F. Hase also for providing the LINEFIT code. We wish to thank M. Jensen, A. Wiacek, T. Kerzenmacher, O. Mikhailov, and K. MacQuarrie for their techni-cal support and help with measurements. Funding for this work was provided by NSERC, CSA, CFCAS and ABB Bomem. TAO has been established with support from CFI, ORDCF,
25
CRESTech, and the University of Toronto. Support at the University of Waterloo was pro-vided by the NSERC-Bomem-CSA-MSC Industrial Research Chair in Fourier Transform
Spec-ACPD
6, 10883–10928, 2006 Simultaneous Observations with Three FTSs D. Wunch et al. Title Page Abstract Introduction Conclusions References Tables Figures J I J I Back CloseFull Screen / Esc
Printer-friendly Version Interactive Discussion troscopy.
References
Bernath, P. F., McElroy, C. T., Abrams, M. C., Boone, C. D., Butler, M., Camy-Peyret, C., Carleer, M., Clerbaux, C., Coheur, P. F., Colin, R., DeCola, P., DeMazi ˆere, M., Drummond, J. R., Dufour, D., Evans, W. F. J., Fast, H., Fussen, D., Gilbert, K., Jennings, D. E., Llewellyn,
5
E. J., Lowe, R. P., Mahieu, E., McConnel, J. C., McHugh, M., McLeod, S. D., Michaud, R., Midwinter, C., Nassar, R., Nichitiu, F., Nowlan, C., Rinsland, C. P., Rochon, Y. J., Rowlands, N., Semeniuk, K., Simon, P., Skelton, R., Sloan, J. J., Soucy, M. A., Strong, K., Tremblay, P., Turnbull, D., Walker, K. A., Walkty, I., Wardle, D. A., Wehrle, V., Zander, R., and Zou, J.: Atmospheric Chemistry Experiment (ACE): Mission Overview, Geophys. Res. Lett., 32,
10
L15S01, doi:10.1029/2005GL022386, 2005. 10888
Brown, L., Benner, D. C., Champion, J., Devi, V., Fejard, L., Gamache, R., Gabard, T., Hilico, J., Lavorel, B., Loete, M., Mellau, G., Nikitin, A., Pine, A., Predoi-Cross, A., Rinsland, C., Robert, O., Sams, R., Smith, M., Tashkun, S., and Tyuterevk, V.: Methane line parameters in HITRAN, J. Quant. Spectrosc. Radiat. Transfer, 82, 219–238, 2003. 10898
15
Carli, B., Alpaslan, D., Carlotti, M., Castelli, E., Ceccherini, S., Dinelli, B. M., Dudhia, A., Flaud, J. M., Hoepfner, M., Jay, V., Magnani, L., Oelhaf, H., Payne, V., Piccolo, C., Prosperi, M., Raspollini, P., Remedios, J., Ridolfi, M., and Spang, R.: First results of MIPAS/ENVISAT with operational Level 2 code, Adv. Space Res., 33, 1012–1019, 2004. 10889
Coffey, M. T., Goldman, A., Hannigan, J. W., Mankin, W. G., Schoenfeld, W. G., Rinsland, C. P.,
20
Bernardo, C., and Griffith, D. W. T.: Improved Vibration-Rotation (0-1) HBr Line Parame-ters for Validating High Resolution Infrared Atmospheric Spectra Measurements, J. Quant. Spectrosc. Radiat. Transfer, 60, 863–867, 1998. 10891
Dils, B., de Mazi `ere, M., M ¨uller, J. F., Blumenstock, T., Buchwitz, M., de Beek, R., Demoulin, P., Duchatelet, P., Fast, H., Frankenberg, C., Gloudemans, A., Griffith, D., Jones, N.,
Kerzen-25
macher, T., Kramer, I., Mahieu, E., Mellqvist, J., Mittermeier, R. L., Notholt, J., Rinsland, C. P., Schrijver, H., Smale, D., Strandberg, A., Straume, A. G., Stremme, W., Strong, K., Sussmann, R., Taylor, J., van den Broek, M., Velazco, V., Wagner, T., Warneke, T., Wiacek, A., and Wood, S.: Comparisons between SCIAMACHY and ground-based FTIR data for total columns of CO, CH4, CO2and N2O, Atmos. Chem. Phys., 6, 1953–1976, 2006. 10886
ACPD
6, 10883–10928, 2006 Simultaneous Observations with Three FTSs D. Wunch et al. Title Page Abstract Introduction Conclusions References Tables Figures J I J I Back CloseFull Screen / Esc
Printer-friendly Version Interactive Discussion
EGU
Fu, D., Walker, K. A., Sung, K., Boone, C. D., Soucy, M. A., and Bernath, P. F.: The portable at-mospheric research interferometric spectrometer for the infrared, PARIS-IR, J. Quant. Spec-trosc. Radiat. Transfer, 2006. 10888
Gallery, W. O., Kneizys, F. X., and Clough, S. A.: Air mass computer program for atmospheric transmittance/radiance calculation: FSCATM, AFGL-TR-0208 Environmental Research
pa-5
pers, 1983. 10889
Goldman, A., Paton-Walsh, C., Bell, W., Toon, G. C., Blavier, J.-F., Sen, B., Coffey, M. T., Hannigan, J. W., and Mankin, W. G.: Network for the Detection of Stratospheric Change Fourier transform infrared intercomparison at Table Mountain Facility, November 1996, J. Geophys. Res., 104, 30 481–30 503, 1999. 10884,10885,10890,10908
10
Griffith, D. W. T., Jones, N. B., McNamara, B., Paton-Walsh, C., Bell, W., and Bernardo, C.: Intercomparison of NDSC ground-based solar FTIR measurements of atmospheric gases at Lauder, New Zealand, J. Atmos. Ocean. Technol., 20, 1138–1153, 2003. 10884, 10885,
10890,10895,10908
Hase, F., Blumenstock, T., and Paton-Walsh, C.: Analysis of the instrumental line shape of
high-15
resolution Fourier transform IR spectrometers with gas cell measurements and new retrieval software, Appl. Opt., 38, 3417–3422, 1999. 10891,10909
Hase, F., Hannigan, J., Coffey, M., Goldman, A., H¨opfner, M., Jones, N., Rinsland, C., and Wood, S.: Intercomparison of retrieval codes used for the analysis of high-resolution, ground-based FTIR measurements, J. Quant. Spectrosc. Radiat. Transfer, 87, 25–52, 2004. 10884
20
Kerzenmacher, T. E., Walker, K. A., Strong, K., Berman, R., Bernath, P. F., Boone, C. D., Drum-mond, J. R., Fast, H., Fraser, A., MacQuarrie, K., Midwinter, C., Sung, K., McElroy, C. T., Mittermeier, R. L., Walker, J., and Wu, H.: Measurements of O3, NO2 and Temperature dur-ing the 2004 Canadian Arctic ACE Validation Campaign, Geophys. Res. Lett., 32, L16S07,
doi:10.1029/2005GL023032, 2005. 10888
25
Kurylo, M. J. and Zander, R. J.: The NDSC – Its status after ten years of operation, in: Pro-ceedings of XIX Quadrennial Ozone Symposium, Hokkaido University, Sapporo, Japan, pp.
167–168, 2000. 10885
Mahieu, E., Zander, R., Duchatelet, P., Hannigan, J. W., Coffey, M. T., Mikuteit, S., Hase, F., Blumenstock, T., Wiacek, A., Strong, K., Taylor, J. R., Mittermeier, R., Fast, H., Boone, C. D.,
30
McLeod, S. D., Walker, K. A., Bernath, P. F., and Rinsland, C. P.: Comparisons between ACE-FTS and ground-based measurements of stratospheric HCl and ClONO2 loadings at north-ern latitudes, Geophys. Res. Lett., 32, L15S08, doi:10.1029/2005GL022396, 2005. 10886
ACPD
6, 10883–10928, 2006 Simultaneous Observations with Three FTSs D. Wunch et al. Title Page Abstract Introduction Conclusions References Tables Figures J I J I Back CloseFull Screen / Esc
Printer-friendly Version Interactive Discussion Meier, A., Goldman, A., Manning, P. S., Stephen, T. M., Rinsland, C. P., Jones, N. B., and Wood,
S. W.: Improvements to air mass calculations for ground-based infrared measurements, J. Quant. Spectrosc. Radiat. Transfer, 83, 109–113, 2004. 10889
Meier, A., Paton-Walsh, C., Bell, W., Blumenstock, T., Hase, F., Goldman, A., Steen, A., Kift, R., Woods, P., and Kondo, Y.: Evidence of reduced measurement uncertainties from an FTIR
5
instrument intercomparison at Kiruna, Sweden, J. Quant. Spectrosc. Radiat. Transfer, 96, 75–84, 2005. 10884,10885,10898,10908
Paton-Walsh, C., Bell, W., Gardiner, T., Swann, N., Woods, P., Notholt, J., Sch ¨utt, H., Galle, B., Arlander, W., and Mellqvist, J.: An uncertainty budget for ground-based Fourier transform infrared column measurements of HCl, HF, N2O and HNO3deduced from results of
side-by-10
side instrument intercomparisons, J. Geophys. Res., 102, 8867–8873, 1997. 10884,10885,
10908
Pougatchev, N. S., Connor, B. J., and Rinsland, C. P.: Infrared measurements of the ozone vertical distribution above Kitt Peak, J. Geophys. Res., 100, 16 689–16 698, doi:10.1029/
95JD01296, 1995. 10889
15
Rinsland, C. P., Smith, M. A. H., Rinsland, P. L., Goldman, A., Brault, J. W., and Stokes, G.: Ground-based infrared spectroscopic measurements of atmospheric hydrogen cyanide, J. Geophys. Res., 87, 11 119–11 125, 1982. 10889
Rinsland, C. P., Jones, N. B., Connor, B. J., Logan, J. A., Pougatchev, N. S., Goldman, A., Murcray, F. J., Stephen, T. M., Pine, A. S., Zander, R., Mahieu, E., and Demoulin,
20
P.: Northern and southern hemisphere ground-based infrared spectroscopic measure-ments of tropospheric carbon monoxide and ethane, J. Geophys. Res., 103, 197–218, doi: 10.1029/98JD02515, 1998. 10888
Rodgers, C. D.: Inverse Methods for Atmospheric Sounding: Theory and Practice, vol. 2 of Series on Atmospheric, Oceanic and Planetary Physics, World Scientific Co. Pte. Ltd., 2000.
25
10889,10898
Rodgers, C. D. and Connor, B. J.: Intercomparison of remote sounding instruments, J. Geo-phys. Res., 108, 4116, doi:10.1029/2002JD002299, 2003. 10898
Rothman, L., Jacquemart, D., Barbe, A., Benner, D. C., Birk, M., Brown, L., Carleer, M., Jr., C. C., Chance, K., Coudert, L., Dana, V., Devi, V., Flaud, J.-M., Gamache, R., Goldman,
30
A., Hartmann, J.-M., Jucks, K., Maki, A., Mandin, J.-Y., Massie, S., Orphal, J., Perrin, A., Rinsland, C., Smith, M., Tennyson, J., Tolchenov, R., Toth, R., Auwera, J. V., Varanasi, P., and Wagner, G.: The HITRAN 2004 molecular spectroscopic database, J. Quant. Spectrosc.
ACPD
6, 10883–10928, 2006 Simultaneous Observations with Three FTSs D. Wunch et al. Title Page Abstract Introduction Conclusions References Tables Figures J I J I Back CloseFull Screen / Esc
Printer-friendly Version Interactive Discussion
EGU
Radiat. Transfer, 96, 139–204, 2005. 10889,10898
Russell, J. M., Gordley, L. L., Deaver, L., Thompson, R., and Park, J. H.: An overview of the Halogen Occultation Experiment (HALOE) and preliminary results, Adv. Space Res., 14, 9–13, 1994. 10889
Schoeberl, M., Newman, P., Nagatani, R. N., and Lait, L.: Goddard Automailer – NASA
God-5
dard Space Flight Center Code 916, [email protected]. 10889
Strong, K., Bailak, G., Barton, D., Bassford, M., Blatherwick, R., Brown, S., Chartrand, D., Davies, J., Drummond, J., Fogal, P., Forsberg, E., Hall, R., Jofre, A., Kaminski, J., Kosters, J., Laurin, C., Mcconnell, J., Mcelroy, C., Menzies, K., Midwinter, C., Murcray, F., Olson, R., Quine, B., Rochon, Y., Savastiouk, V., Solheim, B., Sommerfeldt, D., Ullberg, A., Werchohlad,
10
S., and Wunch, D.: MANTRA – A balloon mission to study the odd-nitrogen budget of the stratosphere, Atmos. Ocean, 43, 283–299, 2005. 10885
Wiacek, A.: First Trace Gas Measurements Using Fourier Transform Infrared Solar Absorption Spectroscopy at the University of Toronto Atmospheric Observatory, Ph.D. thesis, University of Toronto, 2006. 10889
15
Wiacek, A., Strong, K., Jones, N. B., Taylor, J. R., Mittermeier, R. L., and Fast, H.: First de-tection of meso-thermospheric Nitric Oxide (NO) by ground-based FTIR solar absorption spectroscopy, Geophys. Res. Lett., 33, doi:10.1029/2005GL024897, 2006. 10886
Wiacek, A., Taylor, J. R., Strong, K., Saari, R., Kerzenmacher, T. E., Jones, N. B., and Griffith, D. W. T.: Ground-based solar absorption FTIR spectroscopy: a novel optical design instrument
20
at a new NDSC Complementary Station, characterization of retrievals and first results, J. Atmos. Ocean. Technol., in press, 2006. 10886,10889
Worden, J., Kulawik, S. S., Shephard, M. W., Clough, S. A., Worden, H., Bowman, K., and Goldman, A.: Predicted errors of tropospheric emission spectrometer nadir retrievals from spectral window selection, J. Geophys. Res., 109, 9308, doi:10.1029/2004JD004522, 2004.
25
10898
Wunch, D., Midwinter, C., Drummond, J. R., McElroy, C. T., and Bag `es, A.-F.: The University of Toronto’s Balloon-Borne Fourier Transform Spectrometer, Rev. Sci. Inst., 77, 093104-1– 093104-7, 2006. 10887
ACPD
6, 10883–10928, 2006 Simultaneous Observations with Three FTSs D. Wunch et al. Title Page Abstract Introduction Conclusions References Tables Figures J I J I Back CloseFull Screen / Esc
Printer-friendly Version Interactive Discussion
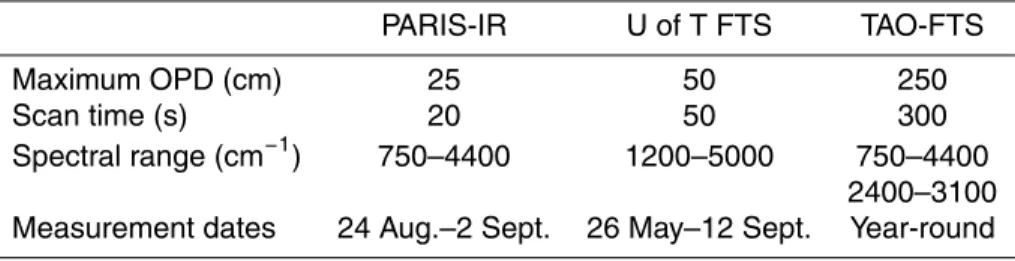
Table 1. Instrument configuration. The second line of the spectral range for the TAO-FTS
indicates its spectral range using NDACC filter 3, which is the spectral range used in this inter-comparison. The scan time is the time it takes to record a single interferogram.
PARIS-IR U of T FTS TAO-FTS
Maximum OPD (cm) 25 50 250
Scan time (s) 20 50 300
Spectral range (cm−1) 750–4400 1200–5000 750–4400
2400–3100
ACPD
6, 10883–10928, 2006 Simultaneous Observations with Three FTSs D. Wunch et al. Title Page Abstract Introduction Conclusions References Tables Figures J I J I Back CloseFull Screen / Esc
Printer-friendly Version Interactive Discussion
EGU
Table 2. Microwindows for O3, HCl, N2O and CH4used in this intercomparison. The 2775 O3 and CH4 microwindows each consist of three separate bandpasses retrieved simultaneously. The names of the individual bandpasses are in brackets.
Target Microwindow Spectral Range Interfering Species
Gas (cm−1) O3 3040 3039.90–3040.60 H2O, CH4 (2775) 2775.68–2776.30 CH4, CO2, HCl, N2O O3 2775 (2778) 2778.85–2779.20 CH4, HDO, N2O (2782) 2781.57–2782.06 CH4, HDO, N2O, CO2 HCl 2925 2925.75–2926.05 H2O, CH4, N2O, O3 N2O 2482 2481.30–2482.60 CO2, CH4, O3 (2859) 2859.83–2860.21 – CH4 2859 (2898) 2898.32–2898.98 – (2904) 2903.60–2904.16 H2O, HCl, O3
ACPD
6, 10883–10928, 2006 Simultaneous Observations with Three FTSs D. Wunch et al. Title Page Abstract Introduction Conclusions References Tables Figures J I J I Back CloseFull Screen / Esc
Printer-friendly Version Interactive Discussion
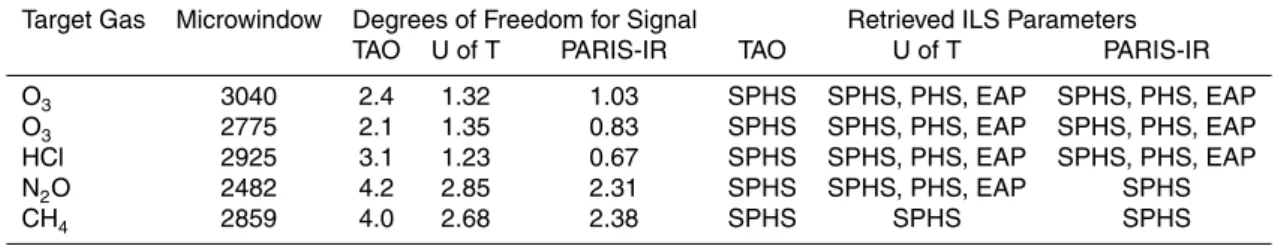
Table 3. Microwindow degrees of freedom for signal and fitting parameters for O3, HCl, N2O and CH4. The mean degrees of freedom for signal were obtained from retrievals performed us-ing the retrieval parameters listed in the last three columns. SPHS is the simple phase param-eter. PHS and EAP are the third order phase and effective apodization polynomial coefficients. For the U of T FTS, they are retrieved directly from the microwindow itself. For PARIS-IR, they are retrieved from a nearby broad-band N2O microwindow.
Target Gas Microwindow Degrees of Freedom for Signal Retrieved ILS Parameters
TAO U of T PARIS-IR TAO U of T PARIS-IR
O3 3040 2.4 1.32 1.03 SPHS SPHS, PHS, EAP SPHS, PHS, EAP
O3 2775 2.1 1.35 0.83 SPHS SPHS, PHS, EAP SPHS, PHS, EAP
HCl 2925 3.1 1.23 0.67 SPHS SPHS, PHS, EAP SPHS, PHS, EAP
N2O 2482 4.2 2.85 2.31 SPHS SPHS, PHS, EAP SPHS
ACPD
6, 10883–10928, 2006 Simultaneous Observations with Three FTSs D. Wunch et al. Title Page Abstract Introduction Conclusions References Tables Figures J I J I Back CloseFull Screen / Esc
Printer-friendly Version Interactive Discussion
EGU
Table 4. Percent differences of mean total column values from Figs.13–17and results from previous intercomparisons. Bold PARIS-IR and U of T FTS differences indicate that they are significant to 95% by the Student’s t-test (i.e. t≥1.96). The PARIS-IR and U of T FTS percent differences are from the TAO-FTS, for SZA >40 degrees. For the previous intercomparisons, brackets beneath the percent differences for each molecule indicate the microwindow retrieved, if it is different from Table2. Here, for theMeier et al.(2005),Griffith et al.(2003), and Paton-Walsh et al.(1997) papers, we cite mean percent differences between the two instruments over
the duration of the intercomparison, whereas forGoldman et al.(1999), we cite the maximum difference from the average of the three instruments involved for the November 11B data set.
O3 HCl N2O CH4
3040 2775 2925 2482 2859
PARIS-IR percent difference from TAO 0.8 2.6 3.2 0.4 0.5
U of T FTS percent difference from TAO 3.3 0.7 1.7 0.4 2.3
U of T FTS percent difference from PARIS-IR 2.5 3.2 1.5 0.8 1.7
Meier et al.(2005) 0.4 0.7 0.1 0.2
(3040) (2904)
Griffith et al.(2003) 2.57 2.90 0.34 1.11
(3045.08-3045.38) (2904)
Goldman et al.(1999) 1.5 1.6 1.1 0.2
(3045.08–3045.38) (2904)
ACPD
6, 10883–10928, 2006 Simultaneous Observations with Three FTSs D. Wunch et al. Title Page Abstract Introduction Conclusions References Tables Figures J I J I Back CloseFull Screen / Esc
Printer-friendly Version Interactive Discussion 0 50 100 150 200 250 0 0.2 0.4 0.6 0.8 1
Optical Path Difference (cm)
Modulation Efficiency TAO−FTS 0 50 100 150 200 250 0.01 0.015 0.02 0.025 0.03
Optical Path Difference (cm)
Phase Error (radians)
0 10 20 30 40 50 0 0.2 0.4 0.6 0.8 1
Optical Path Difference (cm) U of T FTS 0 10 20 30 40 50 0.06 0.08 0.1 0.12 0.14 0.16 0.18 0.2
Optical Path Difference (cm)
0 5 10 15 20 25 0 0.2 0.4 0.6 0.8 1
Optical Path Difference (cm) PARIS−IR 0 5 10 15 20 25 0.052 0.053 0.054 0.055 0.056 0.057 0.058 0.059
Optical Path Difference (cm)
Fig. 1. Typical modulation efficiency and phase error for all three instruments. These are
computed from gas cell measurements using the LINEFIT software (Hase et al., 1999). The top panels contain the modulation efficiency and the lower panels contain the phase error. The left-most panels show unapodized TAO-FTS data, recorded in August, 2005. The central panels show U of T FTS data, apodized with a triangular filter and recorded in September,
ACPD
6, 10883–10928, 2006 Simultaneous Observations with Three FTSs D. Wunch et al. Title Page Abstract Introduction Conclusions References Tables Figures J I J I Back CloseFull Screen / Esc
Printer-friendly Version Interactive Discussion
EGU
ACPD
6, 10883–10928, 2006 Simultaneous Observations with Three FTSs D. Wunch et al. Title Page Abstract Introduction Conclusions References Tables Figures J I J I Back CloseFull Screen / Esc
Printer-friendly Version Interactive Discussion 0 50 100 150 200 250 300 5.5 6 6.5 7 7.5 8 8.5 9 9.5x 10 18
Optical Path Difference (cm)
Total Column (molecules/cm
2)
Truth
A Priori
PHS/EAP Retrieved Standard Retrieval
Fig. 3. Simulated retrievals of ozone columns in the 3040 cm−1 microwindow, assuming SNR=250, as a function of OPD.
ACPD
6, 10883–10928, 2006 Simultaneous Observations with Three FTSs D. Wunch et al. Title Page Abstract Introduction Conclusions References Tables Figures J I J I Back CloseFull Screen / Esc
Printer-friendly Version Interactive Discussion EGU 0 50 100 150 200 250 300 5.5 6 6.5 7 7.5 8 8.5 9 9.5x 10 18
Optical Path Difference (cm)
Total Column (molecules/cm
2)
Truth
A Priori
PHS/EAP Retrieved Standard Retrieval
Fig. 4. Simulated retrievals of ozone columns in the 2775 cm−1 microwindow, assuming SNR=250, as a function of OPD. The small error bars on the PHS/EAP retrieval for 25 cm OPD are due to the small number of retrievals that converged for this OPD. The error bars are, as a consequence, artificially small.
ACPD
6, 10883–10928, 2006 Simultaneous Observations with Three FTSs D. Wunch et al. Title Page Abstract Introduction Conclusions References Tables Figures J I J I Back CloseFull Screen / Esc
Printer-friendly Version Interactive Discussion 0 50 100 150 200 250 300 2.4 2.6 2.8 3 3.2 3.4 3.6 3.8x 10 15
Optical Path Difference (cm)
Total Column (molecules/cm
2)
Truth
A Priori
PHS/EAP Retrieved Standard Retrieval
ACPD
6, 10883–10928, 2006 Simultaneous Observations with Three FTSs D. Wunch et al. Title Page Abstract Introduction Conclusions References Tables Figures J I J I Back CloseFull Screen / Esc
Printer-friendly Version Interactive Discussion EGU 0 50 100 150 200 250 300 6.3 6.4 6.5 6.6 6.7 6.8 6.9 7x 10 18
Optical Path Difference (cm)
Total Column (molecules/cm
2)
Truth
A Priori
PHS/EAP Retrieved Standard Retrieval
ACPD
6, 10883–10928, 2006 Simultaneous Observations with Three FTSs D. Wunch et al. Title Page Abstract Introduction Conclusions References Tables Figures J I J I Back CloseFull Screen / Esc
Printer-friendly Version Interactive Discussion 0 50 100 150 200 250 300 3.6 3.65 3.7 3.75 3.8 3.85 3.9 3.95 4 4.05x 10 19
Optical Path Difference (cm)
Total Column (molecules/cm
2)
Truth
A Priori
PHS/EAP Retrieved Standard Retrieval
ACPD
6, 10883–10928, 2006 Simultaneous Observations with Three FTSs D. Wunch et al. Title Page Abstract Introduction Conclusions References Tables Figures J I J I Back CloseFull Screen / Esc
Printer-friendly Version Interactive Discussion EGU U of T PARIS−IR 5.5 6 6.5 7 7.5 8 8.5x 10 18
Total Column (molecules/cm
2) O 3 (3040) U of T PARIS−IR 5.5 6 6.5 7 7.5 8 x 10¹⁸ O3 (2775) U of T PARIS−IR 2.8 2.9 3 3.1 3.2 3.3 3.4 x 10¹⁵ HCl U of T PARIS−IR 6.2 6.4 6.6 6.8 x 10¹⁸
Total Column (molecules/cm
2) N 2O U of T PARIS−IR 3.6 3.7 3.8 3.9 4 4.1 4.2 x 10¹⁹ CH4
Fig. 8. Mean column differences from data recorded on 2 September, using the PHS/EAP
retrieval (blue), the standard retrieval (red) and the ILS input retrieval (black). The thick black horizontal line indicates the TAO-FTS mean and the grey shading is the standard deviation of the TAO-FTS retrieved values. The error bars on the bars indicate the standard deviation of the retrieved values.
ACPD
6, 10883–10928, 2006 Simultaneous Observations with Three FTSs D. Wunch et al. Title Page Abstract Introduction Conclusions References Tables Figures J I J I Back CloseFull Screen / Esc
Printer-friendly Version Interactive Discussion 3040 3040.1 3040.2 3040.3 3040.4 3040.5 −0.01 −0.005 0 0.005 0.01 0.015 Wavenumber (cm−1) Residual 3040 3040.1 3040.2 3040.3 3040.4 3040.5 0.92 0.94 0.96 0.98 1 Wavenumber (cm−1)
Transmission Standard RetrievalPHS/EAP Retrieved
ILS Input Measured
Fig. 9. O3(3040) spectral fits for the U of T FTS (upper panel), and the residuals between the measured retrieval and the spectral fits (lower panel).
ACPD
6, 10883–10928, 2006 Simultaneous Observations with Three FTSs D. Wunch et al. Title Page Abstract Introduction Conclusions References Tables Figures J I J I Back CloseFull Screen / Esc
Printer-friendly Version Interactive Discussion EGU 2925.8 2925.85 2925.9 2925.95 2926 −0.01 0 0.01 0.02 Wavenumber (cm−1) Residual 2925.8 2925.85 2925.9 2925.95 2926 0.94 0.96 0.98 1 Wavenumber (cm−1)
Transmission PHS/EAP RetrievedStandard Retrieval
ILS Input Measured
Fig. 10. HCl spectral fits for the U of T FTS (upper panel), and the corresponding residuals
ACPD
6, 10883–10928, 2006 Simultaneous Observations with Three FTSs D. Wunch et al. Title Page Abstract Introduction Conclusions References Tables Figures J I J I Back CloseFull Screen / Esc
Printer-friendly Version Interactive Discussion 2481.4 2481.6 2481.8 2482 2482.2 2482.4 −5 0 5x 10 −3 Wavenumber (cm−1) Residual 2481.4 2481.6 2481.8 2482 2482.2 2482.4 0.75 0.8 0.85 0.9 0.95 1 Wavenumber (cm−1) Transmission PHS/EAP Retrieved Standard Retrieval ILS Input Measured
Fig. 11. N2O spectral fits for the U of T FTS (upper panel), and the corresponding residuals (lower panel).
ACPD
6, 10883–10928, 2006 Simultaneous Observations with Three FTSs D. Wunch et al. Title Page Abstract Introduction Conclusions References Tables Figures J I J I Back CloseFull Screen / Esc
Printer-friendly Version Interactive Discussion EGU 2898.4 2898.5 2898.6 2898.7 2898.8 2898.9 −5 0 5 10 15x 10 −3 Wavenumber (cm−1) Residual 2898.4 2898.5 2898.6 2898.7 2898.8 2898.9 0.7 0.8 0.9 1 Wavenumber (cm−1)
Transmission PHS/EAP RetrievedStandard Retrieval
ILS Input Measured
Fig. 12. CH4 spectral fits for the U of T FTS (upper panel), and the corresponding residuals (lower panel).
ACPD
6, 10883–10928, 2006 Simultaneous Observations with Three FTSs D. Wunch et al. Title Page Abstract Introduction Conclusions References Tables Figures J I J I Back CloseFull Screen / Esc
Printer-friendly Version Interactive Discussion 32 34 36 38 40 42 44 46 48 7.4 7.6 7.8 8 8.2 8.4 8.6 8.8 9 9.2x 10 18
Solar Zenith Angle (degrees)
Total Column (molecules/cm
2)
TAO−FTS PARIS−IR U of T FTS
Fig. 13. O3 column amounts retrieved in the 3040 cm−1 microwindow as a function of solar zenith angle, using the parameters described in Table3. The horizonal lines show the means of the columns over the SZA range indicated. The error bars shown include the smoothing error, interference error and retrieval error added in quadrature.
ACPD
6, 10883–10928, 2006 Simultaneous Observations with Three FTSs D. Wunch et al. Title Page Abstract Introduction Conclusions References Tables Figures J I J I Back CloseFull Screen / Esc
Printer-friendly Version Interactive Discussion EGU 30 35 40 45 50 55 60 65 6.6 6.8 7 7.2 7.4 7.6 7.8 8 8.2 8.4 8.6x 10 18
Solar Zenith Angle (degrees)
Total Column (molecules/cm
2)
TAO−FTS PARIS−IR U of T FTS