HAL Id: hal-00301340
https://hal.archives-ouvertes.fr/hal-00301340
Submitted on 9 Jul 2004HAL is a multi-disciplinary open access
archive for the deposit and dissemination of sci-entific research documents, whether they are pub-lished or not. The documents may come from teaching and research institutions in France or abroad, or from public or private research centers.
L’archive ouverte pluridisciplinaire HAL, est destinée au dépôt et à la diffusion de documents scientifiques de niveau recherche, publiés ou non, émanant des établissements d’enseignement et de recherche français ou étrangers, des laboratoires publics ou privés.
Deployment of a ground-based CIMS apparatus for the
detection of organic gases in the boreal forest during the
QUEST campaign
K. Sellegri, B. Umann, M. Hanke, F. Arnold
To cite this version:
K. Sellegri, B. Umann, M. Hanke, F. Arnold. Deployment of a ground-based CIMS apparatus for the detection of organic gases in the boreal forest during the QUEST campaign. Atmospheric Chemistry and Physics Discussions, European Geosciences Union, 2004, 4 (4), pp.3835-3873. �hal-00301340�
ACPD
4, 3835–3873, 2004
Detection of organic gases in the boreal
forest K. Sellegri et al. Title Page Abstract Introduction Conclusions References Tables Figures J I J I Back Close
Full Screen / Esc
Print Version Interactive Discussion
© EGU 2004
Atmos. Chem. Phys. Discuss., 4, 3835–3873, 2004 www.atmos-chem-phys.org/acpd/4/3835/
SRef-ID: 1680-7375/acpd/2004-4-3835 © European Geosciences Union 2004
Atmospheric Chemistry and Physics Discussions
Deployment of a ground-based CIMS
apparatus for the detection of organic
gases in the boreal forest during the
QUEST campaign
K. Sellegri, B. Umann, M. Hanke, and F. Arnold
Atmospheric Physic Division, Max Planck Institute for Nuclear Physics, Heidelberg, Germany Received: 26 March 2004 – Accepted: 17 June 2004 – Published: 9 July 2004
ACPD
4, 3835–3873, 2004
Detection of organic gases in the boreal
forest K. Sellegri et al. Title Page Abstract Introduction Conclusions References Tables Figures J I J I Back Close
Full Screen / Esc
Print Version Interactive Discussion
© EGU 2004
Abstract
Measurements of atmospheric volatile organic compounds were performed in the Finnish Boreal forest atmosphere during spring 2003, as part of the project QUEST (Quantification of Aerosol Nucleation in the European Boundary Layer), using a ground-based Chemical Ionization Mass Spectrometer (CIMS) instrument. Based on
5
the study of their hydrate distribution, Methanol, Acetonitrile, Acetaldehyde, Dimethyl Amine (DMA), Ethanol/Formic Acid, Acetone, Trimethyl Amine TMA, Propanol/Acetic Acid, Methyl Vinyl Ketone (MVK) and Metacrolein (MaCR), Monoterpenes, Cis-3-hexenyl Acetate and Monoterpene Oxidation Products (MTOP) are proposed as candi-dates for masses 33, 41, 44, 45, 46, 58, 59, 60, 70, 136, 142 and 168 amu, respectively.
10
It would be, to our knowledge, the first time DMA, TMA, MTOP and Cis-3-hexenyl Ac-etate are measured with this method. A compound with mass 68 amu, which could be Isoprene has also been identified. Most compounds show a clear diurnal variation with higher concentrations at night, starting at the onset of the nocturnal inversion and in agreement with independent measurements of CO. Biogenic compounds are highly
15
correlated with each other and the ratio monoterpene/oxidation product shows a typ-ical daily pattern of nighttime maxima. Cis-3-hexenyl Acetate has a diurnal variation similar to the ones of Isoprene and Monoterpenes, and especially close to the diurnal variation of their oxidation products.
1. Introduction
20
Vast quantities of biogenic hydrocarbons are emitted to the atmosphere by vegeta-tion, having an impact both on the atmospheric chemistry at local, regional and global scale, and on atmospheric processes such as new particle formation and growth. The amount of emissions of natural non-methane hydrocarbons (NMHC) are estimated to be higher than those of anthropogenic NMHC (Guenther et al., 1995), and their
oxida-25
ACPD
4, 3835–3873, 2004
Detection of organic gases in the boreal
forest K. Sellegri et al. Title Page Abstract Introduction Conclusions References Tables Figures J I J I Back Close
Full Screen / Esc
Print Version Interactive Discussion
© EGU 2004
et al. (1997) suggested that at night the products from ozonolysis of pinene were of sufficiently low vapor pressures to condense freely on existing particles or possibly homogeneously nucleate, which makes daily variations studies important. Also, high resolution time series of biogenic gases concentrations bring new information for the understanding of how NMHC are oxidized in a natural atmosphere and how their
am-5
bient concentrations are driven by dynamic of the boundary layer.
In this paper, we present the results of measurements of atmospheric volatile organic compounds (VOC) in the Finnish Boreal forest atmosphere during spring 2003, as part of the project QUEST (Quantification of Aerosol Nucleation in the European Boundary Layer), using a ground-based Chemical Ionization Mass Spectrometer (CIMS)
instru-10
ment. Monoterpenes have already been measured at the site by the mean of ad-sorbent cartridges and GC-FID (Hakola et al., 2000) or GC-MS (Spirig et al., 2003). The advantages of the CIMS instrument over cartridge sampling associated to gas chromatographic analysis is the fast time response of a few seconds and the online detection of reactive species that might be modified otherwise. When integrated over
15
several minutes, which still allows the study of relatively fast changing atmospheric concentrations, a low detection limit down to less than 10 ppt for some trace gases can be achieved. CIMS has been previously used for the air-borne measurements of organic gases (Arnold et al., 1997; Wohlfrom et al., 1999; Schr ¨oder et al., 2003). The ground-based adaptation of the CIMS apparatus for the measurement of organic
20
gases provides a set of on-line data over extended periods of time, and enables the study of high time resolution daily variations. The chemical ionization (CI) technique involved in the CIMS instrument uses ion-molecule reactions which cause much less fragmentation than electron impact or photoionization. However, ion identification is still a problem when the ionized molecules are hydrated with several water clusters.
25
The goal of this paper is mainly to address all atmospheric candidates for the gases detected during the Quest campaign with CIMS. Furthermore, daily variation of the measured species are observed, and used as a validation tool for the consistency of the data set. Hence, we report mixing ratios time variation of a large variety of species
ACPD
4, 3835–3873, 2004
Detection of organic gases in the boreal
forest K. Sellegri et al. Title Page Abstract Introduction Conclusions References Tables Figures J I J I Back Close
Full Screen / Esc
Print Version Interactive Discussion
© EGU 2004
(some of them being measured for the first time with this technique) as the result of the first ground-based CIMS operated for measurement of organic gases.
2. Site and instrumental deployment
The SMEAR experimental station (Station for Measuring Forest Ecosystem-Atmosphere Relations) located in Hyyti ¨al ¨a, southern Finland (61◦51 N, 24◦17 E, 181 m
5
above sea level) is representative of the boreal coniferous forest. A complete descrip-tion of the site can be found elsewhere (Kulmala et al., 2001). Data presented in this paper are based on samplings achieved during 2 weeks: from 17 March to 29 March 2001. Gas measurements have been sampled from an adapted measuring container located 50 m south-west of the SMEAR station, at 2.5 m above the ground. The
com-10
parison of water vapor measurements obtained with the CIMS set up with the water vapor measured at the station (4.2 m) show excellent agreement (less than 5% dis-agreement). This indicates that the location of the measurement container is suitable for comparison of the CIMS results with the SMEAR data set. In order to avoid wall ef-fects and sampling of fine particles, the measuring container was equipped with a large
15
diameter-high velocity inlet, in which the sampling line was installed perpendicularly to the inlet flux (Hanke et al., 2003). The inlet protrudes about 1 m above the roof of the container, so that the air should not have encountered any surface before being drawn into the sampling line.
Measurements were performed using a Chemical Ionization Mass Spectrometer
20
(CIMS) instrumental set-up, based on ion-molecule reaction for the detection of trace gases. The instrument, which was designed by the MPIK-Heidelberg, is composed of (a) the high velocity inlet mentioned above (b) a sampling line equipped with a critical orifice and thermostatted at ∼30◦C, (c) an ion source, generating H3O+(H2O)neducts ions (d) a flow tube reactor, also thermostatted at ∼30◦C, in which reactant ions react
25
with the atmospheric gases to be analyzed (e) a quadrupole mass spectrometer for the detection of ionized gas molecules (Fig. 1). A similar experimental set-up has been
ACPD
4, 3835–3873, 2004
Detection of organic gases in the boreal
forest K. Sellegri et al. Title Page Abstract Introduction Conclusions References Tables Figures J I J I Back Close
Full Screen / Esc
Print Version Interactive Discussion
© EGU 2004
used by MPIK-HD for previous atmospheric trace gas measurements and is described in detail elsewhere (Hanke et al., 2003). Briefly, atmospheric air enters the critical orifice, which assures a constant flow rate of about 10 slpm (also measured with two anemometers further in the sampling line) and a pressure of 10 mbars, created by using two oil-free SCROLL vacuum pumps. Reactant ions H3O+ are produced by a
5
high-frequency glow-discharge capillary-tube ion source (CIS) and a 2 slm O2source gas flow: O+2 ions produced from the CIS rapidly react with the more abundant atmo-spheric H2O to give H3O+. Hydration of the H3O+ reactant ions occurs by association with water vapor in the main flow tube, leading to a distribution of H3O+(H2O)n ions, with n from 0 to 6, of which the ions with n=3 are most abundant. Then, atmospheric
10
gases X with proton affinities larger than that of H2O (166.5 kcal mol−1) react in the flow tube reactor with reactant ions H3O+(H2O)nvia:
H3O+(H2O)n+ X → HX+(H2O)n+ H2O (1)
Thus, also the product ions are hydrated with up to 6 water molecules. Depending on the number of water ligants and on the molecule X proton affinity (PA), also a backward
15
reaction is possible (Viggiano et al., 1988):
HX+(H2O)n+ H2O → H3O+(H2O)n+ X (2)
The lower is the PA of molecule X, the more important is the reverse reaction. In our experimental set-up, we intentionally lowered the total gas pressure in the flow tube reactor to 10 mbar (compared to the previous use of 50 mbar), in order to reduce the
20
occurrence of reverse reactions, which will specifically be addressed later. The resi-dence time in the flow tube reactor is much longer then the reaction time for a collision rate (2.3 10−9cm3s−1), allowing the atmospheric gases to react during traveling in the flow tube reactor. Both products and excess reactant ions enter the quadrupole mass spectrometer where they are selected according to their mass. One mass scan (for ion
25
masses from 10 to 200 amu) lasts 3.2 s. For improving the detection limit of organic trace gases, an integration time of 100 to 200 successive scans has been chosen, leading to a time resolution of 320 to 640 s.
ACPD
4, 3835–3873, 2004
Detection of organic gases in the boreal
forest K. Sellegri et al. Title Page Abstract Introduction Conclusions References Tables Figures J I J I Back Close
Full Screen / Esc
Print Version Interactive Discussion
© EGU 2004
The concentration of the atmospheric gas Xi is obtained from the count rate of Xi , the count rate of the reactant ion H3O+and of the sum of all product ionsΣXj, the measured reaction time τ between the ion source and the detector, and the rate constants k of the ion-molecule reaction (parallel Acims-formula) according to:
[Xi]=(k ∗ τ)−1Xi(H2O)n/ΣXj(H2O)n∗ ln[1+ ΣXj(H2O)n/H3O+(H2O)n], (3) 5
where Xi(H2O)n, Xj(H2O)nand H3O+ (H2O)nare the sum of count rates of all hydrates from n=1 to n=5 when possible (see Sect. 3). How many hydrates are taken into ac-count will be discussed for each compound in Sect. 3. This mixing ratio calculation does not take into account sticking of gases onto the sampling tube walls, reverse reactions and mass discrimination in the mass spectrometer. In order to take those parameters,
10
as well as uncertainties on reaction rate constants into account, in-situ calibrations were performed for Acetonitrile, Acetaldehyde, Methanol, Isoprene and DMA. Calibra-tions were performed on-line during measurements using gas bottle standards, both in zero air and in atmospheric air in order to evaluate the influence of other atmospheric gases on the calibration. Zero air levels are obtained using a commercial zero air
gen-15
erator (Breitfuss GmbH) by passing atmospheric air through a catalyst at 450◦C and quenching the water, with a frequency of about an hour per two days.
3. Ion identification
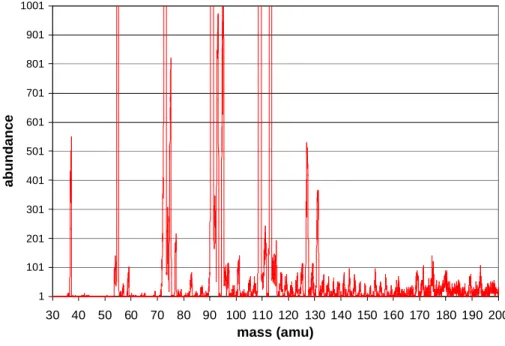
An example of the mass spectra obtained during the campaign is shown Fig. 2. The sensitivity of the instrument was raised to the maximum in order to obtain the best
20
detection limit within our experimental set up. However, a high sensitivity induced a lower mass resolution. This can be seen on Fig. 2 in the proximity of the reactant ion peaks (especially 73 (H3O+ (H2O)3) and 91 amu (H3O+ (H2O)4)). Peaks from ions 1 amu smaller or larger then the reactant ions and hydrates could not always be reliably separated from the reactant ions peaks. This is the case for masses 72, 90, and 108.
ACPD
4, 3835–3873, 2004
Detection of organic gases in the boreal
forest K. Sellegri et al. Title Page Abstract Introduction Conclusions References Tables Figures J I J I Back Close
Full Screen / Esc
Print Version Interactive Discussion
© EGU 2004
We monitored the acquisition of the ion masses summarized in Table 1, sorted by peak families: as already mentioned, core ions XH+can be hydrated with several water molecules and thus be detected at masses higher by several multiples of 18 amu than their original core ion mass. Consequently, at one mass, there can be a contribution of the types XH+, Y(H2O)H+, or Z(H2O)2H+ etc. Therefore, one mass can be the
5
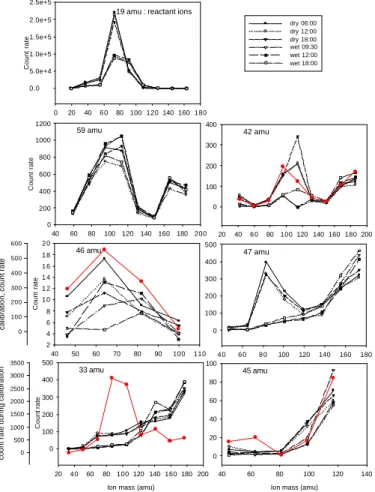
signature, not only of different compounds having the same mass as X (isomers), but also of compound having the mass of Y, Z, etc. In order to distinguish one compound from the other, the count rates of clusters versus the number of hydrates associated to the core mass are studied. Distributions obtained are shown Fig. 3 for the driest and the wettest day of the campaign (20 March 2003 with a water vapor mole fraction of
10
2000–2500 ppm and 23 March 2003 with 6500 ppm), as well as for the calibration tests when available (i.e. for DMA, Acetonitrile, Acetaldehyde, Methanol and Isoprene). For the reactant ion H3O+, the maximum count rate is observed for H3O+(H2O)n clusters with n=3. Since hydration of compounds is dependent on their proton affinity, other atmospheric species, with lower proton affinity than H2O, should have a maximum
15
count rate for clusters with n lower than 3 (i.e. less hydrated). This observation is confirmed during calibrations of Acetonitrile, Acetaldehyde, Methanol, Isoprene and DMA, when the count rates show a maximum for n=3, 1, 3, 1 and 1 respectively in a 4000 ppm water content air.
Because 33 amu, 42 amu, 45 amu, and 46 amu are relatively low molecular masses,
20
atmospheric compounds which are a combination of C, O, N and H with a higher pro-ton affinity than the one of water (Table 2), which are candidates for these masses are of limited number. For these four masses, candidates are respectively protonated Methanol, Acetonitrile, Acetaldehyde and DMA, and we did not find any other com-pound with the required characteristics mentioned above that could interfere at the
25
same masses.
Atmospheric hydrate distributions of the peak families corresponding to mass 33 amu show a maximum count rate plateau on masses 69, 87 and 105 amu. These masses would correspond to (H+Methanol(H2O)2,3,4) or to H+Isoprene(H2O)0,1,2. Thus masses
ACPD
4, 3835–3873, 2004
Detection of organic gases in the boreal
forest K. Sellegri et al. Title Page Abstract Introduction Conclusions References Tables Figures J I J I Back Close
Full Screen / Esc
Print Version Interactive Discussion
© EGU 2004
69 and 87 amu are expected to be mostly representative of Methanol, and mass 105 amu is expected to be mostly representative of Isoprene. Consequently, calcu-lation of the Methanol concentration will be based on masses 51, 69, and 87 amu, while Isoprene concentrations will be calculated on the basis of masses 105, 123 and 141 (Table 3). In fact, mass 141 is occasionally also a maximum count rate in this
5
peak family, and it would stand for H+Isoprene(H2O)4, which should be smaller than H+Isoprene(H2O)3. Another candidate in this peak family is 2-Methyl-3-Buten-2-Ol (hereafter referred as MBO) which protonated mass is 87, and that could contribute to the same masses as Isoprene. MBO is also a biogenic hydrocarbon that has already been measured in the ambient air of a pine forests (Goldan et al., 1993; Spaulding et
10
al., 2003) and in a sub alpine forest by Karl et al. (2002). Measurements of MBO inter-fere with measurements of Isoprene in the PTRMS method as well (Karl et al., 2002). However, the pine species found in Hyytiala are not MBO-emitting species and MBO will not be considered to contribute to the mass 69 amu mixing ratios.
Atmospheric hydrate distributions of the peak families corresponding to mass 42 amu
15
(Acetonitrile, CH3CN) show a maximum count rate 114 amu, which would correspond to (H+Acetonitrile(H2O)4). During calibration of Acetonitrile though, a maximum count rate is observed for 96 amu, corresponding to H+Acetonitrile(H2O)3. This would indi-cate that a compound with a mass of the type 41+x18 amu (where x could be 1, 2 or 3) is actually measured in the atmosphere and overlapping Acetonitrile hydrate
dis-20
tribution. The protonated compound X which would give a maximum count rate at 114 amu in atmospheric air for n=3 (i.e. in the form H+X(H2O)3) would have the mass 60 amu. The candidate for this mass is TriMethyl Amine (TMA). Once respectively protonated and hydrated, TMA (59 amu) and Acetonitrile (41 amu) have both a signa-ture at 60 amu, and furthermore at 78 amu and 96 amu. For the calculation of their
25
respective mixing ratio, we have, during calibration of Acetonitrile in zero air (where TMA mixing ratios were less than 10 ppt), calculated the ratio of CH3CN(H2O)3(mass 96) to CH3CN(H2O)2(mass 78) and CH3CN(H2O)4(mass 114) for different water vapor contents. We obtain a “shape” of clustering hydrate distribution of CH3CN for different
ACPD
4, 3835–3873, 2004
Detection of organic gases in the boreal
forest K. Sellegri et al. Title Page Abstract Introduction Conclusions References Tables Figures J I J I Back Close
Full Screen / Esc
Print Version Interactive Discussion
© EGU 2004
relative humidity. Ratios of mass 96 to masses 114 and 78 amu are proportional to the water content, as shown Fig. 4. Thus, for calculation of respectively Acetonitrile and TMA mixing ratio in atmospheric air, the shape clustering hydrate distribution of CH3CN for different relative humidity is assumed to be the same as for calibrations. Then, the contribution of Acetonitrile to mass 96 amu is calculated from the count rate ratio mass
5
96/mass 78 (Fig. 4), 78 amu presumably all due to Acetonitrile. Once calculated, the contribution of Acetonitrile to mass 96 is subtracted it for the measured count rate of mass 96 in order to obtain the contribution from TMA to this mass. The same pro-cedure is applied for mass 114 amu. After calculation, we did not find any correlation or anti-correlation between Acetonitrile and TMA or Acetonitrile and H2O or TMA and
10
H2O, indicating that there was no bias in the calculation and that both compounds are clearly distinct from each other.
Atmospheric hydrate distributions of the peak families corresponding to mass 45 amu do not show a clear maximum count rate in atmospheric air, but do show a max-imum count rate during calibration of Acetaldehyde for 63 amu, corresponding to
15
H+Acetaldehyde(H2O). Count rates raise again after mass 81 amu thought, (Fig. 3) in-dicating a compound different from Acetaldehyde is responsible for these count rates, and only masses 45, 63 and 81 were taken into account in the Acetaldehyde mixing ratio calculation.
Atmospheric hydrate distributions of mass 46 amu (DMA) show a maximum count
20
rate for mass 64 amu, which corresponds to (DMA(H2O)), in agreement with the hy-drate distributions of calibrated DMA.
Both protonated ethanol and formic acid are candidates for mass 47 amu. Respec-tive proton affinities of ethanol and formic acid are 185.5 and 178 kcal mol−1(Table 3), which are similar. Thus it is difficult to distinguish between the two compounds from
25
their hydration, which shows a maximum count rate at n=2. Also Lindinger et al. (1998) found both compounds with a signature 47 amu. Similarly, protonated Propanol or Acetic Acid are candidate for mass 61 amu, with respective proton affinities of 189.4 and 188 kcal mol−1. However, Lindinger et al. (1998) found that while acetic acid has
ACPD
4, 3835–3873, 2004
Detection of organic gases in the boreal
forest K. Sellegri et al. Title Page Abstract Introduction Conclusions References Tables Figures J I J I Back Close
Full Screen / Esc
Print Version Interactive Discussion
© EGU 2004
a signature at 61 amu (in the regular hydrated form HX+), Propan-1ol and Propan-2-ol have a signature at 43 amu for respectively 80% and 90% of their mass, corresponding to the loss of a molecule of H2O. In this study, hydrate distributions in atmospheric air show a maximum count rate at m=97 amu which would stand for Propanol(H3O+)3 or Acetic Acid(H3O+)2.
5
Possible contributors to mass 59 amu include Acetone, Propanal and Glyoxal. Propanal have been excluded by PITMAS studies in aircraft-based atmospheric mea-surements (Shr ¨oder et al., 2003). Glyoxal has a short atmospheric lifetime due to rapid photolysis, and the variability of the signal associated to mass 59 amu shows a life-time close to the lifelife-time of Acetone. Hydrate distribution of the peak serie of mass 59
10
shows a maximum count rate for n=2 clusters for the driest day, and for n=3 clusters for the wettest day. Consequently, count rates of masses 59, 77, 95, 113 and 131 amu are taken into account to calculate the Acetone concentration according to Eq. (3).
Possible contributors to mass 69 include protonated Isoprene, Cyclopentene, and Furan. Candidates for mass 71 amu are protonated Methyl Vinyl Ketone and
15
Methacrolein, hereafter referred as MVK/MaCR, which are both oxidation products from Isoprene (Williams et al., 2000). Correlation between mass 69 amu and mass 71 amu are highly significant during the QUEST campaign (Fig. 5a). Good correla-tion was also observed between Isoprene and MVK+MACR with an airborne PTR-MS (Warneke et al., 2001). Consequently, at this stage, we propose Isoprene as a
can-20
didate for mass 69 amu, and the sum of MVK and MaCR, as oxidation products of Isoprene for mass 71 amu.
A maximum count rate is observed for mass 169 amu, leading to high mixing ratios for the compound contributing to this mass. The contribution to mass 169 amu can be of the types XH+, Y(H2O)H+ or Z(H2O)2H+, where X is 132 amu, Y is 150 amu and Z
25
is 168 amu. For each of the compounds X, Y and Z, a candidate was investigated:
– A possible contributor for 132 amu is Glutaric Acid. With a molecular structure
containing to carboxyl groups, Glutaric Acid has a high potential to form hydrogen bonds. However, there is little information on the proton affinity of this compound.
ACPD
4, 3835–3873, 2004
Detection of organic gases in the boreal
forest K. Sellegri et al. Title Page Abstract Introduction Conclusions References Tables Figures J I J I Back Close
Full Screen / Esc
Print Version Interactive Discussion
© EGU 2004
We tested its capacity to be measured with the CIMS instrument by injecting va-pors of a 1% aqueous solution of Glutaric acid into a proton transfer instrument (PITMAS). No signature of Glutaric vapors was found in the PITMAS spectra, indi-cating that its proton affinity is not high enough to be measured with this method.
– We did not find any combination of C, O, N, and H which could be an atmospheric
5
compound of mass 150 amu with a proton affinity larger than water.
– One contributor to mass 169 amu can be pinonaldehyde. This compound has
been identified as a major oxidation product of pinene (Hakola et al., 1994; Yu et al., 1999a). Other oxidation products of Monoterpenes (MTOP) such as 3-carene, limonene and Terpinolene can also contribute to the mass of 169 amu
10
(Hakola et al., 1994). If mass 169 amu is composed of XH+ with X being pinon-aldehyde or another MTOP, it implies that pinonpinon-aldehyde is poorly hydrated, the n=1 hydrate (mass 187 amu) being less abundant than the n=0 hydrate (mass 169 amu)(Fig. 3). This is consistent with the fact that a similar poor hydration was observed during the calibrations of the other aldehydes (Acetaldehyde), which
15
maximum count rate was for the clusters containing only one molecule of water. Consequently, the most likely candidate compounds contributing to mass 169 amu are MTOP. Moreover, a maximum count rate is observed for mass 173 amu (peak fam-ily 47 amu), with a possible contribution of the type Z(H2O)2H+, with Z being mass 136 amu, representative of α-pinene and other Monoterpenes. Mass 136 has already
20
been reported to be an indicator for Monoterpenes at forest sites (Helmig et al., 1998; Wisthaler, 2001). Also, selected ion flow tube studies have shown that Monoterpenes M (α-pinene, β-pinene, limonene, ∆3-carene, Myrcene and Camphene) react with H3O+ via proton transfer at the collisional rate and result in the protonated MH+ with mass m/z=137 amu (Schoon et al., 2003). Correlation between the proposed
candi-25
dates Monoterpenes and MTOP are fairly good (Fig. 5b), confirming our hypothesis. A last, a maximum count rate is observed on mass 179 amu (peak family 71 amu), with a relative high frequency and amplitude. Candidates which could contribute to this
ACPD
4, 3835–3873, 2004
Detection of organic gases in the boreal
forest K. Sellegri et al. Title Page Abstract Introduction Conclusions References Tables Figures J I J I Back Close
Full Screen / Esc
Print Version Interactive Discussion
© EGU 2004
mass are the compounds of mass 178 amu (in the form XH+), 160 amu (in the form Y(H2O)H+), and mass 142 amu (in the form Z(H2O)2H+). Mass 142 amu corresponds to the mass of Cis-3-hexenyl Acetate, (C8H14O2), a substance emitted when grass is freshly cut, and which preservation in a refrigerated, pH-adjusted environment should make the detection with cartridge-type sampling difficult. Very few publications have
5
dealt with this compound though, which makes its identification rather unreliable. How-ever, the level of its mixing ratio, and as will be presented later, the times series of this compound make it of considerable interest.
4. Calibration factors and reverse reactions (water dependence)
Calibrations have been performed using standard gases bottle (DMA, Acetonitrile,
Ac-10
etaldehyde, Isoprene and Methanol). The intensity of reverse reactions (Eq. 2) can be evaluated from the dependence of calibration factors on the water vapor mixing ratio. For DMA and Isoprene, the water dependence of the calibration factor is less than a factor 1.5 between 2000 and 6500 ppm H2O (range of water content during campaign). For Methanol and Acetaldehyde though, a clear dependence of the calibration factor on
15
the water content is observed with a high increase up to 25 times less Methanol mea-sured than injected at 6000 ppm. For Acetonitrile, no water dependence is observed below 6000 ppm H2O but an abrupt rise is measured for higher water contents. During the QUEST campaign though, water contents were not higher than 6500 ppm. These observations are in agreement with the theory already mentioned, that the closer is
20
the PA of the measured compounds to the PA of water, the more efficient will be the reverse reaction.
Acetone has been calibrated and reverse reactions with water studied with the CIMS apparatus in previous work (Wohlfrom et al., 1999). Calibration factors and water de-pendence were found to be very similar to the ones found for Acetonitrile (in agreement
25
with their similar PAs).
ACPD
4, 3835–3873, 2004
Detection of organic gases in the boreal
forest K. Sellegri et al. Title Page Abstract Introduction Conclusions References Tables Figures J I J I Back Close
Full Screen / Esc
Print Version Interactive Discussion
© EGU 2004
possible and significant. From the known PA of compounds studied in this work, we can elaborate a scale of reverse reaction rate coefficients relative to the reverse reactions measured from calibrated compounds. Starting form Isoprene (PA of 197), the water dependence is negligible in the range of 3000–6000 ppm of water. Thus also a low reverse reaction is found for DMA (PA of 218–225) and no reverse reaction is expected
5
from compounds such as TMA and MVK+MaCR. However, for Ethanol/Formic Acid (re-spective PAs of 185.5 and 178) and Propanol/Acetic Acid (re(re-spective PAs of 189.4 and 188), a reverse reaction with water can occur and is not taken into account, leading to an underestimation of the mixing ratios calculated in this work. For these compounds, we will only be able to give a lower limit of the concentrations measured in the
bo-10
real forest atmosphere. According to the correction applied on calibrated species of equivalent PAs, the uncertainty on the mixing ratios measured for Ethanol/Formic Acid, Propanol/Acetic Acid, can be estimated to be up to a factor 4 for ethanol and high water contents. The lack of data on the PA of pinonaldehyde, other MTOP and Monoterpenes make it difficult to evaluate the uncertainty on the mixing ratios calculated in this work,
15
and they have to be considered as lower limits.
5. Concentrations and daily variations
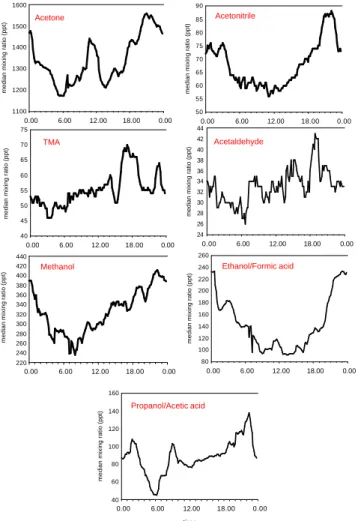
Atmospheric trace gas mixing ratios are presented in Table 4, as well as the detection limits calculated as twice the standard deviation on the zero air levels (Table 4). All compounds but DMA are above the detection limit, the highest mixing ratio is found
20
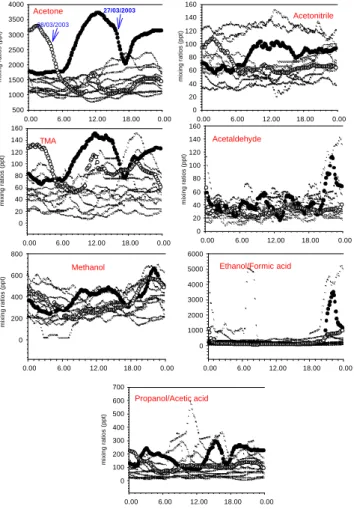
for Acetone, closely followed by mass 168 amu (candidate: MTOP). After applying a 9 data points smoothing procedure, a median diurnal variation has been calculated over the two weeks measuring period (Fig. 6b), all data are plotted according to the time of the day on Fig. 6a to show the variability on this median daily profile. Two outstanding days are varying significantly from the median concentration (27 and 28 March), these
25
days have been highlighted in Fig. 6a.
atmo-ACPD
4, 3835–3873, 2004
Detection of organic gases in the boreal
forest K. Sellegri et al. Title Page Abstract Introduction Conclusions References Tables Figures J I J I Back Close
Full Screen / Esc
Print Version Interactive Discussion
© EGU 2004
sphere and 500 pptv in the Northern atmosphere (Singh et al., 1995). The average mixing ratios measured during the Quest campaign are clearly above background lev-els, and varied from 1 to 3.5 ppbv. Acetone has been measured at similar mixing ratios (1–2 ppbv) over the rain forest (P ¨oschl et al., 2001), in rural areas in Eastern Canada (around 3 ppbv)(Biesenthal et al., 1998) but also in the upper troposphere (Wohlfrom
5
et al., 1999) and at much higher mixing ratios in urban areas (1–18 ppbv from the Fraser valley, O’Brien et al., 1997). Acetone has both direct emission and secondary photochemical sources in the atmosphere. The major secondary source for Acetone in the lower troposphere is the photochemical reaction of the OH radical and propane (Singh, 1994) and also Monoterpenes (Wisthaler et al., 2001). Direct emission sources
10
for Acetone include anthropogenic and biogenic emissions, including direct emission from vegetation, decaying organic material, biomass burning (Singh et al., 1994) and possibly an oceanic source (Jacob, 2002). Acetone is removed from the atmosphere by photolysis, the reaction with OH radicals and wet and dry deposition (Jacob, 2002). The Acetone diurnal variations show one peak during the morning between 10:00 and
15
12:00 UTC and one peak during the night with a maximum around 21:00. As most organic trace gases diurnal profile show a maximum around 21:00, it is believed that the onset of a nocturnal inversion is responsible for their accumulation close to the ground, including Acetone. The morning peak can be ascribed to a strong photochem-ical source (thus related to the radiation diurnal profile), as well as it can be due to
20
direct emissions from vegetation and soil (thus related to the temperature profile). Isoprene is released to the atmosphere by forest areas in high quantities (i.e. 44% of the total VOC emissions by vegetation, Guenther et al., 1995). It is highly reactive, its oxidation products being Methyl Vinyl Ketone (MVK) and Methacrolein (MaCR) as the highest yield. In Hyytiala, low concentrations are expected because of the type
25
of vegetation, which is composed of poor Isoprene emitters (Scots pine and Norway spruce)(Hakola et al., 2003). Isoprene has been reported to have a high seasonal vari-ability, with a maximum during the growing season (from mid-June to mid-September in the boreal zone)(Hakola et al., 2000, 2003) while its oxidation products MVK and
ACPD
4, 3835–3873, 2004
Detection of organic gases in the boreal
forest K. Sellegri et al. Title Page Abstract Introduction Conclusions References Tables Figures J I J I Back Close
Full Screen / Esc
Print Version Interactive Discussion
© EGU 2004
MaCR remained constant through the year. (Isoprene+MBO) mixing ratios reached 6.5 ppbv over the tropical rain forest in March (Warneke et al., 2001) and 8 ppbv over a Northern American temperate forest in July (Helmig et al., 1998), while the typical mix-ing ratios of Isoprene and (MVK+MACR) measured during Quest were, as expected, much lower: roughly between 100 and 200 pptv. In fact, these mixing ratios are higher
5
than previous measurements of Isoprene on the site of Hyytiala (average 41 ppt in Au-gust – Spirig et al., 2003 – and average 10 pptv in may – Hakola et al., 2000), and may indicate a non-negligible contribution of another compound, to the masses selected for the analysis of Isoprene. Our MVK+MACR mixing ratios are the same levels as the mass 69 amu mixing ratios (median 165 ppt). MVK and MaCR have been previously
10
measured with the same level of concentration than Isoprene during March 2001 at the SMEAR station (Hakola et al., 2003). Due to its sources and high reactivity with NO3at night (lifetime/NO3 is 0.8 h, Seinfeld and Pandis 1998), Isoprene is usually measured in the literature with a diurnal profile showing a maximum at 18:00 LT (Goldan et al., 1995; Lindinger et al., 1998; Biesenthal et al., 1998; Warneke et al., 2001). During
15
the Quest campaign, Isoprene showed a diurnal profile with three peaks: one in the morning around 8:00 UTC, one in the afternoon around 14:00 and the most important one around 21:00 starting around 18:00. The fact that Isoprene reaches a maximum in the first part of the night is in contradiction with a late afternoon peak usually observed for Isoprene. For the increase of Isoprene up to 21:00 to be ascribed to the onset of the
20
nocturnal inversion layer, the source of Isoprene has to be still active until late in the af-ternoon and also in the beginning of the night, which is unlikely. MVK+MACR show the same pattern as the daily pattern of Isoprene, with a more pronounced morning and af-ternoon peaks and a broader night peak. It has been suggested that an anthropogenic source was contributing to the MVK and MaCR mixing ratios in order to explain the
25
higher than expected winter time concentrations (Hakola et al., 2003). Because of the level of its mixing ratios, which are high compared to previous measurements on the same site, and because of its diurnal variation, mass 69 amu might contain the contribu-tion of another compound than Isoprene. However, we do not have any other candidate
ACPD
4, 3835–3873, 2004
Detection of organic gases in the boreal
forest K. Sellegri et al. Title Page Abstract Introduction Conclusions References Tables Figures J I J I Back Close
Full Screen / Esc
Print Version Interactive Discussion
© EGU 2004
for this mass, which seems to be correlated to other biogenic compounds (Monoter-penes, MTOP and MVK+MaCR). Consequently, we will refer hereafter to mass 69 amu as Isoprene event though we need to be cautious with its identity.
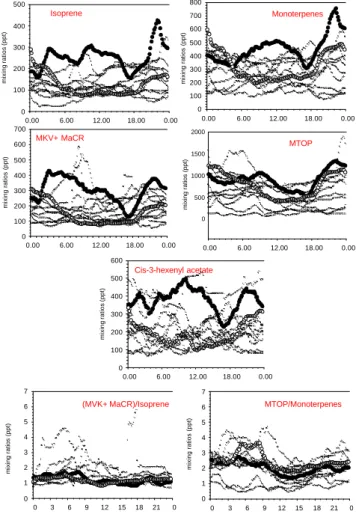
In order to further investigate the chemistry going on between the candi-dates Isoprene and MVK+MACR, we studied the diurnal variation of the ratio
5
MVK+MACR/Isoprene. We observe a similar diurnal pattern than the one previously observed by Biesenthal et al. (1998), with a 3:00 to 6:00 UTC maximum and a day minimum. The MVK+MaCR/Isoprene ratio is driven by OH which destroys Isoprene while producing and destroying MVK+MaCR, but also the concentration of NOx has an impact on this ratio, as well as the source strength of Isoprene, which life time is
dif-10
ferent from the one of MVK+MaCR. Brief morning peaks of Isoprene and MVK+MaCR indicates rapid photochemical processes taking place after the night surface layer out-break.
Mass 136 amu mixing ratios (candidate: Monoterpenes) are quite similar to the ones of the other terpenes (Isoprene) measured with CIMS during the Quest campaign,
15
with a median mixing ratio of 300 ppt. Similarly to Isoprene, the total monoterpene concentrations show a high seasonal variability with a maximum in summer and typical mixing ratios of around 500 ppt measured in April in the boreal forest (Hakola et al., 2000) and the sum of Monoterpenes has been detected above the boreal forest canopy with concentrations of 360 ppt at 18 m above the ground during BIOFOR2 (Spanke et
20
al., 2001), which lies within the range of our measurements. Spanke et al. (2001) previously measured in Hyyti ¨al ¨a a monoterpene daily variation showing a night time maximum and daytime minimum. We also measure a nighttime maximum although our daily variation is a little bit more complex with also two daily secondary maxima (Fig. 6b).
25
The MTOP mixing ratios measured in Hyyti ¨al ¨a were in the range 320–840 pptv, which are the highest mixing ratios measured after Acetone. We choose Pinonaldehyde as a representative of those MTOP, as it is a main oxidation product of α-pinene, itself main monoterpene detected in the boreal atmosphere (Hakola et al., 2000; Spanke
ACPD
4, 3835–3873, 2004
Detection of organic gases in the boreal
forest K. Sellegri et al. Title Page Abstract Introduction Conclusions References Tables Figures J I J I Back Close
Full Screen / Esc
Print Version Interactive Discussion
© EGU 2004
et al., 2003). The main production path of pinonaldehyde is the oxidation of Monoter-penes with O3 (Yu et al., 1999b) or OH radicals. Measured primary yields of pinon-aldehyde from the reaction between α-pinene and OH radicals during chamber exper-iments were higher than the yields of Acetone (respectively 30% and 12%, Wisthaler et al., 2001) and hence, high mixing ratios of pinonaldehyde are expected at the
Hyy-5
tiala site. However, to our knowledge, atmospheric measurements of MTOP are very scarce and comparison with other sites is difficult. Pinonaldehyde has been mea-sured on the Hyyti ¨al ¨a site with maximum concentrations of 140 ppt, which indicate that other Monoterpene Oxidation Products comprise a non-negligible part of the MTOP measured with CIMS. As already shown in Fig. 5b, MTOP and Monoterpenes are
cor-10
related. Figure 6a shows Monoterpenes and MTOP have a similar diurnal variation, also very comparable to Isoprene and MVK+MaCR showing maximum concentrations at night. This nighttime maximum of Monoterpenes has previously been observed by Lindinger at al. (1998) and attributed to emissions by the wood during the day and dur-ing the night, but effective dissociation during the day. Monoterpenes nighttime maxima
15
have also bee observed by Hakola et al. (2000) and attributed to trapping of the emit-ted compounds in a nocturnal inversion layer. Hakola et al. (2000) do not measure any daytime peak, and explain this with a high OH radical sink and dilution by vertical transport. From our data set, daytime peaks are observed with the same covariation for Isoprene, Monoterpenes, MVK+MaCR and CO, with a mid-morning decrease of about
20
3 h. The yield of pinonaldehyde from Monoterpenes was estimated to be 48%, and the following yield of CO from pinonaldehyde was estimated to be 13.4% (Hatakeyma et al., 1991). However, the contribution of the oxidation of other organic compounds should be necessary to explain the change of several tens of ppb in the CO concen-tration. Also, co-variations between CO, Monoterpenes and MTOP can also be due to
25
dynamics-driven variations of the concentrations. The daytime peaks of Isoprene, and Monoterpenes, are consistent with the diurnal variation of the emissions, which are temperature dependent. Compared to MVK+MaCR, MTOP rarely shows a daytime peak though, and might be more rapidly removed in the presence of light. According to
ACPD
4, 3835–3873, 2004
Detection of organic gases in the boreal
forest K. Sellegri et al. Title Page Abstract Introduction Conclusions References Tables Figures J I J I Back Close
Full Screen / Esc
Print Version Interactive Discussion
© EGU 2004
Glasius et al. (1997), pinonaldehyde reacts twice as fast as a-pinene with OH radical which would explain the low daytime mixing ratios of MTOP. Highest concentrations of BVOC oxidation products (and among them pinonaldehyde) have previously been observed to occur in the early morning hours (Spanke et al., 2001). The mid-day de-pletion is unexplained by photochemistry or dynamics; it is correlated with the increase
5
of Acetone, and with the appearance of the particle nucleation burst.
Similarities are observed between the diurnal variations of the ratio MVK+MaCR/Isoprene and the diurnal variations of the ratio MTOP/Monoterpenes (maximum values at night and a sharp morning decrease)(Fig. 6a). This is in agreement with the higher reactivity to OH of pinonaldehyde compared to pinene, as
10
mentioned above.
Cis-3-hexenyl Acetate has a diurnal variation similar to the ones of Isoprene, Monoterpenes, and especially close to the diurnal variation of their oxidation products, confirming its biogenic origin. Measured mixing ratios of Cis-3-hexenyl Acetate during Quest range between 130 and 300 ppt, which are higher than the concentrations of
15
MVK+ MaCR and indicates the presence of another biogenic compound detected at these masses.
In the literature, emission rates of Methanol were calculated to be larger than those of Isoprene, Methanol having a major biogenic source (Lamanna and Goldstein, 1999). Our measurements show mixing ratios varying between 230 and 425 pptv. These ratios
20
are indeed two times higher than the mixing ratios of Isoprene in Hyyti ¨al ¨a. However, Methanol has been reported to be an ubiquitous compound in the atmosphere which levels in remote conditions are around 1 ppbv (de Gouw et al., 2003), which is twice as high as what we measured. Although the high water dependence of Methanol due to non negligible reverse reactions has been taken into account with calibrations, the
25
uncertainty on the mixing ratios of this compound are slightly higher than for other com-pounds, because of the additional uncertainty of the water vapor measurements and of the dependence of the calibration factor. Ethanol/Formic Acid and Propanol/Acetic Acid are respectively two and four time lower than Methanol. Ethanol/Formic Acid
concen-ACPD
4, 3835–3873, 2004
Detection of organic gases in the boreal
forest K. Sellegri et al. Title Page Abstract Introduction Conclusions References Tables Figures J I J I Back Close
Full Screen / Esc
Print Version Interactive Discussion
© EGU 2004
trations show a high variability (Fig. 6b), and there are indications of a contaminating source in the vicinity of the measurement station. However, the contaminations are easily detected and can be excluded. Its median daily variations are similar to the ones of Methanol with nighttime maximum and daytime minimum. Propanol/Acetic Acid do not show the same daily pattern then Acetone on the particularly highly concentrated
5
days (27 and 28 March, Fig. 6a), but show a similar median daily pattern then Acetone (Fig. 6b), with a mid-day peak and a nighttime maximum.
In remote areas, Acetonitrile has been found with mixing ratios of 100–200 pptv (Reiner et al., 2001). The mean mixing ratio found during QUEST is 75 pptv, with concentrations main variations between 50 and 100 pptv (25ile and 75ile). The major
10
source of Acetonitrile seems to be biomass burning (Holzinger et al., 1999), while an-thropogenic fuel burning plays only a minor role (Holzinger et al., 2001). Acetonitrile may therefore serve as a tracer for biomass burning activity. Sinks of Acetonitrile are the chemical reaction with OH radicals, dry or wet deposition. Lifetime against the reaction of OH and photolysis is of the order of magnitude of 1–3 years, thus much
15
higher than the time scale of the condensing process. The mixing ratios of Acetoni-trile measured during Quest, found to be lower than mixing ratios in remote areas, would indicate that it is not locally produced. With such a long life time and without any local source, Acetonitrile should be rather stable during the day. However, as for Methanol and Ethanol/Formic Acid, Acetonitrile shows maximum mixing ratios at night
20
and minimum mixing ratios during the day (Fig. 6b). Nighttime maxima of Acetonitrile and ethanol can, as for Acetone, be explained by the onset of a nocturnal inversion, together with higher destruction processes during day compared to night.
Mixing ratios of Acetaldehyde measured during the campaign range between 15 and 50 pptv (25ile and 75ile). Acetaldehyde is a common photo-oxidation product of many
25
organic compounds in the atmosphere, and itself a precursor of Peroxyacetyl Nitrate (PAN, CH3C(O)OONO2) in polluted air. Acetaldehyde has one of the shortest day-lifetime of all analyzed compound (after Isoprene) and is also destroyed at night by its reaction with NO3, but at a slower rate (night-lifetime/NO3is 17 days, Seinfeld and
ACPD
4, 3835–3873, 2004
Detection of organic gases in the boreal
forest K. Sellegri et al. Title Page Abstract Introduction Conclusions References Tables Figures J I J I Back Close
Full Screen / Esc
Print Version Interactive Discussion
© EGU 2004
Pandis, 1998). Our daily variation of Acetaldehyde are not very pronounced, which, together with the low mixing ratio measured at the site, indicate either the lack of a local source of this compound at the measurement site, or its immediate destruction. From Fig. 6a, there are indications that the contamination source producing ethanol also contained Acetaldehyde.
5
DMA mixing ratios are below the detection limit of 32 pptv, and TMA mixing ratios vary between 34 and 80 pptv. TMA has a late afternoon peak which is not seen in any other compound measured at the site with this technique.
6. Summary and conclusions
The goal of this study was to address the different organic compounds measured
10
with the CIMS method during the QUEST campaign. We proposed candidates for the masses observed in the spectra measured in the Boreal atmosphere. Based on the study of their hydrate distribution, Methanol, Acetonitrile, Acetaldehyde, DMA, Ethanol/Formic Acid, Acetone, TMA, Propanol/Acetic Acid, Isoprene, MVK/MaCR, and MTOP are proposed as candidates for masses 33, 41, 44, 45, 46, 58, 59, 60, 68 and
15
86, 70, 136 and 168 amu, respectively. The consistency of the candidates proposed for these masses is tested with correlations: biogenic compounds are highly correlated with each other, even though we need to be cautious with the identity of compound 69 amu (candidate = Isoprene). The good correlation found between independent measurements of CO (commercial instrument) and most trace gases measured with
20
CIMS (Sellegri et al., accepted, 2004) validate both the very different measurement techniques, and might indicate that air mass dynamics play a major role in the trace gases concentrations measured on the site.
Concentrations of Acetone are in the range of the concentrations found in the liter-ature in forest areas, and Acetonitrile in the range of concentrations found in remote
25
areas. Methanol is measured with mixing ratios two times higher than in the remote regions, ethanol//formic acid and Propanol/Acetic Acid are measured with
concentra-ACPD
4, 3835–3873, 2004
Detection of organic gases in the boreal
forest K. Sellegri et al. Title Page Abstract Introduction Conclusions References Tables Figures J I J I Back Close
Full Screen / Esc
Print Version Interactive Discussion
© EGU 2004
tions respectively two and four times lower than Methanol. Amines are found with the lowest concentrations.
While Monoterpenes have been measured with similar mixing ratios than previously found at the same site and same season, Isoprene concentration was about an order of magnitude higher, and a contribution from another compound can not be excluded.
5
Isoprene and Terpenes Oxidation Products (MVK/MaCR and MTOP) were measured with relatively high concentrations (up to 1 ppb at night for MTOP).
All of the measured organic trace gases but TMA show higher mixing ratios at night, in agreement with measurements of CO. This is ascribed to the onset of a nocturnal inversion, coupled with continuous emission by the forest into the night and higher
10
dissociation during the day. In particular, oxidation products of Monoterpenes and Isoprene are significantly higher at night, implying that an active NO3chemistry is also taking place. In fact, the ratio oxidation product/primary organic, both for Isoprene and Monoterpenes, are higher at night by a factor 1.5. Daytime peaks are observed with the same covariation for Isoprene, Monoterpenes, MVK/MaCR and CO, with a
mid-15
morning decrease of about 3 h. The covariance may be indicative of a local important production of CO, or may be indicative that the dynamics of the boundary layer are the main factor influencing the organic concentrations on the site. The mid-day depletion may be indicative of a condensing process coinciding with the appearance of nucleation bursts.
20
This paper is preparing for further discussions on the implications that the detection of these species have on the atmospheric physics and particularly on the formation or growth of new particles in the boreal forest atmosphere. This matter is addressed in a companion paper (Sellegri et al., accepted, 2004).
Acknowledgements. The QUEST project was funded by the European Community. The
au-25
thors are very grateful to B. Preissler and R. Zilly for their participation to the instrumental set up, to G. Eerdekens for supporting work in the lab, and wish to thank H. Hakola for helpful discussions.
ACPD
4, 3835–3873, 2004
Detection of organic gases in the boreal
forest K. Sellegri et al. Title Page Abstract Introduction Conclusions References Tables Figures J I J I Back Close
Full Screen / Esc
Print Version Interactive Discussion
© EGU 2004
References
Arnold, F., B ¨urger, V., Droste-Fanke, B., Grimm, F., Krieger, A., Schneider, J., and Stilp, T.: Ace-tone in the upper troposphere and lower stratosphere: Impact on trace gases and aerosols, Geophys. Res. Lett., 24, 3017–3020, 1997.
Atkinson, R.: Gas phase tropospheric chemistry of organic compounds, J. Phys. Chem. Ref.
5
Data Monogr., 2, 1–216, 1994.
Biesenthal, T. A., Bottenheim, J. W., Shepson, P. B., Li, S.-M., and Brickell, P. C.: The chemistry of biogenic hydrocarbons at a rural site in eastern Canada, J. Geophys. Res., 103, 25 487– 25 498, 1998.
De Gouw, J., Warneke, C., Karl, T., Eerdekens, G., Van der Veen, C., and Fall, R.: Sensitivity
10
and specificity of atmospheric trace gas detection by proton-transfer-reaction mass spec-trometry, International Journal of Mass Specspec-trometry, 223–224, 365–382, 2003.
Glasius, M., Calogirou, A., Jensen, N. R., Hjorth, J., and Nielsen, C. J.: Kinetic study of gas-phase reactions of pinonaldehyde and structurally related compounds, International Journal of Chemical Kinetics, 29, 527–533, 1997.
15
Goldan, P. D., Kuster, W. C., and Fehesenfeld, F. C.: The observation of a C5 alcohol emission in North American pine forest, Geophys. Res. Lett., 20, 1039–1042, 1993.
Goldan, P. D., Kuster, W. C., Fehesenfeld, F. C., and Montzka, S. A.: Hydrocarbon measure-ments in the southeastern United States: the Rural Oxidants in the Southern Environment (ROSE) program 1990, J. Geophys. Res., 100, 25 945–25 963, 1995.
20
Guenther, A., C. Hewitt, N., Erickson, D., Fall, R., Geron, C., Graedel, T., Harley, P., Klinger, L., Lerdau, M., McKay, W. A., Pierce, T., Scholes, B., Steinbrecher, R., Tallamraju, R., Taylor, J., and Zimmerman, P.: A global model of nature volatile organic compound emissions, J. Geophys. Res., 100, 8873–8892, 1995.
Hakola, H., Arey, J., Aschmann, S. M., and Atkinson, R.: Product formation from the
gas-25
phase reactions of OH radicals and O3with a series of Monoterpenes, J. Atmos. Chem., 18, 75–102, 1994.
Hakola, H., Laurina, T., Rinne, J., and Puhto, K.: The ambient concentrations of biogenic hydrocarbons at a northern European, boreal site, Atmos. Environ., 34, 4971–4982, 2000. Hakola, H., Tarvainen, V., Laurina, T., Hiltunen, V., Hellen, H., and Keronen, P.: Seasonal
30
variation of VOC concentrations above a boreal coniferous forest, Atmos. Environ., 37, 1623– 1634, 2003.
ACPD
4, 3835–3873, 2004
Detection of organic gases in the boreal
forest K. Sellegri et al. Title Page Abstract Introduction Conclusions References Tables Figures J I J I Back Close
Full Screen / Esc
Print Version Interactive Discussion
© EGU 2004
Hanke, M., Umann, B., Uecker, J., Arnold, F., and Bunz, H.: Atmospheric measurements of gas-phase HNO3 and SO2 using chemical ionization mass spectrometry during the MINATROC field campaign 2000 on Monte Cimone, Atmos. Chem. Phys., 3, 417–436, 2003.
Hatakeyma, S., Izumi, K., Fukuyama, T., Akimoto, H., and Washida, N.: Reactions of OH with α-pinene and β-pinene in air: Estimate of global CO production from the atmospheric
5
oxidation of terpenes, J. Geophys. Res., 96, 947–958, 1991.
Helmig, D., Greenberg, J., Guenther, A., Zimmerman, P. and Geron, C.: Volatile organic com-pounds and Isoprene oxidation products at a temperate deciduous forest site, J. Geophys. Res., 103, 22 397–22 414, 1998.
Hoffman, T., Odum, J. R., Bowman, F., Collins, D., Klockov, D., Flagan, R. C., and Seinfeld,
10
J. H.: Formation of organic aerosols from the oxidatio of biogenic hydrocarbons, J. Atmos. Chem., 26, 189–222, 1997.
Holzinger, R., Warneke, C., Hansel, A., Jordan, A., Lindinger, W., Scharffe, D. H., Schade, G., and Crutzen, P. J.: Biomass burning as a source of formaldehyde, Acetaldehyde, Methanol, Acetone Acetonitrile, and hydrogen cyanide, Geophys. Res. Lett., 26, 1161–1164., 1999.
15
Holzinger, R., Jordan, A., Hansel, A., and Lindinger, W.: Automobile emissions of Acetonitrile: assessment of tis contribution to the global source, J. Atmos. Chem., 38, 187–193, 2001. Jacob, D. J., Field, B. D., Jin, E. M., Bey, I., Li, Q., Logan, J. A., Yantosca, R., and
Singh, H. B.: Atmospheric budget of Acetone, J. Geophys. Res., 107, D10, 4100, doi:10.1029/2001JD000694, 2002.
20
Karl, T. G., Spirig, C., Rinne, J., Stroud, C., Prevost, P., Greenberg, J., Fall, R., and Guen-ther, A.: Virtual disjunct eddy covariance measurements of organic compound fluxes from a subalpine forest using proton transfer reaction mass spectrometry, Atmos. Chem. Phys., 2, 279–291, 2002.
Kulmala, M., Hameri, K., Aalto, P. P., Makela, J. M., Pirjola, L., Nilsson, D., Buzorius, G.,
25
Rannik, U., Dal Maso, M., Seidl, W., Hoffman, T., Janson, R., Hansson, H.-C., Viisanen, Y., Laaksonen, A., and O’Dowd, C.: Overview of the international project on biogenic aerosol formation in the boreal forest (BIOFOR), Tellus 53B, 324–343, 2001.
Lamanna, M. S. and Goldstein, A. H.: In situ measurements of C2-C10 volatile organic com-pounds above a Sierra Nevada ponderosa pine plantation, J. Geophys. Res., 104, 21 247–
30
21 262, 1999.
Lindinger, W., Hansel, A., and Jordan, A.: On-line monitoring of volatile organic compounds at pptv levels by means of Proton-Transfer-Reaction Mass Spectrometry (PTR-MS) Medical
ACPD
4, 3835–3873, 2004
Detection of organic gases in the boreal
forest K. Sellegri et al. Title Page Abstract Introduction Conclusions References Tables Figures J I J I Back Close
Full Screen / Esc
Print Version Interactive Discussion
© EGU 2004
applications, food control and environmental research, Int. J. Mass Spect. Ion Processes, 173, 191–241, 1998.
O’Brien, J. M., Shepson, P. B., Wu, Q., Biesenthal, T., Bottenheim, J. W., Wiebe, H. A., Anlauf, K. G., and Brickell, P.: Production and distribution of organic nitrates, and their relationship to carbonyl compounds in an urban environment, Atmos. Environ., 31, 2059–2069, 1997.
5
P ¨oschl, U., Williams, J., Hoor, P., Fischer, H., Crutzen, P. J., Warneke, C., Holzinger, R., Hansel, A., Jordan, A., Lindinger, W., Scheeren, H. A., Peters, W., and Lelieveld, J.: High Acetone concentrations throughout the 0–12 km altitude range over the tropical rain forest in Surinam, J. Atmos. Chem., 38, 115–132, 2001.
Reiner, T., Sprung, D., Jost, C., Gabriel, R., Mayol-Bracero, O. L., Andreae, M. O., Campos, T.
10
L., and Shetter, R. E.: Chemical characterization of pollution layers over the tropical Indian Ocean: signatures of emissions from biomass and fossil fuel burning, J. Geophys. Res., 106, 28 497–28 510, 2001.
Schoon, N., Amelynck, C., Vereecken, L., and Arijs Schoon, E.: A selected ion flow tube study of the reactions of H3O+, NO+and O+2 with a series of Monoterpenes, 229, 231–240, 2003.
15
Schr ¨oder, D., Soldi-Lose, H., Semialjac, M., Loos, J., Schwarz, H., Eerdekens, G., and Arnold, F.: On gaseous C4H6O2 compounds in the atmosphere: new insights from collision in the laboratory and on aircraft, Int. J. of Mass Spectr., 228, 35–47, 2003.
Seinfeld, J. H. and Pandis, S. N.: Atmospheric chemistry and physics, John Wiley and sons, New York, 1998.
20
Sellegri, K., Hanke, M., Umann, B., and Arnold, F.: Measurements of Organic Gases during Aerosol Formation Events in the Boreal Forest Atmosphere during QUEST, Atmos. Chem. Phys. Discuss., accepted, 2004.
Singh, H. B., O’Hara, D., Herlth, D., Sachse, W., Blake, D. R., Bradshaw, J. D., Kanakidou, M., and Crutzen, P. J.: Acetone in the atmosphere: distribution, sources and sinks, J. Geophys.
25
Res., 99, 1805–1819, 1994.
Singh, H. B., Kanakidou, M., Crutzen, P. J., and Jacob, D. J.: High concentrations and pho-tochemical fate of oxygenated hydrocarbons in the global troposphere, Nature, 378, 50–54, 1995.
Spanke, J., Rannik, U., Forkel, R., Nigge, W., and Hoffman, T.: Emission fluxes and
atmo-30
spheric degradation of Monoterpenes above a boreal forest: field measurements and mod-eling, Tellus, 53B, 406–422, 2001.
ACPD
4, 3835–3873, 2004
Detection of organic gases in the boreal
forest K. Sellegri et al. Title Page Abstract Introduction Conclusions References Tables Figures J I J I Back Close
Full Screen / Esc
Print Version Interactive Discussion
© EGU 2004
secondary atmospheric photooxidation products: Evidence for biogenic and anthropogenic sources, J. Geophys. Res., 108, D8, 2003.
Spirig, C., Guenther, A., Greenberg, J. P., Calanca, P., and Tarvainen, V.: Tethered balloon measurements of volatile organic compounds at a boreal forest site, Atmos. Chem. Phys. Discuss., 3, 5357–5397, 2003.
5
Viggiano, A. A., Dale, F., and Paulson, J. F.: Proton transfer reactions of H+(H2O)n=2-11 with Methanol, ammonia, pyridine, Acetonitrile and Acetone, J. Chem. Phys., 88, 2469–2477, 1988.
Warneke, C., Holzinger, R., Hansel, A., Jordan, A., Lindinger, W., P ¨oschl, U., Williams, J., Hoor, P., Fisher, H., Crutzen, P. J., Sheeren, H. A., and Lelieveld, J.: Isoprene and its
oxida-10
tion products Methyl Vinyl Ketone, Methacrolein, and Isoprene related peroxides mesaured online over the tropical rain forest of Surinam in March 1998, J. Atmos. Chem., 38, 167–185, 2001.
Williams, J., Fisher, H., Harris, G. W., Crutzen, P. J., Hoor, P., Hansel, A., Holzinger, R., Warneke, C., Lindinger, W., Scheeren, B., and Lelieveld, J.: Variability-lifetime relationship
15
for organic trace gases: a novel aid to compound identification and estimation of OH con-centrations, J. Geophys. Res., 105, 20 473–20 486, 2000.
Wisthaler, A., Jensen, N. R., Winterhalter, R., Lindinger, W., and Hjorth, J.: Measurements of Acetone and other gas phase product yields from the OH-initiated oxidation of terpenes by proton-transfer-reaction mass spectrometry (PTR-MS), Atmos. Environ.,35, 6181–6191,
20
2001.
Wohlfrom, K.-H., Hauler, T., Arnold, F., and Singh, H.: Acetone in the free troposphere and the lower stratosphere: aircraft-based CIMS and GC measurements over the North Atlantic and a first comparison, Geophys. Res. Lett., 26, 2849–2852, 1999.
Yu, J., Griffin, R. J., Cocker III, D. R., Flagan, R. C., and Seinfeld, J. H.: Observation of gaseous
25
and particulate products of monoterpene oxidation in forest atmospheres, Geophys. Res. Lett., 26, 1145–1148, 1999a.
Yu, J., Cocker III, D. R., Griffin, R. J., Flagan, R. C., and Seinfeld, J. H.: Gas-phase ozone oxidation of Monoterpenes: gaseous and particulate products, J. Atmos. Chem., 34, 207– 258, 1999b.
ACPD
4, 3835–3873, 2004
Detection of organic gases in the boreal
forest K. Sellegri et al. Title Page Abstract Introduction Conclusions References Tables Figures J I J I Back Close
Full Screen / Esc
Print Version Interactive Discussion
© EGU 2004
Table 1. Monitored mass numbers of ions X, sorted by hydrate families in the form of HX+(H2O)n. between brackets are the ions which peaks have not always been correctly sepa-rated from the reactant peaks. Underlined are the masses for which the count rate was maxi-mum within the peak family.
Core ion HX+ HX+ HX+ HX+ HX+ HX+ HX+ HX+ HX+ (H2O) (H2O)2 (H2O)3 (H2O)4 (H2O)5 (H2O)6 (H2O)7 (H2O)8 18 36 54 (72) (90) (108) 126 144 162 19 37 55 73 91 109 127 145 163 33 51 69 87 105 123 141 159 177 42 60 78 96 114 132 150 168 186 45 63 81 99 117 135 153 171 189 46 64 82 100 118 136 154 172 47 65 83 101 119 137 155 173 49 67 85 103 121 139 157 175 59 77 95 113 131 149 167 185 61 79 97 115 133 151 169 187 71 89 107 125 143 161 179
ACPD
4, 3835–3873, 2004
Detection of organic gases in the boreal
forest K. Sellegri et al. Title Page Abstract Introduction Conclusions References Tables Figures J I J I Back Close
Full Screen / Esc
Print Version Interactive Discussion
© EGU 2004
Table 2. Some chemical and physical properties of measured compounds; sulfuric acid and
NH3 properties are also indicated for comparison. Ref: Handbook of Chemistry and Physics for proton affinities, Life time order of magnitude: Williams et al., 2000 for Acetone, Acetonitrile, Acetaldehyde, Isoprene, methanol, using OH=5 105molecules cm−3 and Atkinson 1994 for pinene, MVK and MACR using OH=1 106
molecules cm−3and ozone=40 ppbv.
Molecular Proton Order magnitude Compound Mass affinity Structure Life time
Number kcal mol−1 (/OH+hν)
Acetone 58 188 CH3COCH3 1 month
Acetonitrile 41 186 CH3CN 3 years
Acetaldehyde 44 185 CH3CHO 1 day
Isoprene 68 197 CH2=C(CH3)CH=CH2 6 h
Methanol 32 180 CH3OH 1 month
DMA 45 218–225 CH3-NH-CH3 –
TMA 59 222–230 CH3-N(CH3)-CH3 –
Ethanol 46 185.5 CH3CH2OH –
Formic acid 46 178 CH3-COOH –
Propanol 60 189.4 CH3-CH2-CH2OH –
Acetic acid 60 188 CH3-CH2-COOH –
Pinonaldehyde 168 – C10H16O2 –
Methyl Vinyl CH2=CH-CO-CH3/ vsOH=15/8 h
Ketone/ 70 199/193 CH2=C(CH3)-CH=O vsO3=62/248 h Methacrolein α-pinene/ 136 – C10H16 vsOH=5/3.5 h β-pinene vsO3=3/19 h Cis-3-hexenyl 142 – C8H14O2 – Acetate
ACPD
4, 3835–3873, 2004
Detection of organic gases in the boreal
forest K. Sellegri et al. Title Page Abstract Introduction Conclusions References Tables Figures J I J I Back Close
Full Screen / Esc
Print Version Interactive Discussion
© EGU 2004
Table 3. Masses taken into account for MR calculation.
Acetone Acetonitrile Acetal TMA DMA Methanol Ethanol/ formic acid Masses 59; 77; 95; 42; 60; 78; 45; 63; 96-min(96, 96calc) 46; 64; 51; 69; 87 47; 65; 83
(amu) 113; 131 min(96, 96calc); 81 114-min(114, 114calc) 82; 100 101; 119
min(114, 114calc) 132
Propanol/ Isoprene MVK/MACR Monoterpenes Pinonaldehyde Cis-3-hexenyl Acetic Acid (70) (136) (168) Acetate (142) Masses 61; 79; 105; 123; 71; 89; 107 137; 155 169; 187 143; 161;
ACPD
4, 3835–3873, 2004
Detection of organic gases in the boreal
forest K. Sellegri et al. Title Page Abstract Introduction Conclusions References Tables Figures J I J I Back Close
Full Screen / Esc
Print Version Interactive Discussion
© EGU 2004
Table 4. Detection limits calculated as twice the standard deviation of zero air level, and
statis-tics on mixing ratios over the 2-weeks measurements.
Ethanol/ Propanol/ (ppt) Acetone Acetonitrile Acetaldehyde TMA DMA Methanol Formic Acetic
Acid Acid Zero air level 47 7.1 5.6 8.1 29.5 8.8 26.5 36.5
Detection limit 35 4.0 6.6 6.2 32.4 8.6 11 18 Mean 1495 75 36 59 12.2 334 318 107 Stdev 596 33 31 35.5 7.7 143 926 104 25ile 1091 51 15 34 7 229 73 34 75ile 1655 97 50 79 17 424 259 146 median 1370 66 33 55 12 330 135 85
Isoprene MVK/MACR Monoterpenes Pinonaldehyde Cis-3-hexenyl (70) (136) (168) Acetate (142) Zero air level 28.0 41 181 288 477
Detection limit (ppt) 12.0 11.6 87 86 106 Mean 140 185 301 603 228 Stdev 73 125 139 345 134 25ile 88 104 192 323 133 75ile 185 237 401 839 295 median 120 165 300 605 198