HAL Id: hal-00304939
https://hal.archives-ouvertes.fr/hal-00304939
Submitted on 1 Jan 2004HAL is a multi-disciplinary open access archive for the deposit and dissemination of sci-entific research documents, whether they are pub-lished or not. The documents may come from teaching and research institutions in France or abroad, or from public or private research centers.
L’archive ouverte pluridisciplinaire HAL, est destinée au dépôt et à la diffusion de documents scientifiques de niveau recherche, publiés ou non, émanant des établissements d’enseignement et de recherche français ou étrangers, des laboratoires publics ou privés.
quality: the Afon Hafren, mid-Wales
C. Neal, B. Reynolds, M. Neal, H. Wickham, L. Hill, B. Williams
To cite this version:
C. Neal, B. Reynolds, M. Neal, H. Wickham, L. Hill, et al.. The impact of conifer harvesting on stream water quality: the Afon Hafren, mid-Wales. Hydrology and Earth System Sciences Discussions, European Geosciences Union, 2004, 8 (3), pp.503-520. �hal-00304939�
The impact of conifer harvesting on stream water quality: the
Afon Hafren, mid-Wales
Colin Neal
1, Brian Reynolds
2, Margaret Neal
1, Heather Wickham
1, Linda Hill
1and
Bronwen Williams
21Centre for Ecology and Hydrology, Wallingford, OXON, OX10 8BB, UK
2Centre for Ecology and Hydrology, University of Wales Bangor, Deniol Road, Bangor, Gwynedd, LL57 2UP, UK
Email for corresponding author: cn@ceh.ac.uk
Abstract
Results for long term water quality monitoring are described for the headwaters of the principal headwater stream of the River Severn, the Afon Hafren. The results are linked to within-catchment information to describe the influence of conifer harvesting on stream and shallow groundwater quality. A 19-year record of water quality data for the Hafren (a partially spruce forested catchment with podzolic soil) shows the classic patterns of hydrochemical change in relation to concentration and flow responses for upland forested systems. Progressive felling of almost two-thirds of the forest over the period of study resulted in little impact from harvesting and replanting in relation to stream water quality. However, at the local scale, a six years study of felling indicated significant release of nitrate into both surface and groundwater; this persisted for two or three years before declining. The study has shown two important features. Firstly, phased felling has led to minimal impacts on stream water. This contrasts with the results of an experimental clear fell for the adjacent catchment of the Afon Hore where a distinct water quality deterioration was observed for a few years. Secondly, there are localised zones with varying hydrology that link to groundwater sources with fracture flow properties. This variability makes extrapolation to the catchment scale difficult without very extensive monitoring. The implications of these findings are discussed in relation to strong support for the use of phased felling-based management of catchments and the complexities of within catchment processes.
Keywords: deforestation, water quality, acidification, pH, nitrate, alkalinity, ANC, aluminium, dissolved organic carbon, Plynlimon, forest,
spruce, Afon Hafren, podzol
Introduction
Over the past decade there have been major inroads into describing the impacts of forestry management of conifer plantations on stream water quality, particularly with regards to harvesting and replanting. Within this work, a major study has been based on the Plynlimon catchments in mid-Wales and a major phase of harvesting of conifer plantation of the Hafren Forest. These catchments comprise much of the headwater region of the upper River Severn (Reynolds et
al., 1995; Neal, 1997, 2002; Neal et al., 1992a,b, 1997a,b,c,
2003). They, together with the Beddgelert catchments in north Wales (Stevens and Hornung, 1988, 1990; Stevens et
al., 1988) are the main locations in upland Wales for
long-term catchment research on forestry issues by the Centre of Ecology and Hydrology. In previous reports, the main
descriptions of the impacts of deforestation have been for the Afon Hore where Forestry Commission and Forest Enterprise allowed an experimental fell of most of the catchment over just a few years to allow an assessment of the extent to which felling can affect stream water quality. This type of felling contrasts with the more standard practices of partial felling of forested areas over much longer time frames (5 to 25 years). In the event, the data for the Afon Hore showed deterioration in water quality for a few years after felling and a marked improvement thereafter represents an endmember case to set against normal rotational forestry practice. In 1998, a major study of the impacts of forest harvesting on stream water quality was undertaken by Neal and Reynolds (1998) as part of a joint initiative sponsored by the Natural Environment Research
Council, the Environment Agency of England and Wales, the Forestry Commission and Forest Enterprise for Wales. Within the report and within companion publications in the research community literature (Neal et al., 1998a,b) it was suggested that phased felling might produce minimal environmental impacts, but this was not fully set against long term data for a catchment which had experienced standard rotation forestry practice. Now, much of the Afon Hafren has been felled and it is at this stage that it is relevant to examine what the impacts of standard rotation forestry practice are with respect to phased felling.
In this paper, the effects of phased felling on stream water quality for the Afon Hafren show that there is a major benefit in conventional forestry practice: the result is of major practical relevance to forestry management of conifer plantations. Within the paper, reference is also made to a study begun within the joint initiative mentioned above but for which the full data record was not available within the life of that project. This additional dataset provides information on felling for two small catchments, one a control and the other a manipulated site, on stream and groundwater quality. The paper thus provides information on both large scale and localised variation in stream water quality associated with felling, for a major soil type, peaty podzol, on which plantation forestry has been developed in the UK.
LOCATION, SAMPLING AND CHEMICAL ANALYSIS
The upper River Severn comprises two main tributaries, the Afon Hafren and the Afon Hore, and a smaller tributary, the Nant Tanllwyth that drain a hill top plateau region dominated by acid moorland on deep peat in the upper portion of the catchment (Plumlumon Fawr) and the Hafren Forest. Hafren Forest is mainly Sitka spruce with some Norway spruce, larch and lodge pole pine planted in various phases from the mid-1940s through to the late 1960s. In the harvesting of the Hafren forest, only the tree stem has been removed from site leaving the felling debris (stumps, branches and needles) behind. Across the Hafren, the bedrock comprises fractured Lower Palaeozoic mudstones, shales and grits. Catchment areas on these sites vary from about 50 to 300 ha. The moorland and forest catchments represent a mixture of upland acid soil types dominated by peaty podzol with subsidiary peaty gley and peat. The hydrology, biology and water quality of these sites, and the results of the research have been described earlier and sampling locations plus the various types of monitoring sites are described by Neal and Kirchner (2000). Within this study, the details of the stream and groundwater quality are provided for the Afon Hafren catchment and the details of the locations are as follows.
The Afon Hafren
The Afon Hafren is the main tributary of the upper river Severn. Originally, only the lower part of the Afon Hafren was monitored and this is one of the long-term Plynlimon sites (19 years of weekly records). The Hafren has moorland drainage for the top half of the catchment combined with afforested areas in the lower half of the catchment. Soils in this area are largely podzolic. Some localised felling has taken place over many years to thin and, in some cases, harvest small areas of the crop. The outcome of this progressive fell is that over 50% of the lower Hafren has been either felled or is in the process of regrowth with second generation spruce plantation forestry. The upper Afon Hafren, the moorland part of the catchment, has been monitored since July 1990. For both sites monitoring is continuing. Within this paper, the lower Hafren site is simply referred to as the Afon Hafren site.
Paired catchment study
These sites are afforested with podzolic soils that comprise two small drainage areas (2 to 4 ha) towards the bottom end of the upper River Severn, just downstream of the confluence of the Afon Hafren and the Afon Hore. Fortnightly monitoring of both surface and groundwaters began in October-November 1994. One of the paired catchments was clear-felled in September to October 1995: it is referred to here as the response (experimental) site. For the other catchment, the control site, no felling was undertaken. Monitoring of the response site continued up to spring 2001 but monitoring of the control site was discontinued in April 1999 due to lack of management support. In addition, a borehole (HA04) near the felled site where monitoring has progressed on a longer time frame and which provides a remarkably clear response to felling. For this borehole, weekly sampling took place between April 1994 and February 2001.
HAFREN FELLING REGIME
Within the Hafren forest as a whole, felling has been continued since 1980 at an average of 17 ha yr1 with a
range of 0 to 60 ha yr1. Here, the Hafren forest includes the
Afon Hafren and Afon Hore as well as the Nant Tanllwyth. In the case of the Hore, the main phase of felling was between 1985 and 1989 as this represented an experimental fell to show what the maximum effects of felling on stream water chemistry might be. For the Afon Hafren, the felling was much more uniform and presently about 62% of the forested part of the catchment has been felled. The main felling years for the Afon Hafren catchment were 1981, 86, 88, 94, 95, 96, 97 and 98.
SAMPLING AND ANALYSIS
Water samples were filtered in the field and stored in sealed bottles in the dark at 4oC, in some cases with preservative,
to avoid sample deterioration. A wide range of chemical analyses was undertaken to determine major, minor, and trace elements as well as nutrients and major water quality determinands such as pH, electrical conductivity and Gran alkalinity. The sampling, filtration and analytical chemistry methodologies are described by Neal et al. (1997a).
Results and discussion
The results for the Afon Hafren and the paired catchments are described separately because they show different features and cover different sampling periods. Within this results and discussion section, the effects of felling are described in relation to the findings from earlier studies and these findings are linked to the salient processes operative.
AFON HAFREN
The water quality of the Afon Hafren, like the other streams in the area, is linked primarily to the chemistry of the atmospheric inputs and the physical attenuation and chemical reaction of the rainfall as it passes through the catchment. Before dealing with the effects of felling in the Afon Hafren catchment, the main features that characterise the water quality variations in the Afon Hafren are described to place the felling in a general hydrological and hydrochemical context (Neal et al., 1997a, 2001).
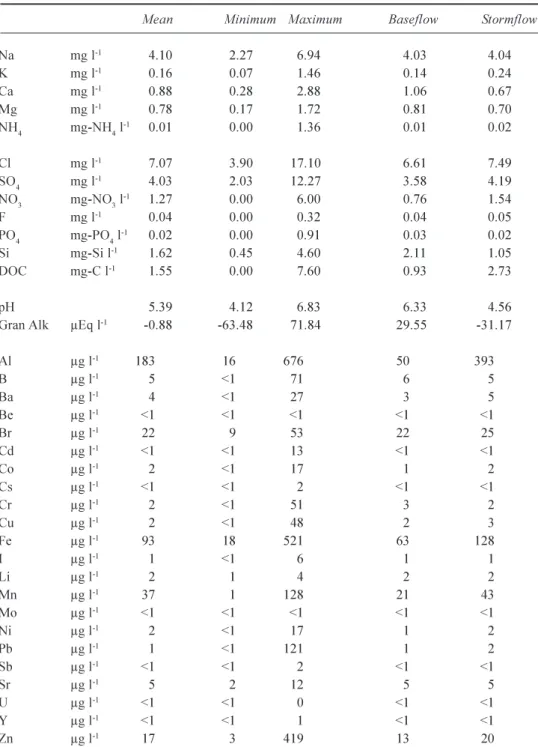
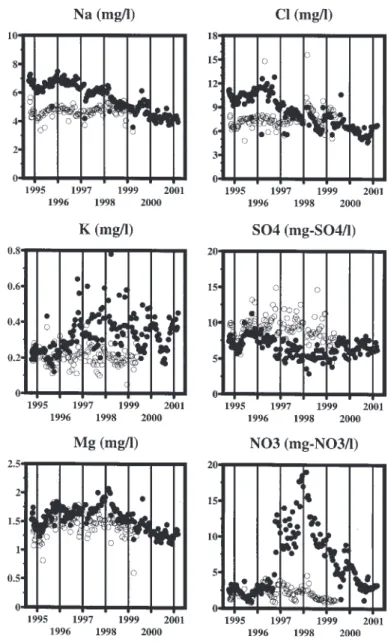
Data summaries of the water quality of the Afon Hafren are provided in Table 1 with representative time series in Figs. 1, 2a and 2b.
WATER QUALITY VARIATION ASSOCIATED WITH HYDROLOGICAL AND WATER MIXING CONTROLS
Atmospheric inputs are of particular importance for Na and Cl owing to the maritime influence on the rainfall chemistry and the lack of major within-catchment supplies. However, the variations in sodium and chloride in the streams is small, relative to the rainfall and this reflects the hydrological attenuation of the rainfall signal within the catchment. This is illustrated in Fig. 1 where time series are constructed for chloride concentrations in rainfall and Afon Hafren stream water where rainfall concentrations vary between 0 and 40 mg l1 while stream water concentrations vary typically
between 5 and 12 mg l1. The physical attenuation of the
sodium and chloride signal is a complex affair in that the damping is associated with complex hydrological routing involving macro porous transport and a wide distribution
of residence times: in the case of sodium, there is also a cation exchange process which damps the signal further (Neal and Kirchner, 2001). Atmospheric inputs are of varying importance for the major cations and the extent of the importance is linked to the availability and reactivity of these components within the catchment. Of particular importance to the chemical input is sulphate which impinges on the catchment mainly as dry/mist deposited pollutant inputs and in rainfall/mist from maritime sources. Within the catchment, damping occurs for sulphate as for sodium and chloride, but there may be further damping because of anion exchange between sulphate and soil particles (Neal
et al., 2001). The rainfall signal is not always damped within
the Afon Hafren. This is most clearly observed for chromium where both rainfall and stream water concentrations increased markedly during the mid-to-late 1980s with subsequent decline in the stream at least (rainfall spikes for chromium continued due to an input from other sources and species of chromium which were sorbed by the soil: Neal et
al., 1996). However, there are also clear long term cyclical
patterns in rainfall and the streams for some transition metals (Robson and Neal, 1996). Figure 1 provides time series for zinc concentrations in rainfall and Afon Hafren water. The plots show increased concentrations in rainfall in the mid-1980s and early to mid-1990s, while the corresponding changes for the Afon Hafren occur within the mid-1980s and from 1994 onwards.
The stream response to rainfall is not always damped as large fluctuations in many chemical species occur in the stream to hydrological variations (Table 1, Figure 3). Indeed, there is a great regularity in the changes in concentration and flow for many determinands. In particular, baseflow has higher calcium and silicon concentrations, alkalinity and pH than stormflow, while stormflow waters have higher aluminium and transition metal concentrations as well as lower pH than their baseflow counterparts. The patterns of change vary non-linearly with flow and the changes reflect the contrasting hydrochemical endmember environments in the soil and the groundwater zones. The soil matrix has an acidic character and it is rich in organic matter and aluminium oxide/hydroxide compounds but relatively depleted in divalent base cations such as calcium and magnesium. The waters in the soil zone are thus base-poor, organic-rich, aluminium and transition metal bearing. They are also of low pH, negative Gran alkalinity and negative ANC. The aquifer is dominated by fracture flow and the rock is calcium and magnesium rich. Soil water inputs react with the rock to produce bicarbonate bearing groundwater of low acidity: the low acidity also results in the precipitation of the easily hydrolysable transition metals and aluminium. Groundwater usually comprises a calcium bicarbonate water
Table 1. A summary of water quality for the Afon Hafren. The baseflow and stormflow values
correspond to the average concentration for the bottom ten and top ten percent of flow, respectively. The data cover the period May 1983 to December 2002 inclusive.
Mean Minimum Maximum Baseflow Stormflow
Na mg l-1 4.10 2.27 6.94 4.03 4.04 K mg l-1 0.16 0.07 1.46 0.14 0.24 Ca mg l-1 0.88 0.28 2.88 1.06 0.67 Mg mg l-1 0.780.17 1.72 0.81 0.70 NH4 mg-NH4 l-1 0.01 0.00 1.36 0.01 0.02 Cl mg l-1 7.07 3.90 17.10 6.61 7.49 SO4 mg l-1 4.03 2.03 12.27 3.584.19 NO3 mg-NO3 l-1 1.27 0.00 6.00 0.76 1.54 F mg l-1 0.04 0.00 0.32 0.04 0.05 PO4 mg-PO4 l-1 0.02 0.00 0.91 0.03 0.02 Si mg-Si l-1 1.62 0.45 4.60 2.11 1.05 DOC mg-C l-1 1.55 0.00 7.60 0.93 2.73 pH 5.39 4.12 6.83 6.33 4.56 Gran Alk µEq l-1 -0.88 -63.48 71.84 29.55 -31.17
Al µg l-1 183 16 676 50 393 B µg l-1 5 <1 71 6 5 Ba µg l-1 4 <1 27 3 5 Be µg l-1 <1 <1 <1 <1 <1 Br µg l-1 22 9 53 22 25 Cd µg l-1 <1 <1 13 <1 <1 Co µg l-1 2 <1 17 1 2 Cs µg l-1 <1 <1 2 <1 <1 Cr µg l-1 2 <1 51 3 2 Cu µg l-1 2 <1 48 2 3 Fe µg l-1 93 18521 63 128 I µg l-1 1 <1 6 1 1 Li µg l-1 2 1 4 2 2 Mn µg l-1 37 1 12821 43 Mo µg l-1 <1 <1 <1 <1 <1 Ni µg l-1 2 <1 17 1 2 Pb µg l-1 1 <1 121 1 2 Sb µg l-1 <1 <1 2 <1 <1 Sr µg l-1 5 2 12 5 5 U µg l-1 <1 <1 0 <1 <1 Y µg l-1 <1 <1 1 <1 <1 Zn µg l-1 17 3 419 13 20
type of positive Gran alkalinity/ANC: it is enriched in carbon dioxide due to respiratory processes and the breakdown of dissolved and particulate organic carbon (Neal et al., 1997b,c). Under baseflow conditions, water drains mainly from the groundwater zone while under stormflow conditions, a greater proportion of the water comes from the soil. Ground and soil water components mix both within the catchment as fracture flow as well as within the streams
and this leads to the dynamic patterns of behaviour observed in the streams for many components (Neal and Christophersen, 1989; Neal et al., 1990; Hill and Neal, 1997). The relationships vary with flow non-linearly with the greatest changes occurring at low/intermediate flows and near constant values at higher flows (Fig. 2). However, a few components such as aluminium and manganese show the highest values at intermediate flows. This reflects a
Fig. 1. Time series for chloride and zinc in rainfall and Afon Hafren water. Note that the scales are different for each determinand as the
variation in rainfall is greater than that for the stream.
subdivision of the soil water component entering the stream, where at particularly high flows water is also derived from the upper organic rich soils where there are limited supplies of inorganic minerals and many trace metals are bound to organic surfaces (Reynolds et al., 1988, 1992).
Superimposed on this behaviour are two other patterns. Firstly, there are patterns which are very much associated with the nutrients nitrate, bromine, iodine and boron as primarily linked to the biological functioning of the catchment. Secondly, there are decadal term patterns for components such as the sea-salts, sulphate and heavy metals such as zinc (Fig. 1, 2a and 2b) are probably linked to changing atmospheric loadings as influenced by changing weather patterns.
THE INFLUENCE OF PHASED FELLING ON STREAM WATER QUALITY
The major response to felling as shown in many studies is threefold (Neal and Reynolds, 1998; Neal et al., 2003). Firstly, there is an increase in nitrate with possible increases in dissolved organic carbon (DOC), K, Al and acidity (i.e. lower pH and lower Gran alkalinity). Secondly, there is a decrease in sea-salt components such as sodium and chloride derived from atmospheric sources, due to reduced evaporation (greater runoff increasing dilution) and reduced scavenging of mist and particles from the atmosphere by the trees. Thirdly, the perturbations in water quality associated with felling recede after a few years as nitrate
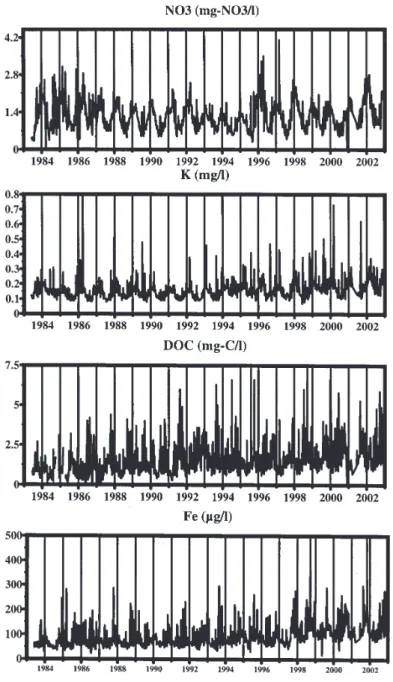
Fig. 2a. Afon Hafren water quality time series for nitrate, potassium, dissolved organic carbon and iron.
uptake by tree re-establishment and growth increases and the concentrations of the major acid-anions decrease. Indeed, this can even lead to water quality better than before the trees are felled (Neal and Reynolds, 1998).
To show what actually happens for the Afon Hafren, time series of concentrations are shown in Fig. 3a and 3b for the relevant species that would be expected to change (Fig. 1 also provides a time series for chloride). The salient features are as follows.
Nitrate
There are seasonal oscillations in nitrate concentration and year to year variations in the magnitude of these oscillations.
The highest concentrations of nitrate occurred during the earlier part of the record (19831986) and around 1986. However, there are no clear trends to the data and the peak concentrations, for 1986, at least, were observed across all moorland, forested and previously felled sites in the Plynlimon area (Neal et al., 2001). Thus, there is no clear evidence of a systematic change associated with felling. Further, this pattern of change is not confined to the Plynlimon area, but includes surface acidification monitoring sites across the UK. It has been proposed that national changes are related to climatic variations associated with factors such as the variability in the North Atlantic Oscillation (Monteith et al., 2000).
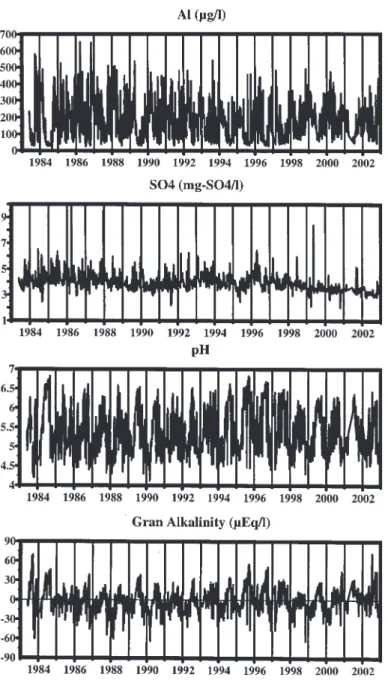
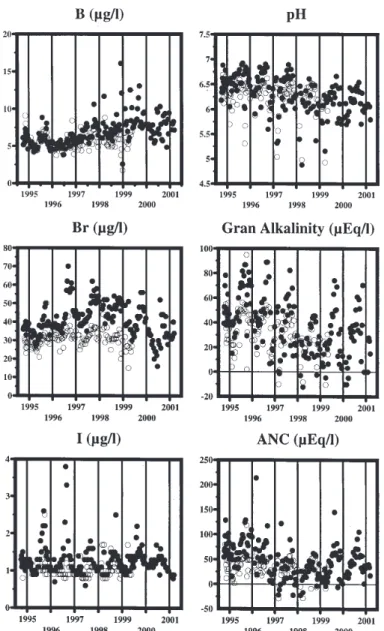
Fig. 2b. Afon Hafren water quality time series for aluminium, sulphate, pH and Gran Alkalinity.
Sodium and chloride
There are no clear changes over time other than occasional peaks that occur irregularly due to higher input fluxes from maritime sources. The patterns observed at Plynlimon are observed across upland UK and they seem to be climate-driven fitting well with the fluctuation of the North Atlantic Oscillation, which strongly influences winter precipitation and temperature patterns in regions bordering the North Atlantic (Evans et al., 2001).
pH, Gran alkalinity and ANC
There is no clear change in the acidity of the stream waters. Rather, a high variation is associated with short-term
hydrological change that dominates the patterns observed.
Dissolved organic carbon and iron
There is an approximate linear increase over time. The levels of change can be most easily gauged by comparing mean and median values for periods early and late within the record. For example, in the case of iron, the mean values (corresponding median values in bracket) for 198486 are 74 mg l1 (61 mg l1) while the corresponding value for 2000
2002 is 133 mg l1 (116 mg l1). The corresponding figures
for DOC are 1.12 mg-C l1 (0.90 mg-C l1) and 2.06 mg-C l1
(1.76 mg-C l1). Figures in both cases correspond to a near
Fig. 3. The relationship between the concentrations of calcium, manganese, silicon, aluminium, pH and Gran Alkalinity with flow for the Afon Hafren.
related to the DOC concentration (with the difference in the intercept not being statistically significant from zero): Fe (mg l1) = 37±2*DOC (mg-C l1) + 36±63, r2 = 0.583, N=
1032. This occurs because the iron is primarily in solution complexed to the DOC. The increase in DOC has been observed across many catchments in the UK including other sites in the Plynlimon area (Monteith and Evans, 2000; Neal
et al., 2001, 2004). As these increases occur for both
moorland and forested systems, the patterns are not unique for felled systems and the changes may reflect a climate-induced signal.
Potassium
There is a small increase in potassium concentration through the study period. This may well be a result of felling effects
linked to release of potassium from the biomass with felling and lack of uptake from the redeveloping biomass. However, the change is relatively small (the average concentration through the first three years of record is about 0.17 mg l1,
while through the last three years of record is about 0.21 mg l1, an average time difference of some 18 years)
and there is a high degree of scatter to the data.
So, the evidence presented here indicates no significant felling effects that translate to water quality change in the Hafren catchment: this result differs from those of most other studies. Rather, changes are essentially associated with climate variability.
PAIRED CATCHMENTS
The establishment of control and response sites in the Hafren catchment proved problematic: it was only after survey and monitoring of four adjacent sites that two were chosen. The differences were remarkable, even though the catchments were of similar slope aspect and tree coverage, the stream waters varied in their chemistry into two distinct groups, one with an average pH of around 5 and an average Gran alkalinity around zero while the other group had a pH averaging 6.2 with a Gran alkalinity of around 32 mEq l1.
In the end, the sites with the most similar chemistries were chosen, the large degree of chemical variation from site to site at the local scale reflects local heterogeneities in the catchments and differences in the proportions of groundwater supplied to the stream (Hill and Neal, 1997). This is particularly seen in the groundwaters (Neal et al., 1997b,c) and it proved impossible to provide a paired set. This final point is made specifically to avoid bias towards uniformity in the literature: the systems under study are actually highly heterogeneous (Neal, 1997, 2002b).
WATER QUALITY RESULTS FOR THE PAIRED STREAMS
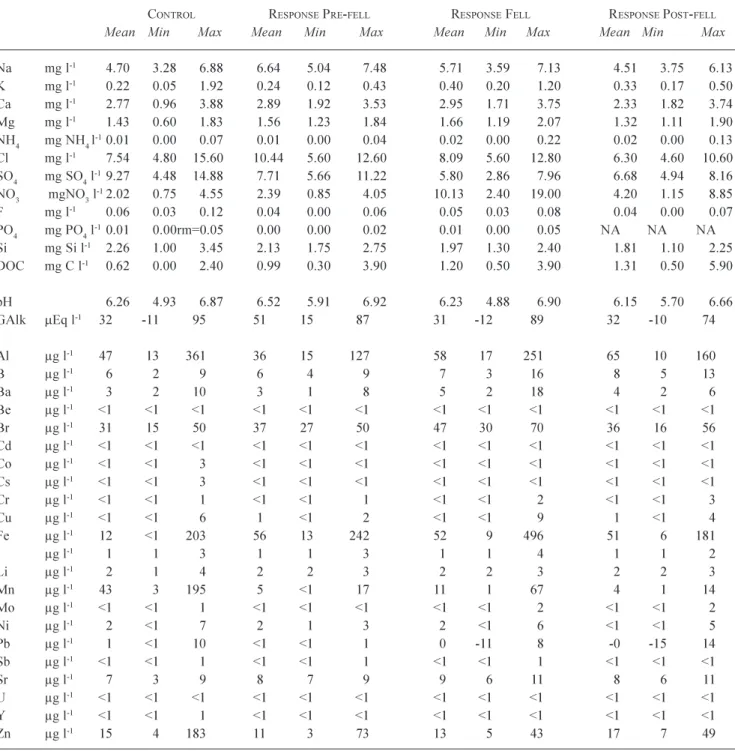
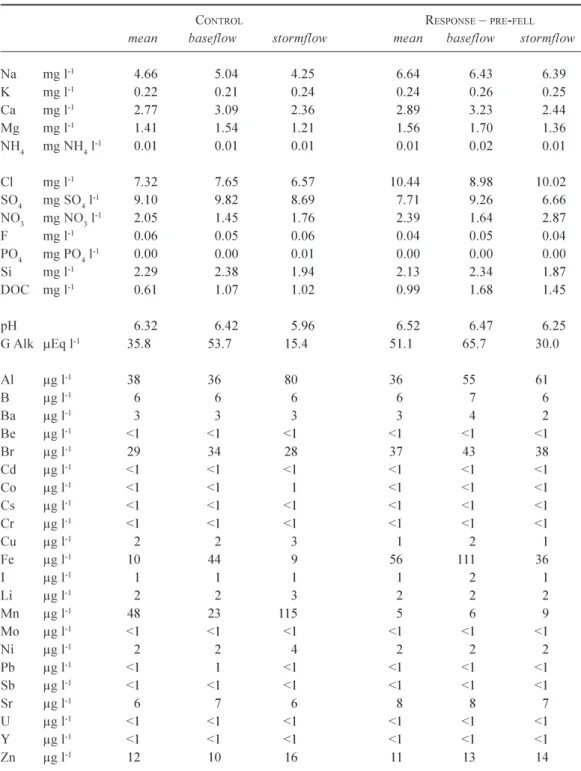
The water quality data for the control and response sites are in Tables 2 and 3. Table 2 provides a statistical summary with the information for the response site subdivided into three groups covering pre-fell, fell (the time from initial fell to two years on from fell) and thereafter (post-fell); some distinct changes in water quality are linked with felling and with subsequent recovery. The nature and extent of the variations are illustrated in Figs. 4a and 4b. Table 3 illustrates the influence of flow on stream water quality. For this table, information prior to felling for the control and the response sites is presented; clearly other effects complicate the issues for the felled site after felling. With respect to the flow responses, flows have been gauged using hydrological information from the lower Hafren flume. While there is no direct measurement for the control and response streams, the rapidity of the flow response means that the relative changes in flow and timing for the main and control and response streams will be similar (on a flow per unit area basis). The salient features of the data are summarised as follows.
l Prior to felling, the control and response streams show
similar chemistries, except for sodium and chloride where concentrations are about 50% higher in the response stream.
l As for the main streams, there is a marked variation in
chemistry as a function of flow for the control and the
response stream. The waters become more acidic and aluminium bearing during stormflow conditions, while at baseflow the waters are enriched in calcium and magnesium with a higher pH and Gran alkalinity as befits the relative changes in input of soil and groundwater.
l There seem to be some systematic temporal changes
for pH and Gran alkalinity, which decrease over time, and for boron which increases over time for the control and response sites. These changes are presumably associated with climatic/hydrological factors not linked to the felling activity.
l There is a large increase in nitrate concentration with
felling where concentrations increase from about 3 mg-NO3 l1 to around 15 mg-NO3 l1before declining
progressively to pre-fell levels when monitoring ceased. This pattern is similar to that found for other catchment sites in Wales (Neal et al., 1998a,b).
l Increases in potassium and bromine with felling are
associated with the breakdown of organic matter with insufficient biological uptake; similar behaviour has been observed within the Plynlimon area (Neal et al., 1992a,b).
l A gradual reduction in sodium and chloride for the
response site during and post-felling has been observed for other small streams in the Plynlimon area (Neal et
al., 1998a). The concentrations of sodium and chloride
have reduced by about a third from the time of fell to the end of the monitoring period four years later.
l For the response stream, pH and Gran alkalinity
decrease and aluminium concentrations increase with felling. However, the changes are matched by similar changes in the control. In an earlier study, Neal et al. (1998a) showed that, at the response site, there was some acidification associated with felling as post-felling the waters were of lower Gran alkalinity for a given flow, while for the control there was no such separation. Undertaking a similar analysis of Gran alkalinity, Neal
et al. (1998) revealed the same pattern for the full
dataset, but there may be a small reduction in acidity late on during the recovery stage of felling. Such a recovery has been seen for another small catchment in the Plynlimon area (south2Hore, Neal et al., 1994, 2003), but for this study, the relatively high scatter in the response makes patterns hard to define in any clear scientific way.
Thus, in conclusion to this section of the paper, there are some distinct and some less distinct patterns observed for the control and response sites that are characteristic of the general patterns of water quality response observed for other
Table 2. A statistical summary of water quality for control and response sites. Sampling began in October-November 1994. The response
site was clearfelled in September-October 1995. Monitoring of the response and control site continued up to spring 2001 and April 1999, respectively.
CONTROL RESPONSE PRE-FELL RESPONSE FELL RESPONSE POST-FELL
Mean Min Max Mean Min Max Mean Min Max Mean Min Max
Na mg l-1 4.70 3.286.88 6.64 5.04 7.48 5.71 3.59 7.13 4.51 3.75 6.13 K mg l-1 0.22 0.05 1.92 0.24 0.12 0.43 0.40 0.20 1.20 0.33 0.17 0.50 Ca mg l-1 2.77 0.96 3.88 2.89 1.92 3.53 2.95 1.71 3.75 2.33 1.82 3.74 Mg mg l-1 1.43 0.60 1.83 1.56 1.23 1.84 1.66 1.19 2.07 1.32 1.11 1.90 NH4 mg NH4 l-10.01 0.00 0.07 0.01 0.00 0.04 0.02 0.00 0.22 0.02 0.00 0.13 Cl mg l-1 7.54 4.80 15.60 10.44 5.60 12.60 8.09 5.60 12.80 6.30 4.60 10.60 SO4 mg SO4 l-19.27 4.48 14.88 7.71 5.66 11.22 5.80 2.86 7.96 6.68 4.94 8.16 NO3 mgNO3 l-12.02 0.75 4.55 2.39 0.85 4.05 10.13 2.40 19.00 4.20 1.15 8.85 F mg l-1 0.06 0.03 0.12 0.04 0.00 0.06 0.05 0.03 0.080.04 0.00 0.07 PO4 mg PO4 l-10.01 0.00rm=0.05 0.00 0.00 0.02 0.01 0.00 0.05 NA NA NA Si mg Si l-1 2.26 1.00 3.45 2.13 1.75 2.75 1.97 1.30 2.40 1.81 1.10 2.25 DOC mg C l-1 0.62 0.00 2.40 0.99 0.30 3.90 1.20 0.50 3.90 1.31 0.50 5.90 pH 6.26 4.93 6.87 6.52 5.91 6.92 6.23 4.88 6.90 6.15 5.70 6.66 GAlk mEq l-1 32 -11 95 51 15 87 31 -12 89 32 -10 74 Al µg l-1 47 13 361 36 15 127 5817 251 65 10 160 B µg l-1 6 2 9 6 4 9 7 3 16 8 5 13 Ba µg l-1 3 2 10 3 1 8 5 2 18 4 2 6 Be µg l-1 <1 <1 <1 <1 <1 <1 <1 <1 <1 <1 <1 <1 Br µg l-1 31 15 50 37 27 50 47 30 70 36 16 56 Cd µg l-1 <1 <1 <1 <1 <1 <1 <1 <1 <1 <1 <1 <1 Co µg l-1 <1 <1 3 <1 <1 <1 <1 <1 <1 <1 <1 <1 Cs µg l-1 <1 <1 3 <1 <1 <1 <1 <1 <1 <1 <1 <1 Cr µg l-1 <1 <1 1 <1 <1 1 <1 <1 2 <1 <1 3 Cu µg l-1 <1 <1 6 1 <1 2 <1 <1 9 1 <1 4 Fe µg l-1 12 <1 203 56 13 242 52 9 496 51 6 181 I µg l-1 1 1 3 1 1 3 1 1 4 1 1 2 Li µg l-1 2 1 4 2 2 3 2 2 3 2 2 3 Mn µg l-1 43 3 195 5 <1 17 11 1 67 4 1 14 Mo µg l-1 <1 <1 1 <1 <1 <1 <1 <1 2 <1 <1 2 Ni µg l-1 2 <1 7 2 1 3 2 <1 6 <1 <1 5 Pb µg l-1 1 <1 10 <1 <1 1 0 -11 8 -0 -15 14 Sb µg l-1 <1 <1 1 <1 <1 1 <1 <1 1 <1 <1 <1 Sr µg l-1 7 3 9 8 7 9 9 6 11 8 6 11 U µg l-1 <1 <1 <1 <1 <1 <1 <1 <1 <1 <1 <1 <1 Y µg l-1 <1 <1 1 <1 <1 <1 <1 <1 <1 <1 <1 <1 Zn µg l-1 15 4 183 11 3 73 13 5 43 17 7 49
clear felled areas. However, these results contrast with the lack of any clearly discernible change in the Afon Hafren response to felling.
GROUNDWATER QUALITY
The paired catchment
The water quality for the groundwaters at the control and
response sites is provided in Table 4. As with the streams, the data are provided as a whole for the control while the data for the response site are subdivided into pre-fell and fell periods (no post-fell data are available corresponding to that for the stream). The salient features are as follows.
l The two sites have similar water quality pre-fell, with
Table 3. A summary of baseflow and stormflow chemistry for control stream and the response stream prior
to felling. Sampling began in October-November 1994. The response site was clearfelled September-October 1995.
CONTROL RESPONSE PRE-FELL
mean baseflow stormflow mean baseflow stormflow
Na mg l-1 4.66 5.04 4.25 6.64 6.43 6.39 K mg l-1 0.22 0.21 0.24 0.24 0.26 0.25 Ca mg l-1 2.77 3.09 2.36 2.89 3.23 2.44 Mg mg l-1 1.41 1.54 1.21 1.56 1.70 1.36 NH4 mg NH4 l-1 0.01 0.01 0.01 0.01 0.02 0.01 Cl mg l-1 7.32 7.65 6.57 10.44 8.98 10.02 SO4 mg SO4 l-1 9.10 9.82 8.69 7.71 9.26 6.66 NO3 mg NO3 l-1 2.05 1.45 1.76 2.39 1.64 2.87 F mg l-1 0.06 0.05 0.06 0.04 0.05 0.04 PO4 mg PO4 l-1 0.00 0.00 0.01 0.00 0.00 0.00 Si mg l-1 2.29 2.381.94 2.13 2.34 1.87 DOC mg l-1 0.61 1.07 1.02 0.99 1.681.45 pH 6.32 6.42 5.96 6.52 6.47 6.25 G Alk mEq l-1 35.853.7 15.4 51.1 65.7 30.0 Al µg l-1 3836 80 36 55 61 B µg l-1 6 6 6 6 7 6 Ba µg l-1 3 3 3 3 4 2 Be µg l-1 <1 <1 <1 <1 <1 <1 Br µg l-1 29 34 2837 43 38 Cd µg l-1 <1 <1 <1 <1 <1 <1 Co µg l-1 <1 <1 1 <1 <1 <1 Cs µg l-1 <1 <1 <1 <1 <1 <1 Cr µg l-1 <1 <1 <1 <1 <1 <1 Cu µg l-1 2 2 3 1 2 1 Fe µg l-1 10 44 9 56 111 36 I µg l-1 1 1 1 1 2 1 Li µg l-1 2 2 3 2 2 2 Mn µg l-1 4823 115 5 6 9 Mo µg l-1 <1 <1 <1 <1 <1 <1 Ni µg l-1 2 2 4 2 2 2 Pb µg l-1 <1 1 <1 <1 <1 <1 Sb µg l-1 <1 <1 <1 <1 <1 <1 Sr µg l-1 6 7 6 8 8 7 U µg l-1 <1 <1 <1 <1 <1 <1 Y µg l-1 <1 <1 <1 <1 <1 <1 Zn µg l-1 12 10 16 11 13 14
most of the major anions. However, the control has a distinctly higher nitrate concentration (2.4 versus 0.6 mg-NO3 l1, on average) and a markedly lower
concentration for Fe (11 versus 413 mg l1, on average).
The reason for these differences is not clear. However, there are significant redox processes that affect Fe and nitrate concentrations within the groundwater zone:
under more reducing conditions, nitrate concentrations decline while iron is mobilised (Neal et al., 1997b).
l The groundwater, on average, has higher levels of Ca,
Mg and Gran alkalinity than the surface waters. This reflects the greater influence of weathering of the bedrock; groundwaters are similar to the baseflow component of stream water. However, the pH is lower
in the groundwaters compared to the streams. This reflects high levels of carbon dioxide in the groundwater which are associated with soil respiration and the breakdown of organic matter (Neal et al., 1997b). The control and response groundwaters have similar levels of dissolved carbon dioxide of around 70 with a range of 7 to 416 times the atmospheric value. In contrast, the streams are near to saturation with respect to carbon dioxide.
l With felling, nitrate concentration (average changes go
from 0.6 mg-NO3 l1 pre-fell to 3.5 mg-NO3 l1 after
felling) increases with some considerable scatter. Thus, the nitrate pulse observed in the stream is also reflected in the groundwater, but the heterogeneity of within catchment processes produces a complex response
compared to more uniform behaviour in the stream where an integrated response is observed. For most determinands, no significant changes are observable, but there may be a small decline in Na and Cl concentrations which fit in with the expected response to felling.
In conclusion, the groundwater results fit with those for the surface waters in that (a) groundwater characteristics are similar to stream baseflow (except in respect of pH and the large differences in carbon dioxide saturations between surface and groundwaters) and (b) a felling effect is observable for nitrate.
Fig. 4a. Stream water quality time series for selected determinands (sodium, potassium, magnesium, chloride sulphate and nitrate) at control
The groundwater quality at the Ha04 borehole
While the stream at the response site showed some of the effects of felling on water quality, a much stronger response was observed for the Ha04 borehole. The water quality before, during and post-felling is summarised in Table 5 and illustrated in Fig. 5. Within Table 4, median rather than mean values are presented. This is done because there are some anomalously high values for Gran alkalinity, pH, Al, Fe and Mn (shown in Table 4) that occur when the groundwater is at its lowest level and there seems to be inputs from the more reducing waters mentioned above. It is worth noting that these higher values occur predominantly for the period prior to felling and it seems that there is some hydrological change with respect to the felling activity. These anomalously high values are not of specific
importance with regards to this paper on felling, but it does provide some indication of the nature and complexity of groundwater quality variation.
In essence, the water quality in the Ha04 borehole is similar to that in the control and response boreholes, but the carbon dioxide pressure is a little lower (mean 25, range 4 to 210 times the atmospheric pressure). In terms of the effects of felling, the following is observed.
l There is a very clear increase in the nitrate
concentrations (0.8 to 8.7 mg-NO3 l1) following felling.
Rather than an erratic variation in concentration as observed in the response borehole, the change in Ha04 is a regular increase, a flattening off and the start of a decline by the end of the study period.
Fig. 4b. Stream water quality time series for selected determinands (boron, bromine, iodine, pH, Gran alkalinity and ANC) at control (open
Table 4. A summary of groundwater chemistries for the paired catchment study. Sampling began in October-November 1994. The
response site was clearfelled in September-October 1995. Monitoring of the response and control site continued up to spring 2001 and April 1999, respectively.
CONTROL RESPONSE PRE-FELL RESPONSE FELL
Mean Min Max Mean Min Max Mean Min Max
Na mg l-1 6.55 5.52 8.30 6.185.487.41 5.785.05 6.68 K mg l-1 0.21 0.11 0.49 0.180.10 0.33 0.32 0.10 0.83 Ca mg l-1 3.85 1.94 11.25 2.27 1.68 9.42 1.80 1.31 2.83 Mg mg l-1 1.77 1.23 3.20 1.63 1.35 2.82 1.53 1.02 2.27 NH4 mg NH4 l-1 0.05 0.00 0.21 0.03 0.00 0.09 0.04 0.00 0.10 Cl mg l-1 11.07 8.50 17.00 9.68 5.00 11.00 8.52 7.30 9.90 SO4 mg SO4 l-1 10.287.10 18.06 7.75 5.71 17.66 6.41 4.30 14.90 NO3 mg NO3 l-1 2.380.00 4.45 0.580.00 2.10 3.53 0.00 12.00 F mg l-1 0.11 0.03 0.17 0.06 0.04 0.080.05 0.03 0.07 PO4 mg l-1 0.01 0.00 0.05 0.00 0.00 0.01 0.01 0.00 0.10 Si mg l-1 2.31 1.90 4.70 3.51 2.20 4.60 3.26 2.05 4.25 DOC mg l-1 0.42 0.00 1.20 0.56 0.00 1.20 0.61 0.00 2.60 pH 5.40 5.05 6.16 5.40 4.89 6.86 5.26 4.81 5.70 GAlk mEq l-1 77 19 415 70 7 156 53 0 173 Al µg l-1 175 12 439 41 4 160 44 7 153 B µg l-1 8 3 14 6 4 11 7 <1 37 Ba µg l-1 6 3 10 7 4 26 11 3 263 Be µg l-1 <1 <1 1 <1 <1 <1 <1 <1 <1 Br µg l-1 3820 80 26 17 42 39 22 60 Cd µg l-1 <1 <1 2 <1 <1 <1 <1 <1 <1 Co µg l-1 <1 <1 5 4 <1 6 4 1 8 Cs µg l-1 <1 <1 3 <1 <1 9 <1 <1 <1 Cr µg l-1 <1 <1 1 <1 <1 <1 <1 <1 2 Cu µg l-1 4 1 19 5 2 14 3 1 8 Fe µg l-1 11 <1 108431 3 1848240 2 3729 I µg l-1 2 1 3 1 <1 2 1 <1 2 Li µg l-1 3 1 6 4 2 4 4 3 11 Mn µg l-1 131 8230 144 28 209 157 64 362 Mo µg l-1 <1 <1 11 <1 <1 <1 <1 <1 2 Ni µg l-1 83 38 7 4 13 7 3 29 Pb µg l-1 1 <1 11 1 <1 5 1 <1 15 Sb µg l-1 <1 <1 4 <1 <1 <1 <1 <1 1 Sr µg l-1 11 6 186 3 186 3 10 U µg l-1 <1 <1 <1 <1 <1 <1 <1 <1 <1 Y µg l-1 1 <1 3 <1 <1 1 <1 <1 3 Zn µg l-1 5810 375 33 16 108 64 14 265
l There is a marked linear decline in Na, Cl and SO4
concentrations following felling.
l Aluminium concentrations increase from approximately
50 to 200 mg l1, while Gran alkalinity and pH decline
slightly. This corresponds to an acidification following felling. Initially, Gran alkalinity and pH range widely following particularly low groundwater levels.
l Other determinands show relatively little change, taking
into account the large fluctuations in chemistry associated with the anomalous periods of low groundwater levels, although there does seem to be some increase in Mn and Mg concentrations.
Table 5. Statistical summary of the pre and fell/post-fell groundwater quality for the HA04 borehole. For this
borehole, weekly sampling took place between April 1994 and February 2001. The response site, the area was clearfelled in September to October 1995.
PRE-FELL FELL/POST-FELL
median min max median min max
Na mg l-1 7.54 6.69 8.88 6.67 3.80 8.57 K mg l-1 0.34 0.25 0.80 0.38 0.24 1.10 Ca mg l-1 1.86 1.15 8.38 1.59 1.13 7.12 Mg mg l-1 1.55 1.17 3.86 1.71 1.21 3.35 NH4 mg NH4 l-1 0.05 0.00 0.22 0.03 0.00 0.38 Cl mg l-1 11.20 5.60 12.60 9.40 5.50 12.00 SO4 mg SO4 l-1 9.31 6.20 24.26 5.97 3.86 24.14 NO3 mg NO3 l-1 0.85 0.00 1.10 8.70 0.15 13.65 F mg l-1 0.05 0.02 0.13 0.04 0.00 0.10 PO4 mg PO4 l-1 0.00 0.00 0.00 0.00 0.00 0.00 Si mg-Si l-1 2.40 1.50 5.00 2.20 1.25 4.50 DOC mg l-1 0.50 0.00 1.90 0.60 0.20 3.00 pH 5.12 4.73 6.25 4.97 4.43 5.94 G alk mEq l-1 16 -8341 2 -12 221 Al µg l-1 71 7 200 147 16 400 B µg l-1 6 4 387 1 29 Ba µg l-1 6 3 15 7 4 21 Be µg l-1 <1 <1 2 <1 <1 0 Br µg l-1 31 14 42 37 25 128 Cd µg l-1 <1 <1 1 <1 <1 <1 Co µg l-1 2 1 6 3 2 5 Cs µg l-1 <1 <1 1 <1 <1 1 Cr µg l-1 <1 <1 1 <1 <1 2 Cu µg l-1 5 2 16 3 1 12 Fe µg l-1 13 <1 140 11 -3<1 169 I µg l-1 1 <1 1 1 <1 1 Li µg l-1 6 3 14 5 3 11 Mn µg l-1 42 28295 40 27 126 Mo µg l-1 <1 <1 <1 <1 <1 2 Ni µg l-1 5 3 20 6 1 17 Pb µg l-1 3 1 14 1 <1 17 Sb µg l-1 <1 <1 5 <1 <1 1 Sr µg l-1 7 5 18 85 13 U µg l-1 <1 <1 <1 <1 <1 <1 Y µg l-1 1 <1 2 <1 <1 1 Zn µg l-1 35 11 185 36 11 621
water response and more uniform than those encountered in the response borehole (except for the anomalous period of low groundwater levels in the Ha04 borehole). The Ha04 borehole is the only borehole monitored within the Plynlimon catchments which seems to exhibit a more significant groundwater storage term.
Soil-groundwater linkages for the HA04 borehole case
Nitrate concentrations in the HA04 borehole mirror those observed in surface (Oh horizon) soil waters sampled at a podzol site in the Hore catchment which was felled in March 1987 as part of the earlier study described by Neal et al. (1992a,b). The age of the Sitka spruce crop at the Hore site was similar to that growing adjacent to HA04. Pre-felling,
annual mean soil water nitrate concentrations at the Hore site were 1.7 mg-NO3 l1, increasing to 4.6 mg-NO3 l1 in the
first year post-fell and 9.6 mg-NO3 l1 in the second year
post-fell, after which monitoring came to an end (Reynolds
et al., 1992). Although possibly coincidental, the similarity
of the results is indicative of a close coupling between soil and groundwater in the recharge area surrounding borehole HA04. Ironically, the effects of felling on soil water sea-salt ion concentrations at the Hore site were negated by a large sea-salt deposition event which occurred in February 1988 (about 11 months post-felling). Following this event, soil water chloride concentrations of the order of 53 to 71 mg l1 were observed in samples from surface soil
lysimeters in the felled plots. Thus annual mean soil water chloride concentrations were actually higher post-felling
than prior to felling: 6.2 mg l1 pre-fell compared to 14.1
and 7.6 mg l1 for the first and second years after felling
and this in part relates to the importance of climatic events in determining patterns of variability in water quality data.
Conclusion
At the local scale, within the streams, felling has resulted in significant releases of nitrate, small scale acidification and reductions in sea-salt components. In the case of nitrate, the release of nitrate peaks in the first two years and declines thereafter. Previous studies have shown that with the development of the next generation of forest, nitrate concentrations can fall below those found prior to felling. In the present case, this has not been observed as the length
of record is insufficient post-felling. However, even towards the end of the post-felling record, nitrate concentrations continued to fall. The present study may well be typical in this regard. In the case of the sea-salts, the reductions in concentration continue throughout the post-felling phase; even four years after felling, a new steady state condition has not occurred. Furthermore, while an acidification has increased, there is no evidence of this tapering off during the study period. However, in most cases the acidification effect is small and fairly hard to distinguish from the noise associated with factors such as hydrology. These findings are consistent with observations in the literature and processes described earlier in the paper. However, a much longer time span for the monitoring programme is necessary to see what happened with recovery from felling and also what effects the range of influences of climate change have on the stream water quality. In terms of the groundwaters, felling has resulted in some decline in water quality in line with some of the features described for the streams and interpretable in terms of the classic felling effects described earlier. However, as is the general case for groundwaters in the area, the heterogeneous nature of such fracture flow dominated systems is shown by non-uniform behaviour with respect to water quality.
Within the main Hafren channel, it is clear that the felling effects at the local scale are not matched to anywhere near the same degree as at the local level. Rather, there is hardly any discernable response. This is because of the influence of phased felling where the catchment integrates the effects of pre-fell, fell disturbance and post-fell recovery. Further, there are other factors such as climate variability which may dominate any change in water quality. The results presented here provide perhaps the best example of the ability of phased felling to offset the impacts of felling on stream water quality. It vindicates the assertion of the value of such phased felling within the detailed analysis of Neal and Reynolds (1998a,b) for forestry in the UK and it shows the importance of current UK forestry guidelines in relation to an important aspect of environmental management.
Acknowledgements
Within this study, information from almost 20 years of data collection is used in conjunction with that from shorter term studies. The work shows that a long record is needed to sort out the effects of felling on stream water quality when linked to influences such as climate change. For this data to be collected, a major investment has been made by NERC and CEH over the years, augmented by research funding originally from the then Department of the Environment and subsequently transferred to the Environment Agency
of England and Wales. The work has also been supported logistically by the Forest Enterprise for Wales and by the Forestry Commission. We are indebted for their backing.
References
Evans, C.D., Monteith, D.T. and Harriman, R., 2001. Long-term variability in the deposition of marine ions at west coast sites in the UK Acid Waters Monitoring Network: impacts on surface water chemistry and significance for trend determinations.
Sci.Total Environ., 265, 115130.
Hill, T. and Neal, C., 1997. Spatial and temporal variation in pH, alkalinity and conductivity in surface runoff and groundwater for the Upper River Severn catchment. Hydrol. Earth Syst. Sci.,
1, 697716.
Monteith, D.T. and Evans, C.D., 2000. UK Acid Waters Monitoring
Network: 10 year report. ENSIS Publishing, 26, Bedford Way,
London, WC1H 0AP, and the report may be downloaded via the UKAWMN web page: http://www.geog.ucl.ac.uk/akawmn. 364pp.
Monteith, D.T., Evans, C.D. and Reynolds, B., 2000. Are temporal variations in the nitrate content of UK upland freshwaters linked to the North Atlantic Oscillation? Hydrol. Process., 14, 1745 1749.
Neal, C., 1997. A view of water quality from the Plynlimon watershed. (Special Issue) Hydrol. Earth Syst. Sci., 1, 743753. Neal, C., 2002. Assessing environmental impacts on stream water quality: the use of cumulative flux and cumulative flux difference approaches to deforestation of the Hafren Forest, mid-Wales. Hydrol. Earth Syst. Sci., 6, 421432.
Neal, C. and Christophersen, N., 1989. Inorganic aluminium -hydrogen ion relationships for streams; the role of water mixing processes. Sci.Total Environ., 80, 195203.
Neal, C. and Kirchner, J.W., 2000. Sodium and chloride levels in rainfall, mist, stream water and groundwater at the Plynlimon catchments, mid-Wales: inferences on hydrological and chemical controls. Hydrol. Earth Syst. Sci., 4, 295310. Neal, C. and Reynolds, B., 1998. The impact of conifer harvesting
and replanting on upland water quality. R&D Technical report
to the Environment Agency: Environment Agency, Rivers House, Waterside Drive, Aztec West, Bristol, BS32 4UD. Report P211, 137pp.
Neal, C., Robson, A.J., and Smith, C.J., 1990. Acid neutralization capacity variations for the Hafren forest streams, Mid-Wales: inferences for hydrological processes. J. Hydrol., 121, 85101. Neal, C., Reynolds, B., Smith, C.J., Hill, S., Neal, M., Conway, T., Ryland, G.P., Jeffery, H.A., Robson, A.J. and Fisher, R., 1992a, The impact of conifer harvesting on stream water pH, alkalinity and aluminium concentrations for the British uplands: an example for an acidic and acid sensitive catchment in mid-Wales. Sci.Total Environ., 126, 7587.
Neal, C., Fisher, R., Smith, C.J., Hill, S., Neal, M. and Jeffery, H.A., 1992b. The effects of tree harvesting on stream water quality at an acidic and acid sensitive spruce forested area: Plynlimon, mid-Wales. J. Hydrol., 135, 305319.
Neal, C., Neal, M., Ryland, G.P., Jeffery, H.A., Harrow, M., Hill, S. and Smith, C.J., 1994. Chemical variations in near surface drainage water for an acidic spruce forested UK upland area subjected to timber harvesting: inferences on cation exchange processes in the soil. Sci.Total Environ., 154, 4761.
Neal, C., Smith, C.J., Jeffery, H.A., Harrow, M.L. and Neal, M., 1996. Dissolved chromium pollution in rainfall and surface waters in Mid-Wales during the mid 1980s. Sci. Total Environ.,
Neal, C., Wilkinson, J., Neal, M., Harrow, M., Wickham, H., Hill, L. and Morfitt, C., 1997a. The hydrochemistry of the River Severn, Plynlimon, mid-Wales. Hydrol. Earth System Sci., 1, 583-618.
Neal, C., Robson, A.J., Shand, P., Edmunds, W.M., Dixon, A.J., Buckley, D.K., Hill, S., Harrow, M.L., Neal, M. and Reynolds, B., 1997b. The occurrence of groundwater in the Lower Palaeozoic rocks of upland Central Wales. Hydrol. Earth Syst.
Sci., 1, 318.
Neal, C., Hill, T., Alexander, S., Reynolds, B., Hill, S., Dixon, A.J., Harrow, M.L., Neal, M., and Smith, C.J., 1997c. Stream water quality in acid sensitive UK upland areas, an example of potential water quality remediation based on groundwater manipulation. Hydrol. Earth Syst. Sci., 1, 185196.
Neal, C., Reynolds, B., Adamson, J.K., Stevens, P.A., Neal, M., Harrow, M. and Hill, S., 1998a. Analysis of the impacts of major anion variations on surface water acidity particularly with regard to conifer harvesting: case studies from Wales and Northern England. Hydrol. Earth Sys. Sci., 2, 303322.
Neal, C., Reynolds, B., Wilkinson, J., Hill, T., Neal, M., Hill, S. and Harrow, M., 1998b. The impacts of conifer harvesting on runoff water quality: a regional study for Wales. Hydrol. Earth
Sys. Sci., 2, 323344.
Neal, C., Reynolds, B., Neal, M., Pugh, B., Hill, L. and Wickham, H., 2001. Long term changes in the water quality of rainfall, cloud water and stream water for moorland, forested and clear-felled catchments at Plynlimon, mid-Wales. Hydrol. Earth Sys.
Sci., 5, 459476.
Neal, C., Reynolds, B., Neal, M., Wickham, H., Hill, L. and Pugh, B., 2003. The Impact of Conifer Harvesting on Stream Water Quality: A Case Study in Mid-Wales. Water, Air, Soil Pollut.,
Focus 3, 119138.
Neal, C., Reynolds, B., Neal, M. and Williams, B., 2004. The hydrochemistry of plantation spruce forest catchments with brown earth soils, Vyrnwy in mid-Wales. Hydrol. Earth Syst.
Sci., 8, 460484.
Reynolds, B., Neal, C., Hornung, M., Hughes, S. and Stevens, P.A. 1988. Impact of afforestation on the soil solution chemistry of stagnopodzols in Mid-Wales. Water, Air, Soil Pollut., 38, 55 70.
Reynolds, B., Stevens, P.A., Adamson, J.K., Hughes, S. and Roberts, J.D., 1992. Effects of clear felling on stream and soil water aluminium chemistry in three UK forests. Environ. Pollut.,
77, 157165.
Reynolds, B., Stevens, P.A., Hughes, S., Parkinson, J.A. and Weatherley, N.S., 1995. Stream chemistry impacts of conifer harvesting in Welsh catchments. Water Air Soil Pollut., 79, 147 170.
Robson, A.J. and Neal, C., 1996. Water quality trends at an upland Welsh site. Hydrol. Process., 10, 183203.
Stevens, P.A. and Hornung, M., 1988. Nitrate leaching from a felled Sitka spruce plantation in Beddgelert forest, North Wales.
Soil Use Manage., 4, 39.
Stevens, P.A. and Hornung, M., 1990. Effects of forest harvesting and ground flora re-establishment on inorganic-N leaching from a Sitka spruce plantation in north Wales, UK. Biogeochemistry,
10, 5365.
Stevens, P.A., Adamson, J.K., Anderson, M.A. and Hornung, M. 1988. Effects of clear felling on surface water quality and site nutrient status. In: Ecological Change in the Uplands, M.B. Usher and D.B.A. Thompson (Eds.), British Ecological Society Special Publication no. 7, Blackwell, Oxford, UK. 289294.