HAL Id: hal-01805474
https://hal.archives-ouvertes.fr/hal-01805474
Submitted on 27 Oct 2020
HAL is a multi-disciplinary open access
archive for the deposit and dissemination of
sci-entific research documents, whether they are
pub-lished or not. The documents may come from
teaching and research institutions in France or
abroad, or from public or private research centers.
L’archive ouverte pluridisciplinaire HAL, est
destinée au dépôt et à la diffusion de documents
scientifiques de niveau recherche, publiés ou non,
émanant des établissements d’enseignement et de
recherche français ou étrangers, des laboratoires
publics ou privés.
instruments inf the Mediterranean basin during summer
2013
N. Zannoni, S. Dusanter, V. Gros, R. Sarda Esteve, V. Michoud, V. Sinha, N.
Locoge, B. Bonsang
To cite this version:
N. Zannoni, S. Dusanter, V. Gros, R. Sarda Esteve, V. Michoud, et al.. Intercomparison of two
com-parative reactivity method instruments inf the Mediterranean basin during summer 2013. Atmospheric
Measurement Techniques, European Geosciences Union, 2015, 8 (9), pp.3851 - 3865.
�10.5194/amt-8-3851-2015�. �hal-01805474�
www.atmos-meas-tech.net/8/3851/2015/ doi:10.5194/amt-8-3851-2015
© Author(s) 2015. CC Attribution 3.0 License.
Intercomparison of two comparative reactivity method instruments
inf the Mediterranean basin during summer 2013
N. Zannoni1, S. Dusanter2,3,4, V. Gros1, R. Sarda Esteve1, V. Michoud2,3, V. Sinha5, N. Locoge2,3, and B. Bonsang1
1LSCE, Laboratoire des Sciences du Climat et de l’Environnement, CNRS-CEA-UVSQ, Orme des Merisiers,
91191 Gif sur Yvette, France
2Mines Douai, Département Sciences de l’Atmosphère et Génie de l’Environnement (SAGE), 59508, Douai, France
3Université Lille 1 Sciences et Technologies, 59655 Villeneuve d’Ascq, France
4School of Public and Environmental Affairs, Indiana University, Bloomington, IN, USA
5Department of Earth and Environmental Sciences, Indian Institute of Science Education and Research Mohali,
Sector 81, S.A.S. Nagar, Manauli PO, Punjab, 140306, India
Correspondence to: V. Gros (valerie.gros@lsce.ipsl.fr)
Received: 22 April 2015 – Published in Atmos. Meas. Tech. Discuss.: 18 May 2015 Revised: 5 August 2015 – Accepted: 3 September 2015 – Published: 21 September 2015
Abstract. The hydroxyl radical (OH) plays a key role in the
atmosphere, as it initiates most of the oxidation processes of volatile organic compounds (VOCs), and can ultimately lead to the formation of ozone and secondary organic aerosols (SOAs). There are still uncertainties associated with the OH budget assessed using current models of atmospheric chem-istry and direct measurements of OH sources and sinks have proved to be valuable tools to improve our understanding of the OH chemistry.
The total first order loss rate of OH, or total OH reactiv-ity, can be directly measured using three different methods, such as the following: total OH loss rate measurement, laser-induced pump and probe technique and comparative reactiv-ity method. Observations of total OH reactivreactiv-ity are usually coupled to individual measurements of reactive compounds in the gas phase, which are used to calculate the OH reactiv-ity. Studies using the three methods have highlighted that a significant fraction of OH reactivity is often not explained by individually measured reactive compounds and could be as-sociated to unmeasured or unknown chemical species. There-fore accurate and reproducible measurements of OH reactiv-ity are required.
The comparative reactivity method (CRM) has demon-strated to be an advantageous technique with an extensive range of applications, and for this reason it has been adopted by several research groups since its development. However,
this method also requires careful corrections to derive ambi-ent OH reactivity.
Herein we present an intercomparison exercise of two CRM instruments, CRM-LSCE (Laboratoire des Sciences du Climat et de l’Environnement) and CRM-MD (Mines Douai), conducted during July 2013 at the Mediterranean site of Ersa, Cape Corsica, France. The intercomparison exercise included tests to assess the corrections needed by the two instruments to process the raw data sets as well as OH re-activity observations. The observation was divided in three parts: 2 days of plant emissions (8–9 July), 2 days of ambient measurements (10–11 July) and 2 days (12–13 July) of plant emissions. We discuss in detail the experimental approach adopted and how the data sets were processed for both in-struments. Corrections required for the two instruments lead to higher values of reactivity in ambient air; overall 20 % in-crease for CRM-MD and 49 % for CRM-LSCE compared to the raw data. We show that ambient OH reactivity mea-sured by the two instruments agrees very well (correlation described by a linear least squares fit with a slope of 1 and
R2of 0.75).
This study highlights that ambient measurements of OH reactivity with differently configured CRM instruments yield
consistent results in a low NOx (NO + NO2), terpene rich
environment, despite differential corrections relevant to each instrument. Conducting more intercomparison exercises, in-volving more CRM instruments operated under different
am-bient and instrumental settings will help in assessing the vari-ability induced due to instrument-specific corrections further.
1 Introduction
The hydroxyl radical (OH) is the main oxidizing agent in the atmosphere during daytime. It initiates the oxidation of most trace gases emitted by natural and anthropogenic sources and participates in almost all the complex atmospheric chemical pathways. Oxidation of trace gases leads to the production
of ozone (O3)and secondary organic aerosols (SOAs) which
can impact air pollution and climate. With such a role, it is essential to accurately understand both sources and sinks of OH. The main sources of OH are the following:
photoly-sis of O3, formaldehyde (HCHO) and nitrous acid (HONO),
reaction of alkenes with ozone, and recycling from
perox-yradicals in low NOx (NO + NO2)environments (Paulson
et al., 1999; Hofzumahaus et al., 2009; Fuchs et al., 2013).
Main sinks of OH are CO, CH4, NO2, VOCs (volatile
or-ganic compounds) and radicals, mainly HO2. Recent
stud-ies report that OH also reacts quickly with organic peroxy
radicals such as CH3O2, and OH + RO2reactions may be a
significant sink of OH in pristine environments (Archibald et al., 2009; Fittschen et al., 2014).
Goldstein and Galbally (2007) have estimated the presence
of 104–105 different organics measured in the atmosphere,
this number may be only a small part of the species actu-ally present and makes exhaustive measurements of VOCs very challenging and unfeasible with current analytical tech-niques. In this context, several research groups in the past decade developed methods capable of measuring directly the total sink of OH, termed total OH reactivity.
Measurements of total OH reactivity present several ad-vantages. The first one is to obtain direct information on the total OH sink term in a given environment without the need of measuring every species present in the gas phase. Sec-ondly, since OH is in a steady state in the atmosphere the balance between OH production and loss rates can provide additional information on OH sources (Martinez, 2003; Hens et al., 2014). Moreover, OH reactivity measurements help to estimate instantaneous ozone production rates and regimes (Sinha et al., 2012). Finally, when mixing ratios of individ-ual gaseous compounds are available at the same site under study, measured total OH reactivity can be used as a tool for chemical closure of the reactive carbon budget for that spe-cific environment. In this case, we can determine the calcu-lated OH reactivity as follows:
kOH=
X
i
ki+OH·Xi, (1)
with i any measured chemical in the gas phase, ki+OH the
rate coefficient of the reaction between i and OH, and Xi the
measured concentration of i.
Several studies on simultaneous observations of total OH reactivity and gaseous compounds have highlighted discrep-ancies between the total measured OH reactivity and calcu-lated reactivity, up to 90 % in biogenic dominated environ-ments e.g. Di Carlo et al. (2004); Nölscher et al. (2012b) and Hansen et al. (2014).
The difference between the total measured and the calcu-lated OH reactivity has been named missing OH reactivity and has been attributed to unmeasured primary and/or sec-ondary compounds in the atmosphere (Di Carlo et al., 2004; Kim et al., 2011).
Currently, three methods exist to perform direct measure-ments of total OH reactivity, such as the total OH loss rate measurement (TOLRM) (Kovacs and Brune, 2001; Mao et al., 2009; Ingham et al., 2009; Hansen et al., 2014); Pump and probe technique (Calpini et al., 1999; Sadanaga et al., 2004; Yoshino et al., 2006; Lou et al., 2010) and the compar-ative reactivity method (CRM) (Sinha et al., 2008; Nölscher et al., 2012a; Dolgorouky et al., 2012; Kim et al., 2011; Ku-mar and Sinha, 2014). A detailed comparison of the three methods can be found in Nölscher et al. (2012a) and Hansen et al. (2015).
Total OH loss rate measurement consists of a flow tube used to sample ambient air at flow rates in the order of
50–400 sL min−1, wherein a large amount of OH is added
through a movable injector. OH concentration is quantified at different reaction times using a FAGE apparatus (fluores-cence assay by gas expansion, see Faloona et al. (2004) and Dusanter et al. (2009) at the exit of the flow tube by mov-ing the injector, from which a decay curve is obtained due to a change in distance between the OH source and the OH detector.
The pump and probe technique was first pioneered by Calpini et al. (1999) and Jeanneret et al. (2001) and then adapted by other groups (Sadanaga et al., 2004, Yoshino et al., 2006 and Lou et al., 2010). The instrument consists of three main parts: a flow tube to sample ambient air, a pulsed laser to generate OH in the sampling reactor, and a FAGE apparatus to quantify OH. The sampling flow is set around
10–20 sL min−1 and assuming laminar flow the sample has
1 s residence time for reaction with OH. The hydroxyl rad-ical OH is generated by ozone photolysis within the reactor and is detected after each laser pulse using the FAGE appa-ratus to acquire time-resolved OH decay.
The comparative reactivity method was more recently de-veloped (Sinha et al., 2008). It is an indirect method since OH is not directly monitored, based on the competition for synthetically generated OH radicals between a refer-ence molecule, pyrrole, and reactive compounds in ent air. This is realized in a glass flow reactor where
ambi-ent air (≈ 0.25 sL min−1), pyrrole, and OH are continuously
mixed in different stages, with the reactor coupled to a pyr-role detector, most of the time being a proton-transfer reac-tion mass spectrometer (PTR-MS). The reactivity is obtained
from changes in pyrrole concentration as a result of the com-petition inside the reactor for OH radicals.
The comparative reactivity method exhibits several advan-tages compared to other existing methods. Among those, the smaller sampling flow needed to run it (since no FAGE ap-paratus is needed), which broadens the application of the technique to branch and plant enclosure studies for instance; the reader can refer to Kim et al. (2011) and Nölscher et al. (2013) for more information. In addition, several research groups have already a PTR-MS for VOCs’ measurements; FAGE instruments are more expensive and require highly skilled operators. These advantages have led to the construc-tion of several CRM instruments throughout the world in the past few years.
Another existing version of the CRM consists of the glass reactor coupled to a Gas Chromatography- Photo Ionization Detector (GC-PID) (Nölscher et al., 2012a), this version is cheaper and more portable but has also demonstrated to be slightly less robust over time compared to the PTR-MS set-up.
On the other hand, processing of the raw data and correc-tions for measurements artifacts represent the main disadvan-tages of this technique. Previous studies (Sinha et al., 2008; Dolgorouky et al., 2012; Hansen et al., 2015; Michoud et al., 2015) stressed that careful corrections are necessary for CRM measurements and a standardized procedure for data processing has yet to be agreed by the community.
In this study, we present results of the first intercomparison experiment involving two Comparative Reactivity Method instruments, CRM-LSCE (Laboratoire des Sciences du Cli-mat et de l’Environnement) and CRM-MD (Mines Douai) as-sembled in two different laboratories, run by different oators but working under similar settings. Our study was per-formed to test a clear and simple approach to process the raw data and accurately derive OH reactivity values. It aims at identifying potential limitations and getting insights into the robustness of the CRM. Our exercise includes a comparison of calibration factors, correction factors and measurements of OH reactivity conducted in ambient air (10–11 July) and from a plant enclosure (8–9 July and 12–13 July) to cover a broad range of OH reactivity (from the limit of detection,
LOD, of the instruments up to 300 s−1).
2 Experimental
2.1 The comparative reactivity method
The comparative reactivity method (CRM) relies on the competitive kinetics for OH radicals between a reference molecule not present in ambient air at normal conditions (i.e.
pyrrole C4H5N) and reactive species in ambient air. The
ex-periment is conducted in a glass flow reactor coupled to a detector, in our case a proton transfer reaction mass spec-trometer (PTR-MS) (Lindinger and Jordan, 1998). The glass
Figure 1. Pyrrole concentration detected by the PTR-MS during a typical OH reactivity experiment with CRM. C0, C1, C2, C3 are concentrations corresponding to different experimental stages. Technical improvements were done to minimize the difference be-tween C0 and C1 reducing pyrrole loss for photolysis.
reactor is equipped with a UV lamp and four arms for flows inlets and outlets; the PTR-MS monitors the concentration of the reference molecule, pyrrole, at any time during the
ex-periment at protonated m/z 68 (C4H5NH+). A detailed
de-scription of the reactor and method is available in the publi-cations of Sinha et al. (2008); Nölscher et al. (2012a) and is displayed in Fig. 1.
In brief: (i) a known amount of pyrrole is diluted in the
glass reactor with zero air and dry N2, and its concentration
is measured with the PTR-MS (C0). Next, (ii) the UV lamp is switched on and photolysis of pyrrole occurs inside the re-actor. This is considered our initial concentration of pyrrole
and measured as C1. (iii) The flow of dry N2 is humidified
through a bubbler containing high purity water and photoly-sis of water vapour at 184.9 nm takes place: at this stage we produce OH radicals in the system. The fraction of OH re-acted with pyrrole is deduced from the difference between pyrrole initial concentration (C1) and pyrrole concentration when OH is formed (C2). C2 is the concentration of pyr-role after it has reacted with the OH produced, following
the kinetic rate constant of 1.2 × 10⁻¹⁰cm3molecule−1s−1
at 25◦C (Atkinson et al., 1984; Dillon et al., 2012). Finally,
(iv) zero air is replaced by ambient air, and the competitive reaction for the OH radicals between pyrrole and ambient molecules starts. The level of pyrrole increases depending on the reactivity of OH reactants in ambient air and pyrrole con-centration is recorded as C3. The higher the concon-centration and number of reactive species in ambient air, the larger is the reactivity, and broader the difference between C2 and C3. Regular switches between C2 and C3 permit to determine the total OH reactivity in ambient air using Eq. (2):
kOH=
(C3 − C2)
(C1 − C3)·kpyrrole+OH·C1, (2)
with kpyrrole+OHthe rate constant of the reaction between
pyr-role and OH. For the derivation of this equation the reader can refer to Sinha et al. (2008).
In this expression it is assumed that the reaction between pyrrole and OH follows the pseudo first order kinetics, thus [pyrrole] > [OH].
Measurements of OH reactivity with this method are usu-ally conducted with the instrument recording alternatively C2 and C3 levels, while C1 can be monitored less often.
We automatically acquire C2 and C3 by using solenoid valves, which permit fast switches between zero air and am-bient air to dilute pyrrole inside the reactor. In the tests re-ported herein we switch between the two levels every 5 min, to monitor the competition for OH radicals only and exclude interferences from possible fast humidity changes in ambient air, which can lead to OH field variations inside the reactor.
Measuring C1 usually takes a longer time, because of lamp warming up when switching from C0, and mainly because of the time required to dry the reactor completely. For this rea-son, we tested a new approach on both CRM systems which represents an alternative method to measure the initial con-centration of pyrrole (C1). This approach is based on intro-ducing a concentrated reactive molecule into the reactor, with the aim of minimizing pyrrole consumption due to OH reac-tion to a negligible fracreac-tion. The OH-scavenger has to ex-hibit a proton affinity lower than water to avoid a
consump-tion of H3O+inside the PTR-MS, since a large amount of
this species is needed to scavenge OH. Tests performed us-ing methane at 30 000 ppmv are discussed in Sect. 3.1. This new approach showed to be an excellent alternative since it allows recording C1 more precisely in only a few minutes compared to hours with the usual method.
2.2 Data processing
To process data of OH reactivity we correct the values ob-tained from Eq. (1) as follows (see also Hansen et al., 2015; Michoud et al., 2015):
i. correction on C2 to account for potential differences in humidity between C2 and C3 levels;
ii. correction on C3 to account for some secondary
chem-istry (HO2+NO→OH) which can lead to a significant
production of OH inside the reactor;
iii. correction on reactivity from Eq. (1) to consider devia-tion from pseudo first order kinetics (Sinha et al., 2008); iv. dilution of ambient air inside the reactor.
(i) Zero air and ambient air at different humidity used to di-lute pyrrole and acquire respectively C2 and C3 lead to dif-ferent water content and OH levels inside the reactor which can produce differences in the two levels and cause an under or overestimation of the reactivity in ambient air. To reduce humidity differences between C2 and C3 we equipped the CRM with a catalytic converter to generate zero air to acquire C2. The catalytic converter of CRM-LSCE is made of Pt- Pd
pellets heated up to 350◦C, while the one of CRM-MD has
Pt wool also held at 350◦C. However, humidity changes
be-tween C2 and C3 are still observed and corrections of the raw data of reactivity are often needed.
To look at humidity changes it is useful to monitor the ratio between m/z 37 and m/z 19 (here referred as m37/m19) which corresponds to the protonated mass of the first water cluster normalized for the number of primary ions inside the PTR-MS (see Ammann et al., 2006 and Sinha et al., 2009) and depends on the absolute humidity of the air sampled. For instance, if zero air has a lower humidity than ambient air, the ratio m37/m19 will be smaller for C2 compared to C3, which will result in a smaller difference between C2 and C3 and an underestimation of the reactivity in ambient air. In addition, humidity differences can also vary in opposite directions (C2 can have lower humidity than C3 and vice versa).
To quantify this type of correction we inject in the reactor a known amount of dry clean air and produce in this way a C2 level that differs from the actual C2 only for a different
humidity (referred in this study as C2∗). Levels of C2 are
plotted vs. m37/m19 ratio recorded during C2 (see Fig. 2). We correct therefore the measured C2 by applying Eq. (3): C2corrected=C2 + p · [(m/z37/m/z19)duringC3
−(m/z37/m/z19)duringC2], (3)
where p corresponds to a mean value of the slopes from the linear least squares fits obtained from different tests on the field and represented in Fig. 2. A comparison on the humidity correction for the two CRMs will be presented in Sect. 3.2. (ii) When the UV lamp is switched on, photolysis of water vapour at 184.9 nm occurs as follows:
H2O → OH + H. (R1)
H recombines with O2present in zero air to rapidly generate
HO2:
H + O2+M → HO2+M. (R2)
HO2can react with NO, if this is present in the sampled air,
to generate OH:
NO + HO2→OH + NO2. (R3)
This secondary source of OH leads to a lower level of C3, the magnitude of which depends on the amount of ambient NO. This artifact leads to an underestimation of the OH re-activity in ambient air and can even result in negative val-ues. A detailed description on how to assess the sensitivity of the CRM to NO and how to quantify the correction for this artifact is described elsewhere (Dolgorouky et al., 2012; Hansen et al., 2015; Michoud et al., 2015). During our inter-comparison exercise the level of NO in ambient air reached a maximum of 1 ppbv, which resulted in negligible secondary formation of OH inside our two systems, therefore no cor-rections were warranted here. (iii) It is assumed in Eq. (1)
40 30 20 10 0 m/z68 during C2 (ppbv) 0.28 0.26 0.24 0.22 0.2 m37/m19during C2 15/07 y= (-35.453 ± 10.4)x +32.609 ± 2.49 23/07 y= (-37.416 ± 9.12)x +42.672 ± 2.15 27/07 y= (-37.535 ± 9.1)x +51.602 ± 2.5 15/07 23/07 27/07
Figure 2. Linear least squares fit of m/z 68 during C2 vs. m37/m19 during C2 for the tests conducted on the field to assess the correc-tion for humidity differences between C2 and C3 for CRM-LSCE. Equation coefficients are reported with one standard deviation. Dif-ferences in the intercepts are due to a less efficient tracking of ab-solute humidity from m37/m19 on a longer time scale.
that reactions of OH with pyrrole and ambient trace gases proceed through first order kinetics, i.e. pyrrole and trace gas concentrations are higher than OH concentration. However, CRM instruments are operated with OH concentrations on the same order of magnitude than pyrrole ([pyrrole] ∼ 60– 70 ppbv, [OH] ∼ 40–50 ppbv) and a correction must be ap-plied to account for a deviation from first order kinetics. A correction factor F can be obtained theoretically (Sinha et al., 2008) or experimentally (as in this study and in Hansen et al., 2015; Michoud et al., 2015) and used to process reac-tivity data already corrected for humidity changes and sec-ondary OH formation as follows:
kOHcorrected=kOHmeasured·F. (4)
Previous studies used simple numerical simulations to deter-mine such correction factor. Simulations were run at pyrrole-to-OH ratio of 10, near pseudo first order condition, and 1.22, experimental conditions, for more information see Sinha et al. (2008). A fitting function is obtained from simulations in the experimental conditions which showed that if a correc-tion is not taken into account, measurements of OH reactivity can be overestimated for low values of pyrrole-to-OH ratio.
In our study, we use an experimental approach to correct for deviations from first order kinetics, which can be more representative of the complex chemistry occurring inside the reactor.
To do so, we introduce inside the reactor a known amount of a standard gas whose reactivity with OH is well deter-mined and reported in literature. We test the instrument re-sponse over a broad range of reactivity, for instance from the
LOD to 300 s−1, for different standard gases and different
pyrrole-to-OH ratios. From each test a linear least squares fit for the measured OH reactivity vs. the injected reactivity
is obtained, and the inverse of the slope is then reported for every pyrrole-to-OH ratio investigated. In such way, we ob-tain a correction factor which is instrument specific for the experimental conditions adopted.
In our intercomparison exercise we used as test gases propane and ethane, with ethane being the same standard gas for both instruments. Results of these tests are shown in Sect. 3.3. (iv) OH reactivity values obtained from Eq. (1) and corrected for humidity changes, secondary OH formation, and deviation from first order kinetics, are then corrected for the dilution of ambient air sampled inside the reactor. The di-lution factor is calculated as the ratio between the sampling flow rate and the total flow rate inside the reactor (sum of
flow rates of N2, pyrrole and ambient air).
2.3 Comparative Reactivity Method set up
A description of the two CRM instruments used in this study, including operating conditions, is given below. It is illustrated by a detailed description of the instrument con-structed at LSCE (Laboratoire des Sciences du Climat et de l’Environnement) in Fig. 3 and differences with the one from MD (Mines Douai) are reported in Table 1 and discussed be-low.
The comparative reactivity method instrument assembled at LSCE is a modified version of the CRM used during the MEGAPOLI field campaign and presented in Dolgorouky et al. (2012). Briefly, pyrrole (Westfalen, Germany, 10.2 ppmv
in N2, 20 % uncertainty), zero air (Messer standard mixture)
and N2 (Messer, purity 99.9999 %) are injected in a glass
flow reactor (same shape and size as the one described by Sinha et al., 2008) and pyrrole concentration is monitored with a PTR-MS (High sensitivity quadrupole, from IONI-CON Analytic GmbH, Innsbruck, Austria). Zero air is ob-tained from synthetic air to achieve dry conditions for the acquisition of C1 and from sampling ambient air through a catalytic converter to generate zero air at ambient RH when measuring C2. A pump is placed at the exhaust of the cell, therefore the total flow is driven inside the reactor by the pump at the exhaust and the PTR-MS sampling. A UV pen ray Hg lamp (Lot Oriel, France) emitting at 184.9 nm is used to produce hydroxyl radicals. The total flow rate inside the
reactor is usually kept around 0.3 sL min−1, with a
concen-tration of pyrrole in the range of 20–30 ppbv in the C2 level, C1 of 65 ± 5.8 ppbv (1σ ) and pyrrole-to-OH ratio ranging from 1.2 to 2.6.
A three-way valve is used to inject an external gas standard inside the sampling line. Additions of a standard test gas per-mit to derive the correction for a deviation from first order kinetics (see Sect. 3.3). A four-way valve is used to switch automatically every 5 min between C2 (zero air from the cat-alytic converter) and C3 (ambient air). An additional pump is used to either flush the sampling line with ambient air while the system is measuring C2 or to flush the catalytic converter while the system is measuring C3. Sampling lines for the
re-Table 1. Technical parts and operational settings of CRM LSCE and CRM MD during the intercomparison excercise. MPI stands for Max Planck Institute (chemistry division, Mainz, Germany).
CRM-LSCE CRM-MD
Reactor glass reactor from MPI glass reactor from MPI Detection system PTR-QMS (from IONICON, Innsbruck,
Aus-tria)
PTR-ToFMS (second generation, Kore Technology Ltd, Ely, UK) Sampling for kOH in ambient air
-line OD /length (inches, m) 1/800/3 1/400/30 -flow rate (sL min−1) 0.25 2
-residence time (s) ∼3 ∼3
Sampling for kOH plant enclosure -line OD /length (inches/ m) -flow rate (sL min−1) -residence time (s) 1/800/3 + 1/400/2.5 0.25 ∼14 1/400/30 2 ∼16 Sampling set up no pump before sampling, PTFE filter at
the inlet
Teflon pump between sampling line and reactor,
no filter at the inlet Total flow inside reactor (sL min−1) ∼0.33 ∼0.355
Photolysis rate (%) ∼5 ∼2
C1 value (ppbv) interpolated over the measured C1 dry 65 ± 5.8 (1σ )
from methane test 61.4 ± 0.6 (1σ ) Systematic uncertainty (%) 35 18
LOD (s−1) (3σ ) 3 3
Figure 3. Simplified not-to-scale schematic of the comparative reactivity method instrument of LSCE. Known flows of pyrrole, N2, and zero
air are injected into a glass flow reactor. A four-way manual valve is used to humidify the flow of nitrogen, when OH radicals production is required. A four-way automatic valve allows for fast switches between C2 and C3 stages. A known amount of an external standard (in this case, propane) can be injected in the reactor to calibrate the instrument through a three-way valve.
actor and the catalytic converter are collocated to reduce hu-midity variations when measuring C2 and C3. Although the humidity difference between C2 and C3 is reduced with a catalytic converter, we still observe differences between the
two levels; therefore, we correct the raw data as reported in the data processing section.
Five mass flow controllers are used to control the flow
rates, including pyrrole, synthetic air, N2, external standard
en-sure a constant and precise dilution of pyrrole and ambient air during the measurements. An opening for an overflow is placed before the mixing of zero air with the external
stan-dard and is kept around 0.01–0.02 sL min−1, to avoid any
pressure build up in the system and to provide an outlet to check flows stability at any time. CRM-LSCE measures total OH reactivity automatically, except for manual quality check controls (external standard injection), and C1 acquisition.
The dwell time for the acquisition of m/z 68 is 20 s, and C2-C3 switches are performed every 5 min, leading to OH reactivity measurements every 10 min. The LOD of
LSCE-CRM is ∼ 3 s−1 (3σ ) and the systematic uncertainty is
∼35 % (1σ ), including uncertainties on the rate coefficient
between pyrrole and OH (8 %), detector sensitivity changes and pyrrole standard concentration (22 %), correction factor for kinetic regime (26 %) and flows fluctuations (2 %).
Potential measurement artifacts discussed in Sinha et al. (2008) are either corrected for the CRM-LSCE system or negligible under characteristic ambient conditions of the measuring site. In particular, photolysis is quantified to be
∼5 %; humidity changes are corrected as reported in the data
processing section and OH formation by HO2+NO is
negli-gible.
The CRM-MD instrument is described elsewhere (Hansen et al. 2015; Michoud et al., 2015). For this study, several im-provements were performed compared to the instrument de-scribed in Hansen et al. (2015), to achieve a lower pyrrole photolysis in the reactor (< 5 %), and by consequence, to re-duce the potential photolysis of other trace gases. The CRM-MD instrument was operated under the same conditions of flow rates, pyrrole concentration, and pyrrole-to-OH ratios as the LSCE instrument to allow an assessment of the re-producibility of OH reactivity measurements using the CRM technique. CRM-MD exhibits similar figures of merit than
CRM-LSCE, including a detection limit (3σ ) of 3 s−1and a
systematic error quantified to be ∼ 18 % (1σ ). Differences in uncertainty between the two instruments can be explained by different uncertainties (1σ ) on the concentration of the pyr-role standard used (20 % for LSCE and 5 % for CRM-MD) and uncertainties in the correction factors applied for deviations from first order kinetics (26 % for CRM-LSCE while 9 % for CRM-MD).
The main differences between both instruments are listed in Table 1 and are discussed below:
i. Choice of the detector; both have a proton transfer re-action mass spectrometer: quadrupole from IONICON Analytik, Austria for LSCE and Time of Flight from KORE Technology, UK for MD.
ii. The sampling point during the ambient kOH experi-ment: the sampling lines of the two instruments were placed on top of each trailer, about 30 m far from each other, and 2 m different in height. The length of the sam-pling lines was the same, while the outer diameter size
and sampling flow rates differ to have a similar resi-dence time of the sample in the lines of about 3 s. iii. The length of the sampling line during the enclosure
kOH experiment: approximately 30 m for CRM-MD and 5.5 m for CRM-LSCE. A longer sampling line was used for CRM-MD to perform collocated measurements with CRM-LSCE. However, the sampling flow rate was
adjusted to 2 L min−1 to get similar residence times
in the sampling lines of the two instruments (approxi-mately 14 and 16 s for CRM-LSCE and CRM-MD, re-spectively).
iv. The sampling strategy: CRM-MD is equipped with a Teflon pump between the sampling line and the reactor while CRM-LSCE has the sampling line directly con-nected to the reactor, without any pump. The extra flow from the pump is vented through an open T-connector and similar sampling flow rates are achieved for both in-struments. In addition, the sampling line of CRM-LSCE has a PTFE filter at the inlet to exclude particles with a diameter larger than 0.25 µm entering the reactor, while CRM-MD has no filters at the inlet.
In addition, each instrument uses a different pyrrole standard,
i.e. from Westfalen, Germany (10.2 ppmv in N2, 20 %
uncer-tainty, 1σ ) for CRM-LSCE and from PRAXAIR Inc., France
(10.1 ppmv in N2, 5 % uncertainty, 1σ ) for CRM-MD. There
are legitimate concerns that differences in the OH reactivity measurements could be due to the pyrrole standard since this type of gas cylinder is not common. In order to estimate the impact of using two different standards on the intercompar-ison results, the standard from Mines Douai was tested on the LSCE instrument, which instead was calibrated using the LSCE standard. The concentration of pyrrole measured in the MD cylinder was 9170 ± 272 ppbv, which is less than 10 % different of the certified concentration of 10.1 ppmv.
2.4 Description of the field site and experiments
The two CRM instruments were deployed from the 8–13 July
2013 at a remote site, Ersa, Cape Corsica, France (42.97◦N,
9.38◦E, alt 533 m). The site was chosen for intensive
mon-itoring of atmospheric trace gases and aerosols under the ChArMEX project (Chemistry and Aerosols in a Mediter-ranean Experiment), an international program of field mon-itoring and modelling of atmospheric properties and climate interactions over the Mediterranean basin (https://charmex. lsce.ipsl.fr/). OH reactivity was measured as part of the 2013 CARBOSOR (CARBOn within continental pollution plumes: SOurces and Reactivity) field campaign by CRM-LSCE from the 16 July–5 August.
The field site is located in the northern part of cape Corsica on the top of a hill facing the Mediterranean sea (533 m a.s.l.) and a few km away from the coast (2.5, 4.5, and 6 km from the west, north and east side respectively). The site is
acterized by an intense Maquis shrubland, including char-acteristic plant species of the Mediterranean ecosystem as
Pistacia Lentiscus, Myrtus Communis, Cistus Monspelien-sis, Rosmarinus Officinalis, Genisteae, Hellebores and
oth-ers. The closest anthropogenic source is the city of Bastia, second largest city and main harbour of the island, 50 km southern the monitoring site.
The intercomparison exercise consisted of three periods of collocated measurements of OH reactivity (between 8 and 9 July, between 10 and 11 July and during 12–13 July) and tests to evaluate the data processing using a common proce-dure.
During these days, ambient reactivity was close to the LOD of the systems; therefore we decided to measure the re-activity of a plant species close to our trailers and known to emit highly reactive compounds as monoterpenes (Bracho-Nunez et al., 2011). The plant we chose is a Rosmarinus
of-ficinalis, commonly known as rosemary, found in low shrubs
with evergreen needle-like leaves and native to the Mediter-ranean region.
For this experiment, we placed our inlets in a small enclo-sure constructed from a PET flask and showed to not inter-fere with ambient measurements. We chose it to prevent the sampling lines from rain and wind exposure and concentrate the emissions from the plant. From time to time we induced higher emissions by applying some mechanical stress (for instance by scraping or cutting some small branches); hence the results reported in the next section are not indicative for the plant’s natural emissions. Figure 4 shows a top view of the field site and respective position of the two instruments.
3 Results and discussion
In the following section we present results of the intercom-parison exercise and tests run on the two instruments to de-fine a common and consistent approach to evaluate the data of OH reactivity. Tests include measurement of C1 according to the conventional approach presented in the experimental section and reported by Sinha et al. (2008) as well as mea-surement of C1 according to a new approach based on the use of an OH scavenger. We show results from collocated measurements of OH reactivity and the corrections needed for both instruments, and how corrections influence the cor-relation of the results of the two instruments.
3.1 C1 acquired with the conventional and scavenger approaches
The initial concentration of pyrrole, named C1, is usually measured when pyrrole is mixed with dry zero air and dry ni-trogen, with the mercury lamp on. However, switching from humid to dry air to get a complete drying of the reactor can often be time consuming, especially when the instrument is operating on the field.
For this reason we conducted the experiment to inject a known amount of a scavenger molecule, in this case methane, into the CRM reactors to reach a mixing ratio of approxi-mately 3 % by volume.
Figure 5 shows three measurements of C1 performed with
CRM- LSCE at flow rates of 12, 8, and 0.014 sL min−1
of methane mixed in a total flow of about 0.330 sL min−1,
leading to CH4 mixing ratios of 3.4, 2.3 and 4.0 %
respec-tively. At 11:30 (CEST), the PTR-MS was measuring C2, the cell was wet, pyrrole mixing ratio was 24.3 ± 0.4 ppbv
and m/z 37 signal was 1.25 × 10⁶cps. At 11:40 we
in-jected methane at the three flow rates indicated above and pyrrole mixing ratio increased to 73.5 ± 0.6, 71 ± 0.5 and 72.6 ± 2.9 ppbv inside the cell. It can be noticed, that we measured the same concentration of pyrrole when different flow rates of methane were added into the reactor, suggest-ing that only a negligible fraction of OH reacts with pyrrole and most of OH is scavenged by methane.
C1 was then also acquired under dry conditions, with
m/z37 being 2.35 × 10⁵cps, i.e. 1 order of magnitude lower
than under wet conditions, at time 12.30. In this case, the pyrrole mixing ratio reached 73.8 ± 2.9 ppbv, which is not significantly different from the concentration measured using the scavenger approach. In this specific experiment, the ac-quisition of C1 with the usual approach took approximately 20 min, this time can vary to hours depending on the reactor design and coating.
For the CRM-LSCE instrument, similar values of C1 were found using both methodologies, highlighting the feasibility of the scavenger approach. Similar tests performed on the CRM-MD instrument showed significant differences in C1 values measured using the two approaches, with higher C1 values when the scavenger was used. This disagreement is likely due to difficulties to completely dry the reactor for the CRM-MD instrument, leading to the formation of OH from the photolysis of residual water molecules, which in turn leads to an underestimation of C1. The scavenger ap-proach appeared to give a more robust determination of C1 for this instrument. Similar tests were also conducted in the laboratory after the ChArMEx field campaign using propane as a scavenger (at approximately 900 ppmv), showing con-sistent results with field observations.
The scavenger approach appears to be more suitable for field deployments than the conventional approach for CRM instruments, where drying requires more than an hour, since it allows faster C1 measurements (response in a few minutes against hours depending on the reactor’s conditions), allow-ing more frequent checks of pyrrole stability without impair-ing ambient measurements of OH reactivity.
3.2 Assessment of the correction for humidity differences between C2 and C3
As mentioned in Sect. 2.2, the correction on the C2 mea-surement aims at reducing artifacts due to different humidity
Figure 4. Top view of the field site at Cape Corsica. Relative distances between the trailers containing the instruments, details of the instruments and sampled plant species are provided.
80 60 40 20 0 m/z 68 (ppbv) 11:30 AM 7/15/2013 12:00 PM 12:30 PM 1:00 PM 1:30 PM 1.4x10⁶ 1.2 1.0 0.8 0.6 0.4 m/z 37 (cps) C1 methane C1 original m/z 68 m/z 37
Figure 5. Comparison between C1 acquired with the OH scavenger approach and with the original approach. Values of m/z 37 refer to the protonated first water cluster which is used as tracer for abso-lute humidity in the system and depends on PTR-MS operational conditions, in our case E/N = 120 Td.
levels between C2 and C3 measurements. While differences in humidity are already reduced using a catalytic converter to generate zero air from ambient air, small differences are still observed on the m37/m19 ratio, which in turn can lead to significant errors in OH reactivity measurements if C2 is not corrected.
Both CRM instruments were characterized in the labora-tory and several times during the field experiment to quantify the C2-dependence on humidity.
Calibrations for humidity consist of modulating the hu-midity of wet zero air flowing inside the reactor while record-ing C2 by mixrecord-ing the wet zero air with dry zero air at differ-ent ratios inside the reactor. In this way, we monitor C2
(am-bient humidity) and C2∗(ambient humidity mixed with dry
synthetic air) signals, and alternate rapidly between them to avoid any interference from local ambient humidity changes. Values of C2 acquired in this way are plotted vs. the
normal-ized counts of the first water cluster (m37/m19) during C2 as shown in Fig. 2. A linear least squares fit of m/z 68 (during C2) vs. m37/m19 (during C2) provide the equation used to correct C2 as described in Sect. 2.2.
We performed simultaneous measurements of OH reactiv-ity during 8–13 July 2013 and processed the raw data as re-ported in Sect. 2.2. We found that the correction for humidity differences applied to the raw data sets has an average impact of 12 % for CRM-LSCE and 4 % for CRM-MD (see Table 2). Interestingly, these corrections resulted in an increase of the LSCE measurements and in a decrease of the CRM-MD measurements. We believe that this opposite behaviour was due to a difference we had in the sampling set-up. CRM-LSCE usually operates with a PTFE filter at the inlet of the sampling line to prevent atmospheric particles entering the reactor; while CRM-MD did not use any filter for the inter-comparison exercise. The PTFE filter might have act as water reservoir; retaining water vapours when the air was very hu-mid and releasing water vapours when the air was dry. There-fore, using a filter at the inlet leads to both C2 drier or more humid than C3, depending on atmospheric conditions; while C2 of CRM-MD was always more humid than ambient air.
3.3 Assessment of the correction for the kinetics regime
As mentioned in Sect. 2.2, we use an experimental ap-proach to estimate the correction factor that is needed to account for the deviation from pseudo first order kinetics during ambient measurements of OH reactivity. We intro-duced a known amount of OH reactivity prointro-duced by dif-ferent gas standards in the reactors, including ethane and propane for both CRM instruments during the intercom-parison on the field. Additional gases were also used dur-ing laboratory testdur-ing, before or after the field intercompari-son, including isoprene for CRM-LSCE and ethene, propene,
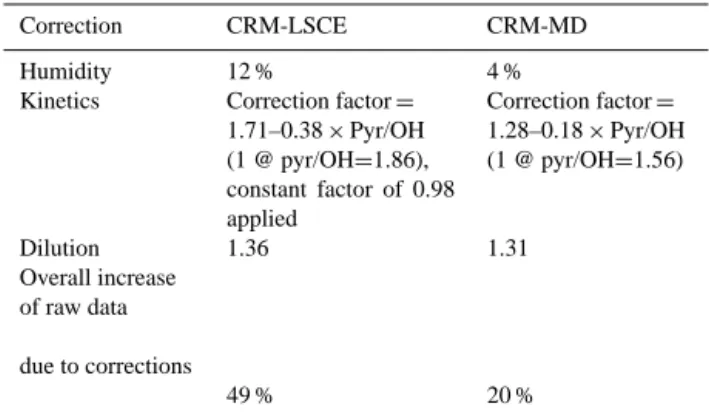
Table 2. Summary of correction stages applied to raw reactivity data for CRM-LSCE and CRM-MD. Correction coefficients are ob-tained from experiments as described in the section data analysis.
Correction CRM-LSCE CRM-MD
Humidity 12 % 4 %
Kinetics Correction factor = 1.71–0.38 × Pyr/OH (1 @ pyr/OH=1.86), constant factor of 0.98 applied Correction factor = 1.28–0.18 × Pyr/OH (1 @ pyr/OH=1.56) Dilution 1.36 1.31 Overall increase of raw data due to corrections 49 % 20 %
and isoprene for CRM-MD. These standards are intended to be representative for the range of reactivity of ambient trace gases with OH (bimolecular rate constants in the range
10−13–10−10cm3molecule−1s−1). Moreover, the standard
of ethane used in the field and during laboratory tests was the same one for both instruments.
Tests made with gas standards covered a range of OH
reactivity from the LOD (≈ 3 s−1, 3σ ) up to 300 s−1. A
smaller range of OH reactivity was investigated on
CRM-MD with values ranging from the LOD (≈ 3 s−1, 3σ ) up
to 65 s−1. However, tests performed in the laboratory using
complex mixtures of NHMCs (non-methane hydrocarbons) and OVOCs (oxygenated volatile organic compounds) (see supplementary material of Michoud et al., 2015) showed that CRM-MD correctly measures higher OH reactivity values, with a linear response of the instrument up to approximately
900 s−1. The range of pyrrole-to-OH ratios investigated
dur-ing these tests ranges from 1.2 to 2.6, which is within the range of pyrrole-to-OH ratios observed during ambient mea-surements at Cape Corsica (1.2–2.6 for CRM-LSCE and 1.5– 2.1 for CRM-MD).
Figure 6 shows results from the calibrations made for both CRMs on the field, using ethane (hollow circles) and propane (full circles) as gas standards. It is interesting to notice that the correction factor for both instruments seems to follow a linear dependency with the pyrrole-to-OH ratio inside the reactor. In particular, the correction factor decreases when higher ratios are achieved inside the reactor. This behaviour was shown to be reasonably well reproduced by modelling the chemistry inside the CRM (Michoud et al., 2015). More-over, calibrations on CRM-LSCE reveal that a correction fac-tor of 1 is reached for a pyrrole-to-OH ratio of 1.86, while CRM-MD reaches 1 at a ratio of 1.56. However, for pyrrole-to-OH in the range 1.2–2.6 as the one of this study and showed in Fig. 6, such linear dependency seems to be fairly
significant only for CRM-MD (R2=0.546), while it is not
relevant for CRM-LSCE (R2=0.206). Therefore the data
set from CRM-MD was corrected with the equation from the
1.4 1.2 1.0 0.8 0.6 0.4 0.2 0.0 Correction factor 2.6 2.4 2.2 2.0 1.8 1.6 1.4 1.2 Pyrrole/OH ethane CRM MD propane CRM MD fit CRM MD ethane CRM LSCE propane CRM LSCE fit CRM LSCE CRM-MD y=(-0.18 ± 0.08)x + 1.29 ± 0.14 R2=0.546 CRM-LSCE y=(-0.38 ± 0.23)x + 1.71 ± 0.39 R2=0.206
Figure 6. Correction factor of reactivity for the kinetics regime re-ported vs. pyrrole-to-OH ratio in the reactors. Correction for CRM-LSCE is represented in red while correction for CRM-MD is repre-sented in blue. Full circles refer to the experiments conducted with propane while hollow circles refer to the experiments with ethane as gas standard. Linear fits include coefficient values ± 1σ .
linear fit reported on Fig. 6 while the data set from CRM-LSCE was corrected with a mean value of the correction fac-tors obtained from the experiments conducted on the field. Since we obtained close corrections for our data sets (0.98 correction factor for CRM-LSCE, 0.97 for CRM-MD on av-erage), this data processing did not substantially influence the correlation between the results from the two instruments. Table 2 reports a summary of the corrections resulting from our tests and their impact on the measures.
The second important point to notice from Fig. 6 is the larger variability in correction factors from the experiments observed for CRM-LSCE compared to CRM-MD (1σ on the correction factor equals to 0.22 for CRM-LSCE and 0.07 for CRM-MD). We think that the main difference is attributable to a possible different mixing efficiency occurring inside the reactors where the two arms for air and nitrogen/OH are pointing. Although our reactors have the same shape, cov-ering material and same flow rates injected, we suspect that even small differences in the length and pointing of the injec-tion arms inside the reactor might provoke a different mix-ing and hence radical segregation inside the two systems. These differences in radical segregation could lead to dif-ferences in kinetics inside the two reactors. We need to fur-ther investigate different reactors to actually verify this hy-pothesis. To prevent that such small differences determine a wrong interpretation of the measured reactivity we con-sider therefore important that each CRM undergoes the ex-perimental quantification of this correction factor; not only to assess the right correction for the kinetics regime but also to determine the specific reactor performance. Propane and ethane also showed slightly different behaviour when used as test gases for the CRM calibration. Different rate coefficients with OH could explain this behaviour, since for the same in-jected reactivity different concentration of the selected test gas are needed, hence the higher the concentration the closer
the system is in the pseudo first order kinetics assumption. Additional experimental tests performed in the laboratory with a more reactive test gas as isoprene, and by modelled results of compounds with different reactivity conducted in the same pyrrole/OH range and discussed in the paper of Mi-choud et al. (2015), supported this hypothesis. However, the larger variability in the correction factors from all experimen-tal field tests (propane and ethane) makes differences among test gases behaviour not significant in the evaluated range of pyrrole/OH, hence a mean value or a linear fit including all experimental results is suitable to correct the reactivity.
3.4 Correction for dilution
After corrections on C2 for changes in humidity between C2 and C3, and on the reactivity for deviations from the pseudo first order kinetics, we accounted for the dilution of the spled air inside our reactors to determine the reactivity in am-bient air. As mentioned in Sect. 2.2, such correction is calcu-lated from the sampled flow rate of ambient air and the total flow rate within the reactor. Factors of 1.36 and 1.31 were calculated for CRM-LSCE and CRM-MD respectively, and a similar increase of our final data is therefore obtained.
3.5 Measurement uncertainty
Processed reactivity data are subject to three types of correc-tions, which impact the final result by 49 % for CRM-LSCE and 20 % by CRM-MD (Table 2). Among the discussed cor-rections, humidity differences play a more important role for CRM-LSCE while the other corrections influence the mea-surements from both instruments in a similar manner due to similar operating conditions.
Overall uncertainties include systematic errors and pre-cision and were estimated according to the calculation de-scribed by Michoud et al. (2015). Systematic errors origi-nates from the uncertainty on the rate coefficient between
pyrrole and OH, kpyrrole+OH, the uncertainty associated to
the pyrrole standard, the stability of the PTR-MS sensitiv-ity over time, the humidsensitiv-ity and pseudo first order corrections described above and the correction for dilution. Such uncer-tainty is estimated to be 35 % for CRM-LSCE and 18 % for CRM-MD. Differences between instruments are due to the different uncertainties on the concentration of pyrrole in the standard cylinder (20 % for LSCE while 5 % for CRM-MD) and on the correction factor assessed for the kinetics regime (26 % for CRM-LSCE while 9 % for CRM-MD). The measurement precision depends on the concentration levels C1, C2, C3. The random error from precision dominates in
the low range of OH reactivity (below 15 s−1)while
system-atic errors dominates for higher OH reactivity values. Over-all uncertainty (systematic and precision) for this specific ex-periment, were estimated to be below 35 % on average for
CRM-LSCE for OH reactivity values higher than 8 s−1and
approximately 18 % for CRM-MD when OH reactivity
val-ues are higher than 15 s−1. For lower OH reactivity the
over-all uncertainty increases up to 50 % at the LOD of 3 s−1(3σ )
for both instruments (Michoud et al., 2015).
3.6 Intercomparison of OH reactivity results
Simultaneous measurements of OH reactivity with CRM-LSCE and CRM-MD were conducted between the 8 and 13 July, 2013; the processing of the raw data was discussed in Sects. 3.2–3.5.
Figure 7 shows the correlation between reactivity data col-lected by CRM-LSCE (y axes) and CRM-MD (x axes) from their sampling (panel a, raw data) throughout their process-ing (panel b and c, respectively data corrected for humid-ity differences and data corrected for deviation from the as-sumed kinetics) to the final results (panel d, reactivity in am-bient air). Data points include three different sampling pe-riods: a first plant enclosure test during 8–9 July, ambient measurements between 10–11 July, and a second plant enclo-sure test between 12 and 13 July. As previously mentioned, to produce higher reactivity than ambient levels and extend our range of values for comparison we applied some stress on the plant to induce the emission of high levels of reac-tive compounds. In turn, our instruments responded to these high levels with small delays, and data acquisition was not perfectly synchronized, despite the fact that we achieved a residence time in the sampling lines on the same order of magnitude (12 s for CRM-LSCE and 13 s for CRM-MD). By consequence, small delays resulted in significant differ-ences for high values of OH reactivity. We smoothed such differences considering thirty minutes averages of the mea-surements. Scatter plots therefore report all the data points obtained from our intercomparison experiment (190 points) and the agreement is quantified using linear least squares fit according to
kOHCRM−LSCE=b · kOHCRM−MD+a. (5)
Text boxes in Fig. 7 report an equation for each correlation plot, 1σ standard deviation on the equation coefficients and
the determination coefficients R2for the proportion of
vari-ability in the data sets.
These panels show a stepwise (A→D) increase in the level of correlation and a slight decrease in variability among data sets from the two instruments when each correction is subse-quently applied. During the sampling, CRM-LSCE measured a lower reactivity compared to CRM-MD (19 % lower for the whole raw data set). Corrections for humidity changes and deviation from pseudo first order kinetics brought the results closer, with a difference of only 4 %. Finally, panel d shows that the correlation between the two data sets when the cor-rection for ambient air dilution is applied is described by a
slope of 1 and a coefficient R2of 0.75; which demonstrates
that the results from the two instruments agree very well within the instrumental uncertainty. A linear least squares fit is also applied to the same data sets in a narrower range of
50 40 30 20 10 0 50 40 30 20 10 0 50 40 30 20 10 0 50 40 30 20 10 0 300 250 200 150 100 50 0
Total OH reactivity CRM LSCE (s
-1 ) 300 200 100 0 300 250 200 150 100 50 0 300 200 100 0 300 200 100 0 300 200 100 0 300 200 100 0 300 200 100 0 Total OH reactivity CRM MD (s-1) A B C D a=0.17 ± 3.44 b=0.80 ± 0.06 R2=0.706 a=2.88 ± 4.06 b=0.94 ± 0.08 R2=0.696 a=2.29 ± 4.02 b=0.95 ± 0.08 R2=0.702 a=1.61 ± 4.64 b=1.00 ± 0.07 R2=0.717 a=0.57 ± 1.46 b=0.74 ± 0.07 R2=0.667 a=-0.45 ± 2.38 b=0.96 ± 0.12 R2=0.543 E F
Figure 7. Linear least squares fits of total OH reactivity measured by CRM-LSCE vs. Total OH reactivity measured by CRM-MD. Panels from top left to bottom right show: correlation among raw results (a); correlation among data corrected for humidity (b); correlation among data corrected for humidity and deviation from pseudo first order kinetics (c); correlation among data corrected for humidity; kinetics regime and dilution inside the reactor (d); correlation among raw values in the range 0–50 s−1(e); correlation among final values in the range 0– 50 s−1. (f). Coefficient values are extracted from the equation: OH reactivity CRM-LSCE = b(OH reactivity CRM-MD) + a and report 1σ standard deviation. The regressions are applied to the values above the instrumental LOD only.
reactivity values between 0 and 50 s−1which is more
rele-vant for the ambient OH reactivity values at the field site. For this range of values the variability among data is higher
compared to the data points in the range 0–300 s−1(R2from
0.667 to 0.543 vs. R2 from 0.706 to 0.717). However, the
agreement among CRM-LSCE and CRM-MD reactivity data sets also increases with the corrections applied when the 0–
50 s−1range is considered. From the raw data to the final
cor-rected reactivity in the interval 0–50 s−1the slope of the fits
varies from 0.74 (raw data), 0.93 (humidity corrected data), 0.92 (kinetics corrected data) to 0.96 (dilution corrected, final result). Therefore the two data sets show a good agreement, within the instrumental uncertainties, also for reactivity
val-ues below 50 s−1.
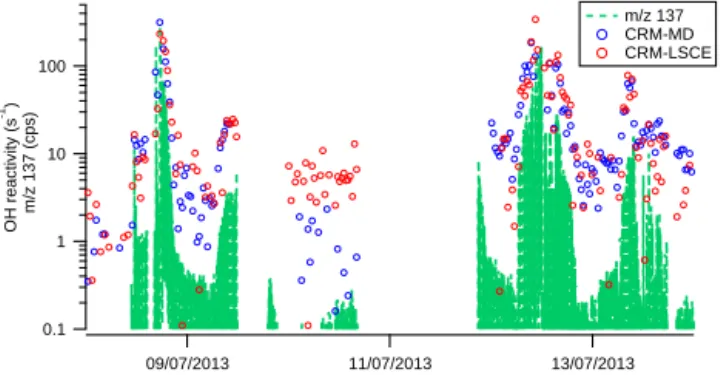
Figure 8 shows the time series of ambient OH reactivity measured by CRM-LSCE (red data points) and CRM-MD (blue data points). Data points refer to fully corrected results from the three periods of exercise including plant enclosure and ambient air measurements. The signal measured by the PTR-MS of CRM-LSCE at m/z 137, which corresponds to the unfragmented protonated mass of total monoterpenes, is also reported as a reference for reactive biogenic VOCs, in particular for the plant enclosure test. Peaks emerging during the plant enclosure tests were obtained from induced plant emissions (8–9 July and 12–13 July). As Fig. 8 shows, OH reactivity peaked when m/z 137 peaked and signals from
CRM-LSCE, CRM-MD and PTR-MS during the whole test exhibit the same variability. The method also demonstrated the real time quick response to the induced plant emissions.
It is worth noticing that this exercise was run on only two instruments which were also operated under similar condi-tions. It would be therefore very interesting to conduct this type of exercises on a larger number of CRMs, operated with different settings and in various environments. This would al-low determining work cases when different corrections need to be applied and getting more insights on the impact they have on reactivity. However, intercomparison exercises for CRM instruments alone cannot help identifying specific and still unknown analytical issues for this technique. Therefore, experiments involving CRM and other techniques would be of greater interest.
4 Summary and conclusions
Our study presents results of the first intercomparison ex-ercise reported on two Comparative Reactivity Method in-struments assembled in different laboratories and used un-der similar operating conditions at the field site of Ersa, Cape Corsica, France. The two instruments discussed here are CRM-LSCE and CRM-MD, from the laboratories LSCE (Laboratoire des Sciences du Climat et de l’ Environnement)
0.1 1 10 100 OH reactivity (s -1) m/z 137 (cps) 09/07/2013 11/07/2013 13/07/2013 m/z 137 CRM-MD CRM-LSCE
Figure 8. Time series of enclosure kOH (8–9 July), ambient kOH (10–11 July), enclosure kOH (12–13 July) measured by CRM-LSCE (red) and CRM-MD (blue). Total monoterpenes signal mea-sured by CRM-LSCE as protonated unfragmented m/z 137 is re-ported with the green line.
and MD (Mines de Douai) where they were assembled. The intercomparison took place during early July 2013 in the frame of the ChArMEx project (Chemistry and Aerosols in a Mediterranean Experiment). It consisted of different calibra-tion and validacalibra-tion tests of the instruments as well as simul-taneous measurements of OH reactivity.
We here present for the first time an alternative approach to rapidly measure the initial concentration of pyrrole (C1) without perturbing the system. The method consists in intro-ducing an OH scavenger in the reactor, when the system is measuring C2 under wet conditions. The scavenger, methane in this study, reacts with most of the OH radicals available for reaction with pyrrole and/or any other ambient molecule. Therefore, even if the cell is wet, and OH radicals are pro-duced, the amount of pyrrole reacting with OH is negligible, and its actual level would be C1. The main advantage of this alternative approach is a substantial reduction in the condi-tioning time from several 10s of minutes to a few minutes. Such improvement is particularly useful during field works.
We document in detail the corrections needed to treat a data set of reactivity measured by CRM and use an alter-native experimental approach to correct for deviations from first order kinetics. Humidity differences between C2 and C3 arise even when using a catalytic converter to generate zero air. The corrections applied for humidity influence the raw data of 4 % (CRM-MD) and 12 % (CRM-LSCE) on average. We showed how the instruments response changed by intro-ducing known amounts of reactivity in the kinetics regime of pyrrole-to-OH ratios ranging from 1.2–2.6. In particular, we saw that the correction factor needed to account for a devia-tion from pseudo first order condidevia-tions is close to unity.
When the three corrections for humidity differences, de-viations from first order kinetics, and dilution are applied they have an average impact on the two data sets of 20 % for CRM-MD and 49 % for CRM-LSCE.
We also tested the ability of the two instruments in mea-suring OH reactivity over a broad range of values from the
instruments LOD (3 s−1)to approximately 300 s−1.
Correla-tions between 30 min averaged data resulted in CRM LSCE measurements being extremely close to CRM MD measure-ments, a correlation described by a linear least squares fit
with a slope of 1 and a R2of 0.75. This excellent agreement
among our results consolidates the robustness of the compar-ative reactivity method to measure OH reactivity. Our study also stresses out the intensive data processing for this method and the importance of a proper determination of each correc-tion needed to process the data for each instrument.
Finally, more intercomparison exercises among CRM in-struments, and among different methods used to measure OH reactivity would be of great interest to evaluate the limita-tions and strengths of this technique.
Acknowledgements. This study was supported by the European
Commission’s 7th Framework Programme under grant agreement number 287382 “PIMMS” and under grant agreement number 293897, “DEFIVOC”. Financial support was also received from ChArMEx, PRIMEQUAL CARBO-SOR, CNRS, CEA, and the CaPPA project (chemical and physical properties of atmosphere), which is funded by the French National Research Agency (ANR) through PIA (Programme d’Investissement d’Avenir) under contract ANR-11-LABX-0005-01 and by the Regional Council Nord-Pas de Calais and the European Funds for Regional Eco-nomic Development (FEDER). We thank F. Dulac, E. Hamonou for managing the ChArMEx project and A. Borbon for the CARBO-SOR project, as well as all the scientists, engineers and students involved in the field campaign at Cape Corsica for their support. We acknowledge J. Williams and his group at MPIC for providing the glass reactors for our instruments.
Edited by: C. Reeves
References
Ammann, C., Brunner, A., Spirig, C., and Neftel, A.: Technical note: Water vapour concentration and flux measurements with PTR-MS, Atmos. Chem. Phys., 6, 4643–4651, doi:10.5194/acp-6-4643-2006, 2006.
Archibald, A. T., Petit, A. S., Percival, C. J., Harvey, J. N., and Shallcross, D. E.: On the importance of the reaction be-tween OH and RO2 radicals, Atmos. Sci. Lett., 10, 102–108,
doi:10.1002/asl.216, 2009.
Atkinson, R., Aschmann, S. M., Winer, A. M., and Carter, W. P. L.: Rate constants for the gas phase reactions of OH radicals and O3 with pyrrole at 295 ± 1 K and atmospheric pressure, Atmos. Environ., 18, 2105–2107, doi:10.1016/0004-6981(84)90196-3, 1984.
Atkinson, R., Baulch, D. L., Cox, R. A., Crowley, J. N., Hampson, R. F., Hynes, R. G., Jenkin, M. E., Rossi, M. J., and Troe, J.: Eval-uated kinetic and photochemical data for atmospheric chemistry: Volume III – gas phase reactions of inorganic halogens, Atmos. Chem. Phys., 7, 981–1191, doi:10.5194/acp-7-981-2007, 2007. Bracho-Nunez, A., Welter, S., Staudt, M., and Kesselmeier, J.:
young and mature leaves of Mediterranean vegetation, J. Geo-phys. Res.-Atmos., 116, D16304, doi:10.1029/2010JD015521, 2011.
Calpini, B., Jeanneret, F., Bourqui, M., Clappier, A., Vajtai, R., and van den Bergh, H.: Direct measurement of the total re-action rate of OH in the atmosphere, Analusis, 27, 328–336, doi:10.1051/analusis:1999270328, 1999.
Di Carlo, P. D., Brune, W. H., Martinez, M., Harder, H., Lesher, R., Ren, X., Thornberry, T., Carroll, M. A., Young, V., Shepson, P. B., Riemer, D., Apel, E., and Campbell, C.: Missing OH Reactiv-ity in a Forest: Evidence for Unknown Reactive Biogenic VOCs, Science, 304, 722–725, doi:10.1126/science.1094392, 2004. Dillon, T. J., Tucceri, M. E., Dulitz, K., Horowitz, A., Vereecken,
L., and Crowley, J. N.: Reaction of Hydroxyl Radicals with C4H5N (Pyrrole): Temperature and Pressure Depen-dent Rate Coefficients, J. Phys. Chem. A, 116, 6051–6058, doi:10.1021/jp211241x, 2012.
Dolgorouky, C., Gros, V., Sarda-Esteve, R., Sinha, V., Williams, J., Marchand, N., Sauvage, S., Poulain, L., Sciare, J., and Bonsang, B.: Total OH reactivity measurements in Paris during the 2010 MEGAPOLI winter campaign, Atmos. Chem. Phys., 12, 9593– 9612, doi:10.5194/acp-12-9593-2012, 2012.
Dusanter, S., Vimal, D., Stevens, P. S., Volkamer, R., and Molina, L. T.: Measurements of OH and HO2concentrations during the
MCMA-2006 field campaign – Part 1: Deployment of the Indiana University laser-induced fluorescence instrument, Atmos. Chem. Phys., 9, 1665–1685, doi:10.5194/acp-9-1665-2009, 2009. Faloona, I. C., Tan, D., Lesher, R. L., Hazen, N. L., Frame,
C. L., Simpas, J. B., Harder, H., Martinez, M., Carlo, P. D., Ren, X., and Brune, W. H.: A Laser-induced Fluorescence Instrument for Detecting Tropospheric OH and HO2:
Char-acteristics and Calibration, J. Atmos. Chem., 47, 139–167, doi:10.1023/B:JOCH.0000021036.53185.0e, 2004.
Fittschen, C., Whalley, L. K., and Heard, D. E.: The Reaction of CH3O2 Radicals with OH Radicals: A Neglected Sink for CH3O2in the Remote Atmosphere, Environ. Sci. Technol., 48,
7700–7701, doi:10.1021/es502481q, 2014.
Fuchs, H., Hofzumahaus, A., Rohrer, F., Bohn, B., Brauers, T., Dorn, H.-P., Häseler, R., Holland, F., Kaminski, M., Li, X., Lu, K., Nehr, S., Tillmann, R., Wegener, R., and Wahner, A.: Experimental evidence for efficient hydroxyl radical re-generation in isoprene oxidation, Nat. Geosci., 6, 1023–1026, doi:10.1038/ngeo1964, 2013.
Goldstein, A. H. and Galbally, I. E.: Known and Unexplored Or-ganic Constituents in the Earth’s Atmosphere, Environ. Sci. Technol., 41, 1514–1521, doi:10.1021/es072476p, 2007. Hansen, R. F., Griffith, S. M., Dusanter, S., Rickly, P. S., Stevens,
P. S., Bertman, S. B., Carroll, M. A., Erickson, M. H., Flynn, J. H., Grossberg, N., Jobson, B. T., Lefer, B. L., and Wallace, H. W.: Measurements of total hydroxyl radical reactivity during CABINEX 2009 – Part 1: field measurements, Atmos. Chem. Phys., 14, 2923–2937, doi:10.5194/acp-14-2923-2014, 2014. Hansen, R. F., Blocquet, M., Schoemaecker, C., Léonardis, T.,
Locoge, N., Fittschen, C., Hanoune, B., Stevens, P. S., Sinha, V., and Dusanter, S.: Intercomparison of the comparative reac-tivity method (CRM) and pump-probe technique for measuring total OH reactivity in an urban environment, Atmos. Meas. Tech. Discuss., 8, 6119–6178, doi:10.5194/amtd-8-6119-2015, 2015.
Hens, K., Novelli, A., Martinez, M., Auld, J., Axinte, R., Bohn, B., Fischer, H., Keronen, P., Kubistin, D., Nölscher, A. C., Os-wald, R., Paasonen, P., Petäjä, T., Regelin, E., Sander, R., Sinha, V., Sipilä, M., Taraborrelli, D., Tatum Ernest, C., Williams, J., Lelieveld, J., and Harder, H.: Observation and modelling of HOx radicals in a boreal forest, Atmos. Chem. Phys., 14, 8723–8747, doi:10.5194/acp-14-8723-2014, 2014.
Hofzumahaus, A., Rohrer, F., Lu, K., Bohn, B., Brauers, T., Chang, C.-C., Fuchs, H., Holland, F., Kita, K., Kondo, Y., Li, X., Lou, S., Shao, M., Zeng, L., Wahner, A., and Zhang, Y.: Amplified Trace Gas Removal in the Troposphere, Science, 324, 1702– 1704, doi:10.1126/science.1164566, 2009.
Ingham, T., Goddard, A., Whalley, L. K., Furneaux, K. L., Edwards, P. M., Seal, C. P., Self, D. E., Johnson, G. P., Read, K. A., Lee, J. D., and Heard, D. E.: A flow-tube based laser-induced fluo-rescence instrument to measure OH reactivity in the troposphere, Atmos. Meas. Tech., 2, 465–477, doi:10.5194/amt-2-465-2009, 2009.
Jeanneret, F., Kirchner, F., Clappier, A., van den Bergh, H., and Calpini, B.: Total VOC reactivity in the planetary boundary layer: 1. Estimation by a pump and probe OH experiment, J. Geophys. Res.-Atmos., 106, 3083–3093, doi:10.1029/2000JD900602, 2001.
Kim, S., Guenther, A., Karl, T., and Greenberg, J.: Contributions of primary and secondary biogenic VOC tototal OH reactivity dur-ing the CABINEX (Community Atmosphere-Biosphere INterac-tions Experiments)-09 field campaign, Atmos. Chem. Phys., 11, 8613–8623, doi:10.5194/acp-11-8613-2011, 2011.
Kovacs, T. A. and Brune, W. H.: Total OH Loss Rate Measurement, J. Atmos. Chem., 39, 105–122, doi:10.1023/A:1010614113786, 2001.
Kumar, V. and Sinha, V.: VOC–OHM: A new technique for rapid measurements of ambient total OH reactivity and volatile organic compounds using a single proton transfer reaction mass spectrometer, Int. J. Mass Spectrom., 374, 55–63, doi:10.1016/j.ijms.2014.10.012, 2014.
Lindinger, W. and Jordan, A.: Proton-transfer-reaction mass spec-trometry (PTR–MS): on-line monitoring of volatile organic compounds at pptv levels, Chem. Soc. Rev., 27, 347–375, doi:10.1039/A827347Z, 1998.
Lou, S., Holland, F., Rohrer, F., Lu, K., Bohn, B., Brauers, T., Chang, C.C., Fuchs, H., Häseler, R., Kita, K., Kondo, Y., Li, X., Shao, M., Zeng, L., Wahner, A., Zhang, Y., Wang, W., and Hofzumahaus, A.: Atmospheric OH reactivities in the Pearl River Delta – China in summer 2006: measurement and model results, Atmos. Chem. Phys., 10, 11243–11260, doi:10.5194/acp-10-11243-2010, 2010.
Martinez, M., Harder, H., Kovacs, T. A., Simpas, J. B., Bassis, J., Lesher, R., Brune, W. H., Frost, G. J., Williams, E. J., Stroud, C. A., Jobson, B. T., Roberts, J. M., Hall, S. R., Shetter, R. E., Wert, B., Fried, A., Alicke, B., Stutz, J., Young, V. L., White, A. B., and Zamora, R. J.: OH and HO 2
concentra-tions, sources, and loss rates during the Southern Oxidants Study in Nashville, Tennessee, summer 1999, J. Geophys. Res., 108, 4617, , doi:10.1029/2003JD003551, 2003.
Mao, J., Ren, X., Brune, W. H., Olson, J. R., Crawford, J. H., Fried, A., Huey, L. G., Cohen, R. C., Heikes, B., Singh, H. B., Blake, D. R., Sachse, G. W., Diskin, G. S., Hall, S. R., and Shetter, R. E.: Airborne measurement of OH reactivity during INTEX-B,
Atmos. Chem. Phys., 9, 163–173, doi:10.5194/acp-9-163-2009, 2009.
Michoud, V., Hansen, R. F., Locoge, N., Stevens, P. S., and Du-santer, S.: Detailed characterizations of the new Mines Douai comparative reactivity method instrument via laboratory ex-periments and modeling, Atmos. Meas. Tech., 8, 3537–3553, doi:10.5194/amt-8-3537-2015, 2015.
Nölscher, A. C., Sinha, V., Bockisch, S., Klüpfel, T., and Williams, J.: Total OH reactivity measurements using a new fast Gas Chro-matographic Photo-Ionization Detector (GC-PID), Atmos. Meas. Tech., 5, 2981–2992, doi:10.5194/amt-5-2981-2012, 2012a. Nölscher, A. C., Williams, J., Sinha, V., Custer, T., Song, W.,
John-son, A. M., Axinte, R., Bozem, H., Fischer, H., Pouvesle, N., Phillips, G., Crowley, J. N., Rantala, P., Rinne, J., Kulmala, M., Gonzales, D., Valverde-Canossa, J., Vogel, A., Hoffmann, T., Ouwersloot, H. G., Vilà-Guerau de Arellano, J., and Lelieveld, J.: Summertime total OH reactivity measurements from boreal forest during HUMPPA-COPEC 2010, Atmos. Chem. Phys., 12, 8257–8270, doi:10.5194/acp-12-8257-2012, 2012b.
Nölscher, A. C., Bourtsoukidis, E., Bonn, B., Kesselmeier, J., Lelieveld, J., and Williams, J.: Seasonal measurements of to-tal OH reactivity emission rates from Norway spruce in 2011, Biogeosciences, 10, 4241–4257, doi:10.5194/bg-10-4241-2013, 2013.
Paulson, S. E., Chung, M. Y., and Hasson, A. S.: OH Radical For-mation from the Gas-Phase Reaction of Ozone with Terminal Alkenes and the Relationship between Structure and Mechanism, J. Phys. Chem. A, 103, 8125–8138, doi:10.1021/jp991995e, 1999.
Sadanaga, Y., Yoshino, A., Watanabe, K., Yoshioka, A., Wakazono, Y., Kanaya, Y., and Kajii, Y.: Development of a measurement system of OH reactivity in the atmosphere by using a laser-induced pump and probe technique, Rev. Sci. Instrum., 75, 2648– 2655, doi:10.1063/1.1775311, 2004.
Sinha, V., Williams, J., Crowley, J. N., and Lelieveld, J.: The Com-parative Reactivity Method – a new tool to measure total OH Reactivity in ambient air, Atmos. Chem. Phys., 8, 2213–2227, doi:10.5194/acp-8-2213-2008, 2008.
Sinha, V., Custer, T. G., Kluepfel, T., and Williams, J.: The effect of relative humidity on the detection of pyrrole by PTR-MS for OH reactivity measurements, Int. J. Mass Spectrom., 282, 108–111, doi:10.1016/j.ijms.2009.02.019, 2009.
Sinha, V., Williams, J., Diesch, J. M., Drewnick, F., Martinez, M., Harder, H., Regelin, E., Kubistin, D., Bozem, H., Hosaynali-Beygi, Z., Fischer, H., Andrés-Hernández, M. D., Kartal, D., Adame, J. A., and Lelieveld, J.: Constraints on instantaneous ozone production rates and regimes during DOMINO derived using in-situ OH reactivity measurements, Atmos. Chem. Phys., 12, 7269–7283, doi:10.5194/acp-12-7269-2012, 2012.
Yoshino, A., Sadanaga, Y., Watanabe, K., Kato, S., Miyakawa, Y., Matsumoto, J., and Kajii, Y.: Measurement of total OH reactiv-ity by laser-induced pump and probe technique—comprehensive observations in the urban atmosphere of Tokyo, Atmos. Environ., 40, 7869–7881, doi:10.1016/j.atmosenv.2006.07.023, 2006.