HAL Id: hal-01517558
https://hal.archives-ouvertes.fr/hal-01517558
Submitted on 9 May 2017
HAL is a multi-disciplinary open access
archive for the deposit and dissemination of sci-entific research documents, whether they are pub-lished or not. The documents may come from teaching and research institutions in France or abroad, or from public or private research centers.
L’archive ouverte pluridisciplinaire HAL, est destinée au dépôt et à la diffusion de documents scientifiques de niveau recherche, publiés ou non, émanant des établissements d’enseignement et de recherche français ou étrangers, des laboratoires publics ou privés.
dopant distribution in Cu-doped Y- stabilized ZrO 2
nanopowders
Nadiia Korsunska, Y. Polishchuk, V. Kladko, Xavier Portier, Larysa
Khomenkova
To cite this version:
Nadiia Korsunska, Y. Polishchuk, V. Kladko, Xavier Portier, Larysa Khomenkova. Thermo-stimulated evolution of crystalline structure and dopant distribution in Cu-doped Y- stabilized ZrO 2 nanopow-ders. Materials Research Express, IOP Publishing Ltd, 2017, 4 (3), pp.035024. �10.1088/2053-1591/aa6093�. �hal-01517558�
1. Introduction
Nowadays, one of the renewable energy technologies is the development of fuel cells, metal-air batteries and water splitting devices [1–4]. However, most of the materials used for these purposes have low catalytic activity, high cost and low durability. For instance, platinum based catalysts, being the most used for oxygen reduction [4], suffer from high cost and scarcity. However, it was demonstrated that platinum-ruthenium nanoparticles can be uniformly distributed in nitrogen-doped graphene aerogel [1]. These materials exhibit an unprecedented performance towards the methanol electrochemical oxidation reaction and can be directly used as the anode of direct methanol fuel cells by simple physical pressing without the need for any binders or additives [1, 2]. On the other hand, the use of non-noble electro-catalysts becomes more and more attractive [5, 6]. For instance, it was proposed to use carbon-based nanoscale metal-organic frameworks with controllable size and shape as the pyrolytic precursors to achieve high performance of oxygen reduction catalysts [7, 8].
The increasing demand for drinking water causes the development of novel approaches for its production, purification and desalinization [9–11]. In this regard, the application of metal oxide nanoparticles (such as TiO2, CeO2, Fe2O3, etc) is attractive. Recently, the graphene-activated metal oxide nanoparticles were used for the capaci-tive deionization of saline water [9]. Besides, promising catalytic properties were observed for carbon-free ZnS/ ZnO hybrid nanoparticles with graded composition [12].
Metal oxide nanoparticles attract also considerable attention due to their peculiar physical and chemical prop-erties in comparison with ordinary metal oxides. Nanopowders and composites on their basis demonstrate unique N Korsunska et al
035024
MRX
© 2017 IOP Publishing Ltd 4
Mater. Res. Express
MRX 2053-1591 10.1088/2053-1591/aa6093 3
1
11
Materials Research Express
15
March
Thermo-stimulated evolution of crystalline structure and dopant
distribution in Cu-doped Y-stabilized ZrO
2
nanopowders
N Korsunska1, Yu Polishchuk1, V Kladko1, X Portier2 and L Khomenkova1
1 V. Lashkaryov Institute of Semiconductor Physics of the National Academy of Sciences of Ukraine, 45 Pr. Nauky, 03028 Kyiv, Ukraine 2 CIMAP Normandie Univ, ENSICAEN, UNICAEN, CEA, CNRS, 6 Boulevard Maréchal Juin, 14050 Caen, France
E-mail: khomen@ukr.net
Keywords: Cu-doped Y-stabilized ZrO2, phase transformation, diffusion, x-ray diffraction, high-resolution transmission electron
microscopy
Abstract
This work deals with the effect of Cu doping on thermal stability of the structural properties of Y-stabilized ZrO2 nanopowders and dopants’ spatial distribution. The powders were synthesized
by a co-precipitation technique, calcinated at Tc = 500–1100 °C during 2 h and studied by x-ray
diffraction (XRD) and transmission electron microscopy. Calcination at Tc = 500 °C results in
the formation of ZrO2 nanocrystals with tetragonal phase predominantly. The shifts of XRD peak
positions of Cu-doped powders to larger angles in comparison with those of Cu-free ones testify to the Cu presence inside nanocrystals. The Tc increase results in two main processes: (i) the
non-monotonic shift of XRD peak positions and (ii) the phase transformation (tetragonal to cubic and both of them to monoclinic). This observation was explained by, at first, Cu atoms incorporation into the nanocrystal volume from the surface complexes (Tc = 500–700 °C) and then their outward
diffusion followed by the formation of crystalline CuO (Tc > 700 °C). Phase transformation sets
in at Tc = 700 °C, when monoclinic phase appears. Its contribution rises till Tc = 1000 °C. The
mechanism of monoclinic phase formation is supposed to be consisted of the out-diffusion of interstitial Cu ions due to their shift from lattice sites. This promotes an appearance of the channels for Y out-diffusion via cation vacancies and results in phase transformation. The sintering process stimulated by CuO formation is proposed to be responsible for appearance of cubic phase at 1000–1100 °C.
PAPER 2017
magnetic, optical, chemical, luminescent, mechanical and thermal properties. Their applications cover also dif-ferent types of sensors, luminescent markers, pigments and image displays, abrasive materials and ceramics, fuel cells and batteries, etc.
Among different metal oxide nanoparticles, ZrO2 has attracted considerable attention because of its mechani-cal, electric, thermal and luminescent properties offering diverse applications such as catalysts, high temperature and corrosion resistant coatings [11, 13], oxygen sensors [14, 15], UV dosimeters [16], biological labelling [17], radiation detectors [18, 19] etc. Different emission bands can be observed in visible spectral range from pure [20], and/or Y-stabilized ZrO2 materials [21, 22] allowing an application of zirconia for white light emitting devices.
In recent years, along with ZrO2, Cu-doped ZrO2 composites have been intensively investigated due to their excel-lent catalytic activity [23–25] and tribological behavior [26]. Besides, the presence of Cu impurity in the monoclinic ZrO2 nanocrystals was recently found to result in the appearance of specific green photoluminescence band [27, 28]. For successful application of these composites, it is necessary to find a way to control the shape and size of the nanoparticles, their surface termination and dopant spatial localization, to minimize nanoparticle agglomeration, to monitor the transformation of crystalline structure caused by high-temperature treatment and to enhance their thermal and chemical stability.
The properties of Cu-doped composites depend on the spatial localization of copper in nanocomposite. Cop-per can locate inside the nanocrystals, being incorporated in their volume [28, 29] or subsurface area, as well as on the crystal surface. Except the luminescence caused by Cu ions in crystal volume [28], the most of interesting properties of Cu-doped zirconia are caused by Cu embedded in its subsurface region [23–25] or located on the crystallite surface [26]. The latter can be found as pure Cu [23], CuO [25, 29] or surface complexes containing Cu [30, 31] and/or different ligands [32]. In particular, surface located CuO serves as lubricant [26, 33] and favors the densification of the ceramics formed from zirconia-based compounds [34], while Cu ions embedded in the surface region of the grains (Cu in the substitutional sites [23], complexes built from Cu cation and oxygen vacancies [24,
30]) were proposed to determine the catalytic activity of composite.
It is known that the composite properties depend also on its structure. Specifically, it was shown [25] that the crystallite phase is the important factor that controls the functional properties of the catalyst. It was reported that Cu/ZrO2 catalyst based on the tetragonal (t) and monoclinic (m) phase of zirconia shows the different activity for methanol synthesis [24], ethanol dehydrogenation [35] and CO oxidation [36]. A number of studies show that among different ZrO2 phases, the tetragonal one exhibits better catalytic properties [37, 38].
It is apparent that the technological procedure (specifically, the method of powder fabrication, doping and calcination temperature) can affect its structure as well as Cu distribution in the composite. One of the ways of tetragonal phase stabilization is the doping of zirconia with elements having lower valences. Usually, the t-ZrO2 phase is stabilized by the Y doping. Thus, the Y-stabilized ZrO2 composites can be considered as a potential support oxide for Cu. However, Cu incorporation results also in m–t transformation [39] or even the appearance of cubic (c) phase [40]. Along with this, co-doping with Cu and Y can affect the structural properties of the composite in comparison with single (Cu or Y) doped zirconia. In fact, ZrO2 doped with 3 mol% of Y conserves the tetragonal phase up to 1000 °C [34, 41] while the co-doping with Cu decreases the temperature of its transformation to mono-clinic one [34]. However the mechanism of this phenomenon was not elucidated. Therefore, the investigation of the structure of co-doped material versus the Cu content as well as the annealing regimes is important. Besides, such experiments can provide information on Cu localization in composite that is essential for its application.
It is worth to note that among different fabrication approaches, co-precipitation technique is rare addressed. However, this method allowed producing the powders with uniform distribution of elements as it was demon-strated for Y-stabilized ZrO2 [20, 42]. Besides this approach allows controlling spatial localization of impurities via monitoring of pH factor of solution. This was demonstrated for Cr-doped and Ag-doped Y-stabilized ZrO2 [41, 43]. In this paper, the effect of both Cu content and calcination temperature on structural properties of Cu-doped Y-stabilized ZrO2 nanopowders prepared by co-precipitation technique was studied by x-ray diffraction and transmission electron microscopy methods.
2. Experimental details
The 3 mol% Y2O3-ZrO2 nanopowders doped with Cu were synthesized by a co-precipitation technique using Zr, Y and Cu nitrates in molar ratio Zr(NO3)2:Y(NO3)3:Cu(NO3)2 = 96:3:1 and 89:3:8 dissolved in distilled water. With such a composition the CuO concentration of 1 mol% (Cu-1 samples) or 8 mol% (Cu-8 samples) was obtained. More details can be found in [28]. The xerogel was calcinated at Tc = 500–1100 °С for 2 h and cooled slowly in the furnace.
Structural properties were studied by x-ray diffraction (XRD), as well as by conventional and high-resolution (HR) transmission electron microscopy (TEM) methods. XRD data were collected in the range of 2Θ = 20–80° using Thermo Scientific ARL X’TRA diffractometer with Cu Kα radiation (λ = 0.154 18 nm) in Bragg
Conventional TEM observations were performed using a 2010 FEG JEOL microscope operated at 200 kV. HREM images and chemical data (EDX maps and HAADF images) were recorded with a double corrected cold FEG ARM200 JEOL microscope operated at 200 kV and equipped with a Centurio EDX JEOL setup.
3. Results
3.1. XRD data
Generally, undoped ZrO2 demonstrates several XRD reflections in the range of 2Θ = 25–80° whose number depends on crystalline structure. The peaks at 2Θ = 28.05°, 31.33°, 33.98°, 34.25°, 35.15°, 35.71°, 49.02°, 49.89°, 50.31°, 59.89°, 60.10°, 61.40°, 74.74° and 75.24° correspond to the monoclinic (m) ZrO2 phase (JCPDS 37-1484) [44], the peaks at 2Θ = 30.4°, 35.5°, 50.5°, 73.05°, 74.58° are from tetragonal (t) phase (JCPDS 80-0784) [45], while for the cubic (c) phase they can be observed at 2Θ = 30.33°, 35.16°, 50.58° and 74.33° (PDF #01-071-4810) [46]. Obviously, most of the peaks resulting from tetragonal and cubic phases are close to each other. Therefore, to discriminate unambiguously these phases, the peaks in the range of 73–75° are usually used [21, 47, 48]. As it was noted above, the cubic phase shows in this range only a single peak at 2Θ ~ 74.33°, while the tetragonal phase demonstrates two peaks at 2Θ ~ 73.05° and 74.58°.
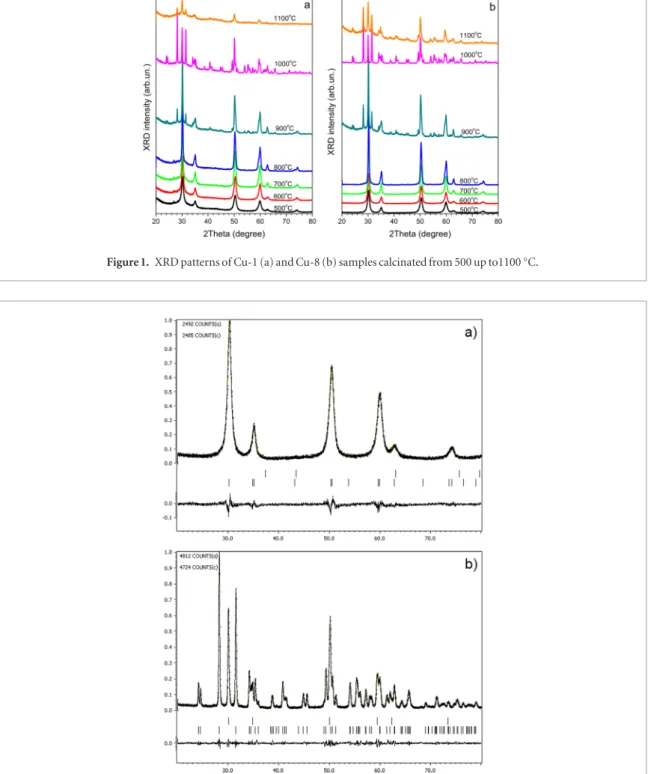
The original xerogels were amorphous (not shown), while calcination procedure results in its crystallization. XRD patterns of Cu-1 and Cu-8 samples calcinated at Tc = 500–1100°С are shown in figure 1. It is seen that the positions of XRD peaks differ from those mentioned above due to the doping of ZrO2.
The Cu-1 and Cu-8 samples calcinated at 500 and 600 °C show the XRD peaks that can be ascribed to both tetrago-nal and cubic phases because only one peak in the range of 2Θ = 73–75° is present. This single peak can be caused by either dominant contribution of the cubic phase or by the small sizes of tetragonal nanocrystals. In the latter case, the absence of two peaks can result from the broadening and overlapping of two tetragonal peaks. This hampers the clear determination of the type of crystalline phase. However, the asymmetric shape of the peak in 2Θ = 73–75° range testifies for the significant contribution of tetragonal phase. Therefore, we can conclude that the main contribution to the XRD patterns of Cu-1 and Cu-8 samples calcinated at 500 and 600 °C is given by tetragonal phase.
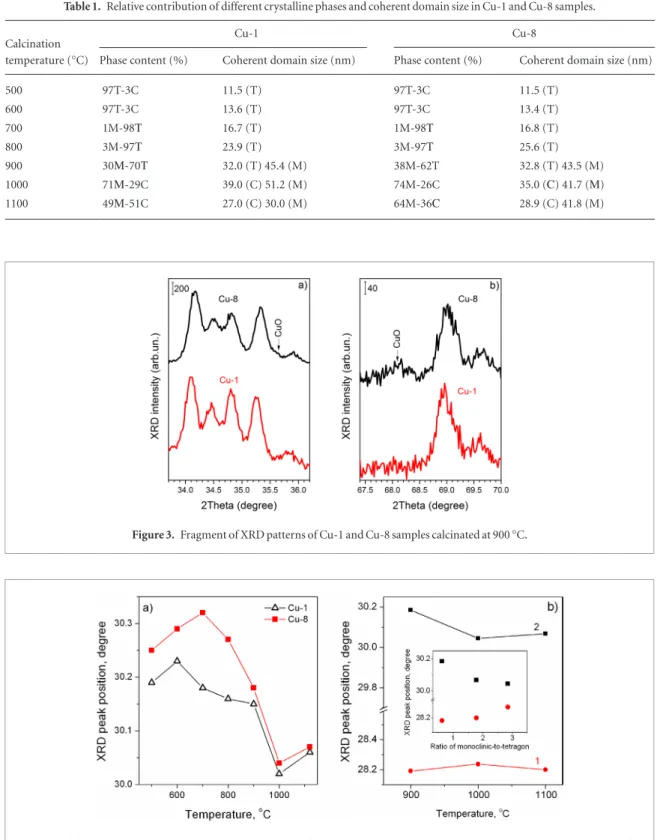
This statement is confirmed by the Rietveld refinement performed for these samples. The XRD patterns were modelled by the combination of cubic and tetragonal phases using JANA2006 program [49, 50]. The background was refined by a polynomial with 10 refinable coefficients. The peak shape was refined using a Pseudo-Voight function.
Figure 2(a) presents the results obtained for Cu-8 sample calcinated at 500 °C. The XRD pattern can be approx-imated by the tetragonal phase with low content of cubic one (~3%). Similar result was obtained for Cu-8 sample calcinated at 600 °C as well as for Cu-1 calcinated at 500 and 600 °C. The presence of two phases can be caused by the size distribution of ZrO2 nanocrystals, the contribution of cubic phase being connected with the smallest ones. The main contribution of tetragonal phase in the samples calcinated at low temperature was confirmed by the Raman scattering spectra [28].
The tetragonal phase (two peaks in 73–75° range) is clearly observed for all samples calcinated at 700–900 °C and till 900 °C this phase is dominant (figures 1(a) and (b)). The decrease of cubic phase contribution is obviously caused by the increase of crystalline sizes. At the same time the increase of Tc to 1000 °C results in the transfor-mation of tetragonal phase into cubic one that is confirmed by the Rietveld refinement (figure 2(b)). This phase remains at Tc = 1100 °C also. Along with tetragonal or cubic phases, a Tc increase above 600 °C results in the appearance of the monoclinic phase.
The phase composition was estimated using Rietveld refinement and reference intensity ratio (RIR) methods (table 1). The analysis by the RIR method was performed using XRD peaks at 2Θ ~ 30° (for tetragonal and cubic phases) and at 2Θ ~ 28° (for monoclinic phase).
Such analysis shows small contribution of monoclinic phase in the samples calcinated at Тс = 700–800 °С (~1–3%). Its content rises essentially with Tc. For Cu-1 and Cu-8 samples calcinated at Tc = 1000 °С, its proportion is about 71 and 74%, respectively. However, the Tc raise up to 1100 °C leads to the decrease of this phase contrib ution. Besides XRD peaks related to ZrO2 phase, additional peaks at 2Θ = 35.5° and 68.1° were clearly detected for Cu-8 samples calcinated at 900–1100 °C. These reflections are caused by the presence of CuO phase (figure 3).
The coherent domain sizes of tetragonal (cubic) and monoclinic phases, d, were estimated from XRD data using Scherer formula d = Kλ/(β · cosΘ), where K = 0.9 is a dimensionless shape factor, λ = 0.154 18 nm, β is a full width at half the maximum intensity and Θ is the Bragg angle. The d values for tetragonal (or cubic) phase were found to increase gradually from ~11.4 nm (500 °C) up to 35–39 nm (1000 °C) being independent practically on CuO content (table 1). For monoclinic phase, d value is slightly larger (29–51 nm).
It was found that all reflections of Cu-1 and Cu-8 samples are shifted to higher angles in comparison with the corresponding peak positions for Cu-free samples [46], this shift being higher in Cu-8 samples. Besides, the peak positions depend on calcination temperature. These dependencies for the reflection of tetragonal (or cubic) phase at 2Θ ~ 30°, which is not overlapped with the reflections of monoclinic one, are shown for Cu-1 and Cu-8 samples in figure 4(a).
It is seen that these dependencies are non-monotonic: at first, with Tc increase, the peak under consideration shifts to higher angles, then it moves to lower ones and, finally, shifts to the higher angles again. As figure 4 shows, the peak shift to higher angles in Cu-8 samples takes place up to Tc = 700 °C while in Cu-1 samples, it is observed till Tc = 600 °C, i.e. being dependent on Cu content. The peak shift to lower angles starts from Тс = 700–800 °С and increases with the increase of monoclinic phase content. It is interesting that for Cu-1 and Cu-8 samples calcinated at 900 °C the XRD peaks are close to each other (figure 4(a)) approaching the peak position observed for Cu-free samples [46]. However, the sharpest shift takes place at 1000 °C when the contribution of monoclinic phase is the highest. The calcination at 1100 °C results in the opposite (to higher angles) shift of XRD peak at 2Θ ~ 30° in both types of samples.
The positions of monoclinic phase reflections (which are clearly observed for Тс = 900–1100 °С) depend also on Тс (figure 4(b). However, they shift with Tc to the opposite side in comparison with the tetragonal (cubic) peaks being dependent on the monoclinic phase contribution (figure 4(b, insert).
Figure 1. XRD patterns of Cu-1 (a) and Cu-8 (b) samples calcinated from 500 up to1100 °C.
3.2. TEM observations
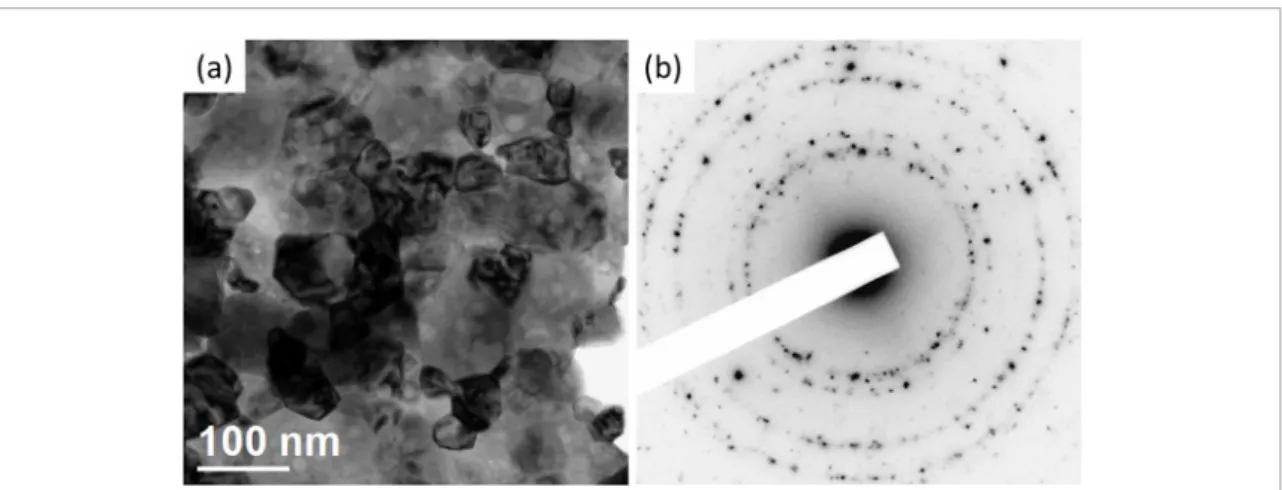
The powders, in which the contribution of monoclinic phase becomes to be considerable, were chosen for TEM observation. Figure 5(a) shows a typical bright field TEM image of the powder Cu-8 calcinated at 900 °C. It is seen the presence of large particles with external size up to 150 nm. They consist of nanocrystals of different crystalline phases that is shown by the selective-angle electron diffraction (SAED) image (figure 5(b)).
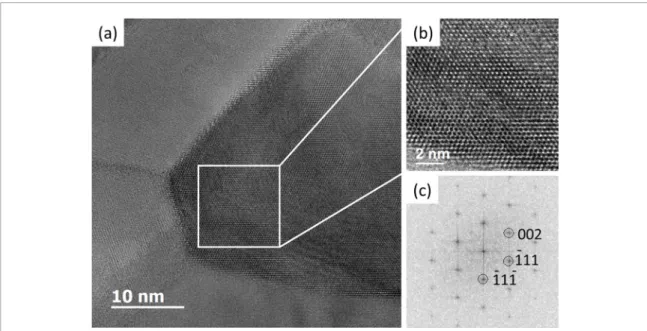
High-resolution TEM observations confirm that the large particles consist of smaller nanocrystals (figures
6–8). This suggests that the calcination stimulates their partial sintering. The fast Fourier transform analysis of HRTEM images shows that small grains are single crystallites of monoclinic (figure 6), tetragonal (figure 7) and cubic (figure 8) phases. However, the cubic crystallites are of small content that does not allow their detection by
Table 1. Relative contribution of different crystalline phases and coherent domain size in Cu-1 and Cu-8 samples. Calcination
temper ature (°C)
Cu-1 Cu-8
Phase content (%) Coherent domain size (nm) Phase content (%) Coherent domain size (nm)
500 97T-3C 11.5 (T) 97T-3C 11.5 (T) 600 97T-3C 13.6 (T) 97T-3C 13.4 (T) 700 1M-98Т 16.7 (T) 1M-98Т 16.8 (T) 800 3M-97Т 23.9 (T) 3M-97Т 25.6 (T) 900 30М-70Т 32.0 (T) 45.4 (M) 38M-62T 32.8 (T) 43.5 (M) 1000 71М-29C 39.0 (C) 51.2 (M) 74M-26C 35.0 (С) 41.7 (М) 1100 49М-51C 27.0 (C) 30.0 (M) 64M-36С 28.9 (C) 41.8 (M)
Figure 3. Fragment of XRD patterns of Cu-1 and Cu-8 samples calcinated at 900 °C.
Figure 4. (a) The dependencies of ~30° peak positions on Tc for Cu-1 and Cu-8 samples; (b) the dependencies of peak positions of
monoclinic phase taken at 2Θ ~ 28° (curve 1) and tetragonal phase taken at 2Θ ~ 30° (curve 2) on Tc in the range of 900–1100 °C.
Figure 5. Bright field TEM image (a) and SAED (b) of Cu-8 powder calcinated at 900 °C.
Figure 7. (a) HRTEM image of a tetragonal ZrO2 grain; (b) enlarged region of the grain; (c) FFT of region in (b) compatible with a
[0 0 1] projection of a tetragonal phase. It shows the (1 0 0), (0 1 0) planes (0.36 nm) with an angle of 90°.
Figure 6. (a) HRTEM image of a monoclinic ZrO2 grain; (b) enlarged region of the grain; (c) [1 1 1] projection of a monoclinic
phase. It shows the (−1 0 1), (−1 1 0) and (0 1 − 1) planes (0.39 nm, 0.365 nm and 0.37 nm, respectively) with angles of 61.6° and 54.9°.
XRD method. The average size of monoclinic nanocrystals was found to be about 70 nm, while the tetragonal (cubic) ones were about 40 nm. Note that the coherent domain size estimated from XRD data was found to be smaller. This difference can be explained by the presence of extended defects (figures 6–8).
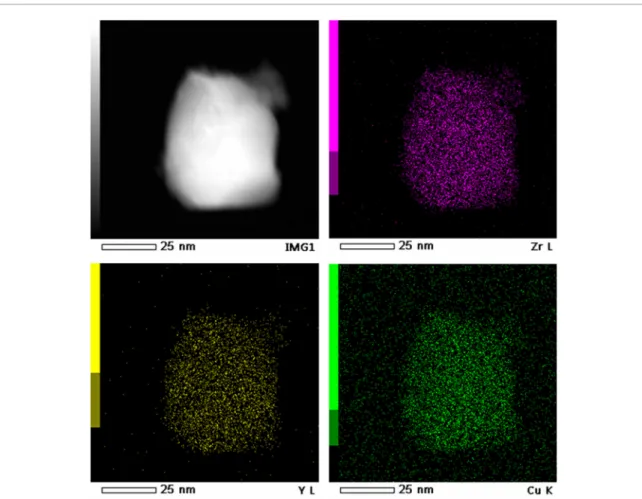
The analysis of chemical composition, performed by EDX method, for grains with different crystalline phases revealed the lower Y content in monoclinic grains (table 2). It should be noted that Cu content could not be determined precisely by EDX measurements due to the use of a holey carbon copper grid for powder observa-tion which enhances the copper content in the copper quantificaobserva-tion. However, STEM EDS study showed that tetragonal grains have homogeneous spatial distribution of Y and Cu (figure 9). Similar result has been obtained for monoclinic grains (not shown).
4. Discussion
4.1. Cu localization
As it was mention above, all XRD reflections of Cu-1 and Cu-8 samples calcinated at low Tc (500 °C) are shifted to higher angles in comparison with the corresponding peak positions for ZrO2 samples doped with 3 mol% Y2O3. Because this shift is higher for Cu-8 samples than for Cu-1 ones, it can be ascribed to Cu incorporation into the nanocrystals, Cu content in Cu-8 samples being higher than in Cu-1 ones. In fact, it is known [39, 40] that Cu incorporation results in a decrease of lattice constant. Thus, in our samples, Cu is present in nanocrystals already at low Tc.
As figure 4,a shows, the shift of XRD reflection of tetragonal phase (at 2Θ ~ 30°) to the higher angles occurs
with Tc increase up to 600 °C for Cu-1 samples and up to 700 °C for Cu-8 ones. Therefore, it can be concluded that the calcination at these temperatures stimulates the additional Cu incorporation in ZrO2 nanocrystals from surface substances. Such substances can be, for example, Cu-related surface complexes manifested themselves in electron paramagnetic resonance spectra [15] or CuO molecules [11].
At the same time, for Tc > 700 °C, this XRD peak shifts to the lower angles. One of the reasons can be the Cu out-diffusion because the Y out-diffusion has to result in opposite shift. This conclusion is confirmed by the fact that for the samples calcinated at 900 °C, the peak positions in Cu-1 and Cu-8 samples are close to each other and nearly the same as the peak position in the samples doped with Y only [46]. This fact allows concluding that some
Table 2. EDX analyses of the composition of different grains in Cu-8 sample calcinated at 900 °C.
Element Content of elements in tetragonal grains (at.%) Content of elements in monoclinic grains (at.%)
O K 60 62.6
Y K 4 0.9
Zr K 36 36.5
Total amount 100 100
Figure 8. (a) HRTEM image of cubic ZrO2 grain; (b) enlarged region of the grain; (c) fast Fourier transformation of region (b)
part of copper ions removes from the tetragonal grains at Tc = 900 °C. This is in agreement with the appearance of XRD peaks from CuO phase in the samples calcinated at this temperature (figure 3). At the same time, Y content in tetragonal nanocrystals does not change essentially. This is confirmed by EDX measurements (table 2). Thus, the variation of Tc enables to control the copper localization in composite.
However, the largest shift of XRD peak positions to the lower angles takes place at Tc = 1000 °C when mono-clinic phase contribution increases essentially. At the same time, the XRD peaks of monomono-clinic phase are found to be shifted to the higher angles. One of the reasons of this phenomenon can be the presence of some species on crystallite surface that results in an appearance of mechanical stresses due to lattice mismatch. For instance, in our case such species can be CuO. However, CuO formation cannot explain the opposite shift of tetragonal (cubic) and monoclinic peaks because the CuO cell parameters are smaller than those of m- and t-ZrO2 phases.
Figure 10. Arrhenius plot of temperature dependence of monoclinic phase contribution in Cu-1 and Cu-8 samples. Figure 9. STEM EDX chemical (Zr, Y and Cu) maps of a tetragonal grain of Cu-8 powder.The image on the top left is a STEM HAADF image of the grain.
On the other hand, the cell parameters of m-ZrO2 exceed those of t-ZrO2. When both phases contact directly, the monoclinic phase has to expand the tetragonal one, while the tetragonal phase will compress the monoclinic one. This will result in opposite shift of XRD reflections of these phases. This assumption is confirmed by the dependence of XRD peak positions of both phases on monoclinic phase contribution (figure 4(b)).
Two reasons of such contact can be considered: (i) the presence of the boundary between blocks with differ-ent phases in one crystallite; (ii) the sintering of crystallites of differdiffer-ent phases. Since the comparison of XRD and TEM data showed that the nanocrystals contain extended defects (that can be block boundaries) as well as TEM observations revealed the sintering process, one can suppose that both possibilities can happen in our samples. In our case, the sintering can be stimulated by the CuO appearance on the crystallite surface. In fact, it is known that CuO promotes the ceramics compacting [34]. On the other hand, the contact of different phases inside one nanocrystal was observed for other nanocrystalline materials [51].
4.2. The mechanism of phase transformation
Along with the changes in Cu localization, the increase of Tc results also in a phase transformation. In particular, the calcination at Tc = 1000–1100 °C leads to the appearance of cubic phase. This can be caused by the sintering of powder that results in tensile stresses in the nanocrystals of tetragonal phase. It is known that such stresses stimulate the formation of cubic ZrO2 [52, 53] while compressive stresses favor t-m transformation [54]. In addition, the Tc increase promotes the appearance of monoclinic phase and increase of its contribution. However, for Tc = 1100 °C it decreases probably due to sintering process stimulated by CuO formation.
The transformation of tetragonal (cubic) phase to monoclinic one requires the decrease of the number of oxy-gen vacancies that stabilized tetragonal (cubic) phase. In doped ZrO2 this supposes the decrease of the dopant con-centration. For our samples, Cu out-diffusion is confirmed by the CuO formation. The Y out-diffusion is observed by the EDX analysis showed much lower Y content in monoclinic nanocrystals than in tetragonal ones (table 2).
The changing of oxygen vacancies’ number can occur in two ways: (i) Cu and Y out-diffusion as primary process followed by the filling of vacancies by oxygen due to its in-diffusion or (ii) vice versa when the primary process is oxygen in-diffusion.
We consider that the process (i) is responsible for t–m (c–m) transformation in our samples. In fact, in spite of high enough mobility of oxygen via vacancies [55, 56], Y stabilized zirconia keeps tetragonal phase (i.e. oxygen vacancies) till 1000 °C [57]. At the same time, the formation of monoclinic phase in Cu-doped Y-stabilized zirconia occurs at lower temperature than in Cu-free ones that is explained in the section 4.3.
4.3. The mechanism of Cu out-diffusion
Copper out-diffusion cannot take place via vacancy mechanism because of the absence of significant content of cation vacancies. In fact, the oxygen vacancies are the prevalent intrinsic defects. On the other hand, it is known that interstitial Cu ions (Cui) are the highly mobile defects in the number of compounds, specifically, in II–VI ones [58, 59] where the drift of Cui in the electric field was observed at temperatures of about 300 °C and activation energy of the process in CdS was found to be ~0.4 eV [58]. Therefore, one can conclude that Cu out-diffusion realized via interstitial mechanism. In this case, the Tc rise promotes the shift of CuZr ions from the lattice sites to interstitials and then Cui can easily diffuse to the surface which obviously plays the role of the sink that is in agreement with the data of [23].
When the concentration of cation vacancies, appeared due to CuZr shift into interstitials, becomes consid-erable, the Y diffusion via these vacancies can occur. For instance, the diffusion of substitutional impurities such as LiCd and NaCd via Cd vacancies was observed in p-type of CdTe at room temperature [60]. Thus, it can be supposed that the process of CuZr atom replacement limits the out-diffusion of copper and yttrium leading to t–m or c–m phase transformation. Proposed mechanism can explain the decrease of the temper-ature of t–m transformation in (Cu, Y)-codoped samples compared to Cu-free ones. Besides, obtained results show that not only t–m, but also t–c phase transformation in our samples is caused by Cu out-diffusion to crystallite surface.
The dependence of monoclinic phase contribution on Tc in the temperature range of 700–1000 °C allows a rough estimation of activation energy of phase transformation. These dependencies for Cu-1 and Cu-8 samples in the form of Arrhenius plot are shown in figure 10. The obtained activation energy was found to be nearly 1.9 eV for both set of samples. In general case, it includes the activation energy of Cu shift from lattice site to interstitial and activation energy of impurity diffusion.
5. Conclusions
The structural properties of Y-stabilized ZrO2 nanopowders doped with Cu and synthesized by a co-precipitation technique were studied by XRD and TEM methods. The powders calcinated at 500 °C show predominantly the tetragonal phase. For these samples, the XRD peak positions are shifted to higher angles compared to those of Cu-free ones that testifies to the Cu presence in nanocrystals.
With Tc increase, two main processes are observed. One of them is the phase transformation (tetragonal to cubic and both of them to monoclinic) and another one is the shift of XRD peak positions. The monoclinic phase appears at Tc = 700 °C, its contribution increases till Tc = 1000 °C and decreases at Tc = 1100 °C. It is shown that tetragonal-to-cubic transformation sets in at 1000 °C.
It was found that the Tc increase results in a non-monotonic shift of tetragonal (cubic) peak positions: at first, to higher angles (500–700 °C), then, to lower ones (800–1000 °C), and again to the higher angles (1100 °C). The high-angle shift testifies to additional Cu incorporation in nanocrystals from surface complexes, while the opposite shift can be assigned to reverse process followed by the CuO formation on nanocrystal surface. One more reason of the shift of XRD peak positions of tetragonal (cubic) phase at Tc > 900 °C is the appearance of the stresses. In this case, the XRD peak positions of monoclinic phase shift in opposite side. This was explained by the tensile stresses caused by the contact of cubic and monoclinic grains appeared obviously due to CuO stimulated sinter-ing process. These stresses are the reason of t–c phase transformation. The t–m and c–m phase transformation is explained by the shift of Cu ions from lattice sites to interstitials that stimulates their out-diffusion via interstitials and, consequently, promotes Y out-diffusion through the cation vacancies.
Acknowledgments
This work was partly supported by National Academy of Sciences of Ukraine (project III-4-16). Prof X Portier is grateful for the financial support through the GENESIS EQUIPEX Program (PIA, ANR and Normandie Region). Authors thank also Dr O Gorban from O O Galkin Donetsk Institute for Physics and Engineering of National Academy of Sciences of Ukraine for the powders’ preparation.
References
[1] Zhao S, Yin H, Du L, Yin G, Tang Zh and Liu Sh 2014 Three dimensional N-doped graphene/PtRu nanoparticle hybrids as high performance anode for direct methanol fuel cells J. Mater. Chem. A 23719–24
[2] Xiong B, Zhou Y, Zhao Y, Wang J, Chen X, O’Hayre R and Shao Z 2013 The use of nitrogen-doped graphene supporting Pt nanoparticles as a catalyst for methanol electrocatalytic oxidation Carbon 52181–92
[3] Wang X, Li Y, Liu Sh and Zhang L 2016 N-doped TiO2 nanotubes as an effective additive to improve the catalytic capability of methanol
oxidation for Pt/graphene nanocomposites Nanomaterials 640
[4] Shao M, Chang Q, Dodelet J-P and Chenitz R 2016 Recent advances in electrocatalysts for oxygen reduction reaction Chem. Rev.
1163594–57
[5] Wang X, Zou L, Fu H, Xiong Y, Tao Z, Zheng J and Li X 2016 Noble metal-free oxygen reduction reaction catalysts derived from prussian blue nanocrystals dispersed in polyaniline ACS Appl. Mater. Interfaces 88436–44
[6] Kakati N, Maiti J, Lee S H, Jee S H, Viswanathan B and Yoon Y S 2014 Anode catalysts for direct methanol fuel cells in acidic media: do we have any alternative for Pt or Pt–Ru? Chem. Rev. 11412397–429
[7] Shen K, Chen X, Chen J and Li Y 2016 Development of MOF-derived carbon-based nanomaterials for efficient catalysis ACS Catal.
65887–903
[8] Zhao S, Yin H, Du L, He L, Zhao K, Chang L, Yin G, Zhao H, Liu Sh and Tang Z 2014 Carbonized nanoscale metal organic frameworks as high performance electrocatalyst for oxygen reduction reaction ACS Nano 812660–8
[9] Yin H, Zhao S, Wan J, Tang H, Chang L, He L, Zhao H, Gao Y and Tang Z 2013 Three-dimensional graphene/metal oxide nanoparticle hybrids for high-performance capacitive deionization of saline water Adv. Mater. 256270–6
[10] Elimelech M and Phillip W A 2011 The future of seawater desalination: energy, technology, and the environment Science 333712–7
[11] Kuvarega A T, Shivani B and Mamba Bh B 2017 Hybrid ceramic materials for environmental applications Sol–Gel Based Nanoceramic
Materials: Preparation, Properties and Applications ed A K Mishra (Berlin: Springer) pp 275–97
[12] Baran M P, Korsunskaya N E, Stara T R, Venger Y E, Kryshtab T G, Stroyuk O L, Raevskaya A L, Korzhak G V and Kuchmiyc S Ya 2016 Graded ZnS/ZnSxO1-x heterostructures produced by oxidative photolysis of zinc sulfide: Structure, optical properties and
photocatalytic evolution of molecular hydrogen J. Photochem. Photobiol. A 329213–20
[13] Razavi R Sh and Loghman-Estarki M R 2017 Advance techniques for the synthesis of nanostructured zirconia-based ceramics for thermal barrier application Sol–Gel Based Nanoceramic Materials: Preparation, Properties and Applications ed A K Mishra (Berlin: Springer) pp 21–92
[14] Fidelus J D, Lojkowski W, Millers D, Grigorjeva L, Smits K and Piticescu R R 2007 Zirconia based nanomaterials for oxygen sensors— generation, characterisation and optical properties Solid. State Phenom. 128141–50
[15] Fidelus J D, Lojkowski W, Millers D, Smits K and Grigorjeva L 2009 Advanced nanocrystalline ZrO2 for optical oxygen sensors
IEEE Sens. 91268–72
[16] Ken Yueh H and Cox B 2003 Luminescence properties of zirconium oxide films J. Nucl. Mater. 32357–67
[17] Wang F, Banerjee D, Liu Y, Chen X and Liu X 2010 Upconversion nanoparticles in biological labeling, imaging, and therapy Analyst
1351839–54
[18] Jia R, Yang W, Bai Y and Li T 2004 Upconversion photoluminescence of ZrO2:Er3+ nanocrystals synthesized by using butadinol as high
boiling point solvent Opt. Mater. 28246–9
[19] Kim M, Aarik J and Sildos I 2005 Thin films of HfO2 and ZrO2 as potential scintillators Nucl. Instrum. Methods Phys. Res. A 537251–5
[20] Korsunska N et al 2015 Structural and optical characterization of ZrO2 and Y2O3-ZrO2 nanopowders Materials Characterization ed
R Perez Campos et al (Berlin: Springer) pp 59–67
[21] Korsunska N, Papusha V, Kolomys O, Strelchuk V, Kuchuk A, Kladko V, Bacherikov Yu, Konstantinova T and Khomenkova L 2014 Nanostructured Y-doped ZrO2 powder: peculiarities of light emission under electron beam excitation Phys. Status Solidi c 111417–22
[22] Petrik N G, Tailor D P and Orlando T M 1999 Laser-stimulated luminescence of yttria-stabilized cubic zirconia crystals J. Appl. Phys.
[23] Sun Y and Sermon P A 1994 Evidence of a metal-support in sol–gel derived Cu-ZrO2 catalysts for CO hydrogenation Catal. Lett.
29361–9
[24] Samson K, Sliwa M, Socha R P, Gora-Marek K, Mucha D, Rutkowska-Zbik D, Paul J-F, Ruggiero-Mikolajczyk M, Grabowski R and Sloczynski J 2014 Influence of ZrO2 structure and copper electronic state on activity of Cu/ZrO2 catalysts in methanol synthesis from
CO2 ACS Catal. 43730–41
[25] Pakharukova V P, Moroz E M, Zyuzin D A, Ishchenko A V, Dolgikh L Yu and Strizhak P E 2015 J. Phys. Chem. C 11928828–35
[26] Ran S, Winnubst A J A, Blank D H A, Pasaribu H R, Sloetjes J-W and Schipper D J 2007 Effect of microstructure on the tribological and mechanical properties of CuO-doped 3Y-TZP ceramics J. Am. Ceram. Soc. 902747–52
[27] Korsunska N, Stara T, Khomenkova L, Poslishchuk Yu, Kladko V, Michailovska K, Kharchenko M and Gorban O 2015 Effect of Cu-and Y-codoping on structural and luminescent properties of zirconia based nanopowders ECS Trans. 66313–9
[28] Korsunska N et al 2015 Structural and luminescent properties of (Y,Cu)-codoped zirconia nanopowders ECS J. Solid State Sci. Technol.
4N103–10
[29] Zhang Y, Chen Ch, Lin X, Li D, Chen X, Zhan Y and Zheng Q 2014 CuO/ZrO2 catalysts for water-gas shift reaction: nature of
catalytically active copper species Int. J. Hydrogen Energy 393746–54
[30] Chen Ch, Ruan Ch, Zhan Y, Lin X, Zheng Q and Wei K 2014 The significant role of oxygen vacancy in Cu/ZrO2 catalyst for enhancing
water-gas-shift performance Int. J. Hydrog. Energy 39317–24
[31] Liu Z, Amiridis M D and Chen Y 2005 Characterization of CuO supported on tetragonal ZrO2 catalysts for N2O decomposition to N2
J. Phys. Chem. B 1091251–5
[32] Altynnikov A A, Tsikoza L T and Anufrienko V F 2006 Ordering of Cu(II) ions in supported copper-titanium oxide catalysts J. Struct.
Chem. 471161–9
[33] Kong L, Bi Q, Zhu Sh, Qiao Zh, Yang J and Liu W 2014 Effect of CuO on self-lubricating properties of ZrO2(Y2O3)-Mo composites at
high temperatures J. Eur. Ceram. Soc. 341289–96
[34] Winnubst L, Ran S, Speets E A and Blank D H A 2009 Analysis of reaction during sintering of CuO-doped 3Y-TZP nano-powder composites J. Eur. Ceram. Soc. 292549–57
[35] Sato A G, Volanti D P, Meira D M, Damyanova S, Longo E and Bueno J M C 2013 Effect of the ZrO2, phase on the structure and behavior
of supported Cu catalysts for ethanol conversion J. Catal. 3071–17
[36] Zhou R-X, Jiang X-Y, Mao J-X and Zheng X-M 1997 Oxidation of carbon monoxide catalyzed by copper-zirconium composite oxides
Appl. Catal. A 162213–22
[37] Ma Z-Y, Yang C, Wie W, Li W-H and Sun Y-H 2005 Catalytic performance of copper supported on zirconia polymorphs for CO hydrogenation J. Mol. Catal. A 23175–81
[38] Wang L-C, Liu Q, Chen M, Liu Y-M, Cao Y, He H-Y and Fan K-N 2007 Structural evolution and catalytic properties of nanostructured Cu/ZrO2 catalysts prepared by oxalate gel-coprecipitation technique J. Phys. Chem. C 11116549–57
[39] Zhang Y S, Hu L T, Zhang H, Chen J M and Liu W M 2008 Microstructural characterization and crystallization of ZrO2–Y2O3–CuO
solid solution powders J. Mater. Proc. Technol. 198191–4
[40] Bhagwat M, Ramaswamy A V, Tyagi A K and Ramaswamy V 2003 Rietveld refinement study of nanocrystalline copper doped zirconia
Mater. Res. Bull. 381713–24
[41] Konstantinova T, Danilenko I, Glazunova V, Volkova G and Gorban O 2011 Mesoscopic phenomena in oxide nanoparticles systems: process of growth J. Nanopart. Res. 134015–23
[42] Lakusta M, Danilenko I, Konstantinova T and Volkova G 2016 Influence of obtaining conditions on kinetics of the initial sintering stage of zirconia nanopowders Nanoscale Res. Lett. 11238
[43] Gorban O, Danilenko I, Gorban S, Volkova G, Glazunova V and Konstantinova T 2017 Ag(Ag2O)–ZrO2–Y2O3 photosensitive
composites: influence of synthesized routes on structure and properties Photochem. Photobiol. Sci. 1653–9
[44] McMurdie H F, Morris M C, Evans E H, Paretzkin B, Wong-Ng W and Hubbard C R 1986 Standard x-ray diffraction powder patterns from the JCPDS research associateship Powder Diffraction 1265–275
[45] Málek J, Beneš L and Mitsuhashi T 1997 Powder diffraction data and Rietveld refinement of metastable t-ZrO2 at low temperature
Powder Diffraction 1296–98
[46] Kabekkodu S 2010 ICDD (2010) PDF-4+ 2010 (Database) (Newton Square, PA: International Centre for Diffraction Data) [47] Srinivasan R, De Angelis R J, Ice G and Davis B H 1991 Identification of tetragonal and cubic structures of zirconia using synchrotron
x-radiation source J. Mater. Res. 61287–92
[48] Benedetti A, Fagherazzi G and Pinna F 1989 Preparation and structural characterization of ultrafine zirconia powders J. Am. Ceram.
Soc. 72467–9
[49] http://jana.fzu.cz/
[50] Petrícek V, Dušek M and Palatinus L 2014 Crystallographic computing system JANA2006: general features Z. Kristallogr. 229 345–52 [51] Huang F and Banfield J F 2005 Size-dependent phase transformation kinetics in nanocrystalline ZnS J. Am. Chem. Soc. 1274523–9
[52] Pugachevskii M A, Zavodinskii V G and Kuz’menko A P 2011 Dispersion of zirconium dioxide by pulsed laser radiation Tech. Phys.
56254–8
[53] Bagmut A G, Bagmut I A and Reznik N A 2016 Formation of ZrO2 cubic phase microcrystals during crystallization of amorphous films
deposited by laser ablation of Zr in an oxygen atmosphere Solid State Phys. 581221–4
[54] Marin R, Sponchia G, Zucchetta E, Riello P, Enrichi F, De Portu G and Benedett A 2013 Monitoring the t–m martensitic phase transformation by photoluminescence emission in Eu3+-doped zirconia powders J. Am. Ceram. Soc. 962628–35
[55] Glinchuk M D, Bykov P I and Hilczer B 2006 Specific features of oxygen-ionic conduction in oxide nanoceramics Solid State Phys.
482199–204
[56] Kilo M, Argirusis C, Borchardt G and Jackson R A 2003 Oxygen diffusion in yttria-stabilised zirconia: experimental results and molecular dynamics calculations Phys. Chem. Chem. Phys. 52219–24
[57] Mahato N, Banerjee A, Gupta A, Omar Sh and Balani K 2015 Progress in material selection for solid oxide fuel cell technology: a review
Prog. Mater. Sci. 72141–337
[58] Korsunskaya N E, Markevich I V, Torchinskaya T V, Sheinkman M K and Emirov Y N 1980 Electrodiffusion of deep donors in CdS:Cu crystals Sov. Phys. Semicond. 14 1204–5
[59] Markevich I, Zhuk A, Stara T, Bacherikov Yu and Korsunska N 2014 About the origin of center responsible for Cu-related blue emission band in ZnS:Cu J. Lumin. 14571–3
[60] Baidullaeva A, Bulakh B M, Dauletmuratov B K, Dzhumaev B R, Korsunskaya N E, Mozol P E and Garyagdyev G 1992 Influence of dislocations generated by laser radiation on electrophysical properties and luminescence of p-type CdTe Sov. Phys. Semicond. 26 450–2