HAL Id: insu-01715154
https://hal-insu.archives-ouvertes.fr/insu-01715154
Submitted on 22 Feb 2018HAL is a multi-disciplinary open access
archive for the deposit and dissemination of sci-entific research documents, whether they are pub-lished or not. The documents may come from teaching and research institutions in France or abroad, or from public or private research centers.
L’archive ouverte pluridisciplinaire HAL, est destinée au dépôt et à la diffusion de documents scientifiques de niveau recherche, publiés ou non, émanant des établissements d’enseignement et de recherche français ou étrangers, des laboratoires publics ou privés.
Tc interaction with crystalline rock from Äspö
(Sweden): Effect of in-situ rock redox capacity
Florian Mathias Huber, Yury Totskiy, Remi Marsac, Dieter Schild, Ivan
Pidchenko, Tonya Vitova, Stepan Kalmykov, Horst Geckeis, Thorsten Schäfer
To cite this version:
Florian Mathias Huber, Yury Totskiy, Remi Marsac, Dieter Schild, Ivan Pidchenko, et al.. Tc in-teraction with crystalline rock from Äspö (Sweden): Effect of in-situ rock redox capacity. Applied Geochemistry, Elsevier, 2017, 80, pp.90-101. �10.1016/j.apgeochem.2017.01.026�. �insu-01715154�
Accepted Manuscript
Tc interaction with crystalline rock from Äspö (Sweden): Effect of in-situ rock redox capacity
Florian Mathias Huber, Yury Totskiy, Rémi Marsac, Dieter Schild, Ivan Pidchenko, Tonya Vitova, Stepan Kalmykov, Horst Geckeis, Thorsten Schäfer
PII: S0883-2927(16)30425-5
DOI: 10.1016/j.apgeochem.2017.01.026
Reference: AG 3837
To appear in: Applied Geochemistry Received Date: 22 October 2016 Revised Date: 19 January 2017 Accepted Date: 22 January 2017
Please cite this article as: Huber, F.M., Totskiy, Y., Marsac, R., Schild, D., Pidchenko, I., Vitova, T., Kalmykov, S., Geckeis, H., Schäfer, T., Tc interaction with crystalline rock from Äspö (Sweden): Effect of in-situ rock redox capacity, Applied Geochemistry (2017), doi: 10.1016/j.apgeochem.2017.01.026. This is a PDF file of an unedited manuscript that has been accepted for publication. As a service to our customers we are providing this early version of the manuscript. The manuscript will undergo copyediting, typesetting, and review of the resulting proof before it is published in its final form. Please note that during the production process errors may be discovered which could affect the content, and all legal disclaimers that apply to the journal pertain.
M
AN
US
CR
IP
T
AC
CE
PT
ED
ACCEPTED MANUSCRIPT
Tc interaction with crystalline rock from Äspö (Sweden):
1
Effect of in-situ rock redox capacity
2 3
Huber, Florian Mathias1*, Totskiy, Yury1, Marsac, Rémi1, Schild, Dieter1, Pidchenko, Ivan1,
4
Vitova, Tonya1, Kalmykov, Stepan2, Geckeis, Horst1, Schäfer, Thorsten1
5 6
1
Karlsruhe Institute of Technology (KIT), Institute for Nuclear Waste Disposal (INE), P.O. Box 3640, D-76021
7
Karlsruhe, Germany.
8
2
Lomonosov Moscow State University (MSU), Department of Chemistry, Leninskie Gory 1-3, 119991, Moscow,
9
Russia
10 11 12
*corresponding author: [email protected]
13 14 15 16
Karlsruhe Institute of Technology (KIT)
17
Institute for Nuclear Waste Disposal (INE)
18 Hermann-von-Helmholtz-Platz 1 19 76344 Eggenstein-Leopoldshafen 20 Germany 21 Phone: +49 721 60 82 2384 22 Fax: +49 721 60 82 3927 23 24 25 26
M
AN
US
CR
IP
T
AC
CE
PT
ED
ACCEPTED MANUSCRIPT
1 27Abstract
28 29The interaction of Tc(VII) with crushed crystalline rock (Äspö diorite; 1-2 mm size fraction)
30
from the Äspö Hard Rock Laboratory (HRL) (Sweden) was studied by laboratory batch
31
sorption and desorption experiments under Ar atmosphere using both natural and synthetic
32
groundwater. The Äspö diorite used in the experiments was drilled, transported and handled
33
as far as possible under anoxic conditions to preserve the in-situ rock redox capacity. For
34
comparison, identical experiments using artificially oxidized Äspö diorite have been carried
35
out to examine the effect of in-situ redox capacity on Tc uptake. According to the batch
36
studies, Tc(VII) uptake on the Äspö diorite is strongly dependent on redox capacity. Uptake
37
on un-oxidized rock is approximately 2 times higher compared to oxidized rock samples,
38
most likely due to higher Fe(II) contents of the un-oxidized rock. Tc redox states and
39
speciation both on the mineral surface and in the bulk were studied using X-ray
40
photoelectron spectroscopy (XPS) and Tc K-edge X-ray absorption near edge structure
41
(XANES) spectroscopy. The spectroscopic results verify a Tc(VII) reduction to Tc(IV) at the
42
rock surface. Distribution coefficients (Kd) and surface normalized distribution coefficients
43
(Ka) were determined and compared to available literature data. The formation of a Tc
44
colloidal phase was not observed under the geochemical conditions prevailing in the
45
experimental studies. Desorption of Tc is very low under anoxic conditions, but after artificial
46
oxidation Tc mobility is strongly increased. The results of this work clearly highlight the effect
47
of in-situ rock redox capacity on Tc retention.
48 49
M
AN
US
CR
IP
T
AC
CE
PT
ED
ACCEPTED MANUSCRIPT
21.
Introduction
50 51The generally accepted concept of spent nuclear fuel (SNF) and high-level nuclear waste
52
(HLW) long-term storage is by disposal in deep geological formations at depths of around
53
250 – 1000 meters (IAEA, 2001). The repository host rock as part of a multi-barrier system
54
plays an important role as retention barrier for radionuclide migration. Thus, the selection of
55
the host rock formation with appropriate geochemical and hydrogeological properties is a
56
key challenge during nuclear waste repository siting and it requires comprehensive scientific
57
research. Crystalline rocks (e.g. granites and gneisses) are considered as potential host rock
58
formations for the deep geological disposal in several countries (e.g. Sweden, Finland,
59
Russia, Korea). The work described herein focuses on crystalline rock samples from the Äspö
60
Hard Rock Laboratory (HRL) (Sweden) which is a generic underground research laboratory
61
(URL) located on the Äspö island near Oskarshamn in southern Sweden dedicated to in-situ
62
studies of processes in crystalline formations concerning deep geological disposal of spent
63
nuclear fuel (SKB, 2011). Radionuclide transport depends strongly on the bedrock
64
hydrogeological and geochemical conditions (pH, Eh, and ionic strength) and is governed by
65
different immobilization-remobilization processes (Grambow, 2008). The most important
66
retention processes to be considered in fractured crystalline rocks are sorption to rock
67
surfaces, redox reactions and matrix diffusion (Bodin et al., 2003; Neretnieks, 1980; Xu and
68
Wörman, 1999).
69
99
Tc is one of the main long-lived U and Pu fission products in SNF and is also generated by
70
medical laboratories and research institutions. Because of its relatively high fission yield (ca.
71
6%) and long half-life (2.1×10⁵ years) 99Tc is considered as a radioactive component of HLW
72
with significant toxic relevance (Kratz and Lieser, 2013). Technetium mobility in natural
73
systems strongly depends on the redox state. The most stable Tc form under aerobic
74
atmosphere is the pertechnetate ion TcO4-, which is very soluble and behaves like a
75
conservative tracer under oxidizing conditions (Rard et al., 1999). In an early work by
76
Bondietti and Francis (1979) using a variety of natural rock materials considerable Tc
77
retention due to reduction of pertechnetate was observed in accordance with Eh/pH
M
AN
US
CR
IP
T
AC
CE
PT
ED
ACCEPTED MANUSCRIPT
3conditions. The potential of the TcO4-/TcO2 couple was described with the equation (1)
79
(Meyer and Arnold, 1991):
80
(1)
81
Under aerobic conditions, reported Kd values of Tc on crystalline rocks are negligible,
82
< 1 mL/g in Allard et al. (1979) (contact time 1 day) and < 0.1 – 8.6 mL/g in Videnska and
83
Havlova (2012) (contact time with granitic rocks up to 94 days), whereas under reducing
84
conditions the values are much higher (50 mL/g in (Allard et al., 1979)). Both batch type
85
sorption and column experiments with Hanford sediments (Um and Serne, 2005; Zachara et
86
al., 2007) have revealed that 99Tc is highly mobile and shows virtually no retardation under
87
fully oxidizing conditions. However, under anoxic conditions TcO4- is prone to reduction to
88
Tc(IV) and the solubility is limited by the hydrous oxide solid phase TcO2·1.6H2O(s) (Meyer et
89
al., 1991). As a consequence, distribution coefficients and apparent diffusion coefficients of
90
technetium reported in the literature on natural minerals are scarce and are rarely published
91
together with the respective pe and pH conditions. Tc redox kinetics strongly depend on the
92
availability of reactive Fe(II) in the host rock and the mineral association and speciation on
93
surface (surface complexed, precipitated, and ion exchangeable) (Fredrickson et al., 2009;
94
Heald et al., 2007; Jaisi et al., 2009; Peretyazhko et al., 2008a; Peretyazhko et al., 2008b;
95
Zachara et al., 2007). Äspö in-situ and laboratory migration studies (CHEMLAB-2) using Äspö
96
derived natural groundwater revealed ≈1% Tc recovery (after 254 days) of the injected
97
Tc(VII) mass (Kienzler et al., 2003; Kienzler et al., 2009). Batch type studies done in parallel
98
revealed surface normalized distribution coefficients, Ka, values of ≈2.1×10⁻³ m for 99Tc
99
(tcontact = 14 d), whereas altered material showed significantly lower values. These results
100
revealed contact/residence time dependent retardation and/or reduction processes. In all
101
studies mentioned above, though carried out under e.g. Ar atmosphere in glove boxes,
102
crystalline rock material used were exposed for a considerable time to air before the
103
experiment. This circumstance might be one of the most important drawbacks in all batch
104
sorption/desorption studies carried out not only on redox sensitive radionuclides but for
105
redox sensitive heavy metals in general. Due to the drastically increased effort in preserving
106
the natural in-situ rock redox capacity during drilling, transporting and storing of the rock
M
AN
US
CR
IP
T
AC
CE
PT
ED
ACCEPTED MANUSCRIPT
4material, almost no studies are available using non-oxidized material. In consequence, the
108
distribution coefficients, sorption and reduction properties and behaviour published in
109
numerous studies could be biased and accompanied with high uncertainties. So far, only one
110
study on U interaction with the same un-oxidized Äspö diorite (ÄD) material (provided by
111
KIT-INE) as used in the present study is available (Schmeide et al., 2014). Therefore, the main
112
motivation of this work is to investigate the effect of in-situ rock redox capacity on
113
technetium sorption behaviour by conducting classical batch experiments using non-oxidized
114
and oxidized rock material, respectively.
115 116
2.
Materials and Methods
117
2.1. Radionuclides
118
2.1.1. 99Tc 119
All Tc batch experiments with Tc concentration ≥ 10-9 M have been carried out using a 99Tc
120
stock solution (13 mM NaTcO4) produced at the Institute of Hot Chemistry, Nuclear Research
121
Centre (former FZK, now KIT) (Karlsruhe, Germany). The solubility limit of Tc(IV) in a wide
122
range of pH-Eh conditions covering most of the natural systems is about 4.4×10⁻⁹ M (Duro et
123
al., 2006). The detection limit of low-background liquid scintillation counting (LSC)
124
(Quantulus, PerkinElmer, Inc., LSC cocktail Ultima Gold) for 99Tc measurement is ≈ 10-10 M.
125
2.1.2. 95mTc 126
For experiments with Tc concentrations lower than 10-9 M, 95mTc with a much shorter
half-127
life (61 day) and a main gamma emission line at 204.1 keV was applied. The isotope was
128
produced by proton irradiation of natural Mo foil (50 μm thickness) containing the natural
129
isotopic composition at ZAG Zyklotron AG (Karlsruhe, Germany). After cooling the foil was
130
transported to the Institute for Nuclear Waste Disposal (KIT-INE) and processed to separate
131
technetium according to the technique of (Boyd et al., 1960). The foil was dissolved in a
132
mixture of concentrated H2SO4 and 30% H2O2 and afterwards was slowly neutralized with
133
saturated NaOH (up to alkaline pH). The obtained alkaline solution was passed through a
134
column filled with the anion exchanger Dowex 1x8 (100-200 mesh particle size) with a total
M
AN
US
CR
IP
T
AC
CE
PT
ED
ACCEPTED MANUSCRIPT
5volume ca. 3 mL. The column was washed first with 20 mL 1 M K2C2O4 to remove residues of
136
molybdate and after rinsing with 20 mL of MilliQ water pertechnetate was eluted with 30 mL
137
1 M HClO4. The last fraction was collected into 2 mL vials, which were measured with
γ-138
spectrometry and samples with ca. 90% of 95mTc were combined and neutralized with
139
concentrated NaOH. The purification level was monitored with ICP-MS and γ-spectrometry.
140
The use of another column filled with Teva® Resin (Eichrom Technologies, LLC) prior to
141
Dowex significantly increased chemical purity of Tc. Technetium separation on Teva Resin
142
column was performed from ≈ 1.5 M HNO3 media and after washing the column with 2 M
143
HNO3 Tc was eluted with 8 M HNO3 according to the technique reported by (Tagami and
144
Uchida, 1999). A further separation step on the Dowex column results in the purification
145
from NO3-, which may act as undesired oxidizing agent, being absent in natural deep
146
geological anoxic groundwaters. The nitrate concentration was initially controlled with
147
nitrate test strips (Merck) and subsequent ion chromatography (IC) analysis. Detection limit
148
of gamma spectrometric analysis of 95mTc using a 10 mL vial geometry and a high-purity
149
germanium (HPGe) semiconductor detector was estimated to be ≈ 10-14-10-15 M (three hours
150
measurement time) depending on the age of the stock solution.
151
2.2. Solid materials
152
2.2.1. Äspö diorite 153
Diorite is the dominating rock type in the Äspö area (Kornfält et al., 1997). The general
154
mineralogical characterization of ÄD is presented in Table 1. Fresh Äspö diorite was obtained
155
from a drilling campaign at the Äspö HRL (Sweden) in 2011 within the EU project CP CROCK.
156
Details of the sampling procedure and material characterization were originally published
157
within a CROCK S&T contribution (Schäfer et al., 2012). During the core drilling, special care
158
was taken to minimize the exposure of the solid material to air. Therefore, the drilling
159
procedure was carried out with a double tube technique preserving to the best possible
160
anoxic conditions. Natural Äspö groundwater (EhSHE ≈ -240mV) permanently bubbled with N2
161
was used as a drilling fluid. After a short visual inspection (max. 5 min) under tunnel
162
atmosphere the cores were directly transferred into a transparent LD-PE bag, which was
163
evacuated three times (≈ -0.4 bar) and purged with nitrogen gas before
M
AN
US
CR
IP
T
AC
CE
PT
ED
ACCEPTED MANUSCRIPT
6Table 1. Petrographic characterization of Äspö diorite (Byegård et al., 1998; Kornfält et al.,
165
1997). 166
Material Rock type Mineralogical composition, % Structural characteristic Äspö diorite Quartz monzodiorite/ granodiorite Plagioclase, 30-50 Quartz, 10-25 K-feldspar, 10-30 Biotite, 10-25 Epidote, 3-15
Amphibole (mainly hornblende), < 10 Muscovite, titanite, apatite, fluorite, zircon, magnetite
Porphyritic, medium-grained
167
welding. The same procedure was applied with an Al bag for the second confinement to
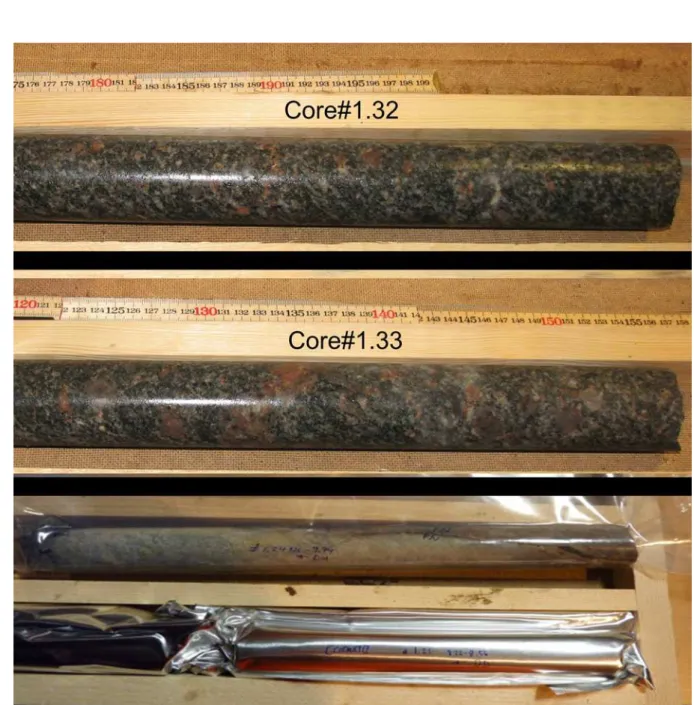
168
prevent oxidation during transportation to the KIT-INE laboratories (see Figure A.1, bottom).
169
At KIT-INE the cores were stored in a barrel under Ar atmosphere (≈ 1 bar overpressure).
170
Two Äspö diorite drill cores (borehole KA2368A-01, cores#1.32 and #1.33) were selected for
171
the experiments. Both cores were chosen because of their (maximal) distance to the tunnel
172
wall (13.04 – 13.52 m (core #1.32) and 13.52 – 14.00 m (core #1.33)) and their petrological
173
characterization (fresh Äspö diorite) during the drilling campaign (Figure A.1, top and
174
middle). For preparation of the crushed material, the cores were transferred into an Ar
175
glovebox equipped with a circular diamond saw and cut into small discs (0.5-1 cm in width).
176
These discs were then manually crushed with a hammer and separated into several size
177
fractions by sieving. For the sorption experiments the 1-2 mm size fraction in diameter was
178
chosen. The N2-BET surface area of 0.16 m2/g was measured for this size fraction. This
un-179
oxidized crushed material was stored permanently in the glovebox under Ar atmosphere (≤ 1
180
ppm O2). Part of this crushed diorite material was exposed to air for one week for artificial
181
surface oxidation to investigate the influence of sample preservation and preparation on Tc
182
uptake. The chemical composition of the rock material used was determined at the Institute
M
AN
US
CR
IP
T
AC
CE
PT
ED
ACCEPTED MANUSCRIPT
7for Geosciences, Johannes Gutenberg University (Mainz, Germany) by X-Ray fluorescence
184
(XRF) spectrometry (spectrometer MagiXPRO, Philips) with a Rh anode operated at 3.2 kW).
185
In Table A.1 the XRF data for the material studied is compared to the oxidized Äspö diorite
186
used by Huber et al. (2012) and Huber et al. (2010) and to material from (Byegård et al.,
187
1998). A typical granodiorite composition (Nockolds, 1954) is also added in Table A.1 for
188
comparison. The general composition of the ÄD is typical of granitic rocks with high amount
189
of SiO2 and Al2O3 (quartz and feldspar) (Nockolds, 1954). The Fe2+ content of the solid phases
190
was measured by cerimetric titration (cerate oximetry) with potentiometric end point
191
determination (Close et al., 1966). The new un-oxidized ÄD shows a much higher amount of
192
ferrous iron (≈39% Fe2+/Fetot vs. ≈27% in old ÄD samples) compared to the old oxidized ÄD.
193
This result gives confidence in the approach carried out to preserve the in-situ rock redox
194
capacity. In the work from (Byegård et al., 1998) no information on Fe(II) compounds were
195
reported. In order to estimate the cation exchangeable Fe(II) amount on the mineral
196
surfaces of the Äspö diorite, a method proposed by Heron et al. (1994) was applied using
197
10 mL 1 M CaCl2 (pH = 7) in contact with 2 g of granite for 24 h. Afterwards, an aliquot was
198
taken for Fe(II) quantification by the ferrozine technique. The analytical procedure of the
199
ferrozine technique is described in Viollier et al. (2000). Additionally, Fe data on the new
un-200
oxidized and old oxidized ÄD material determined by XRF are given in the Table A.1, showing
201
that the overall Fe(II) redox buffer is drastically reduced for the oxidized samples. The
ion-202
exchangeable Fe(II) fraction for the un-oxidized ÄD was quantified at approx. 4–6 μg/g,
203
whereas for the oxidized samples lower values around 1–3 μg/g for ÄD are obtained. The
204
rather high uncertainty in the measurements is attributed to the natural heterogeneity of
205
the rock material. The content of ion-exchangeable Fe(II) is about three orders of magnitude
206
lower than Fe(II) amount in the bulk obtained by XRF (see Table A1). However, the ratio
207
between Fe(II) content in fresh and oxidized materials of the order of three is similar for
208
both types of measurements.
209
2.3. Groundwater
210
Different types of groundwater have been used in the experimental program. Besides the
211
natural Äspö groundwater (ÄGW) a synthetic groundwater simulant (ÄGWS) has been
212
prepared to mimic the CROCK drilling site outflow groundwater composition (see Schäfer et
M
AN
US
CR
IP
T
AC
CE
PT
ED
ACCEPTED MANUSCRIPT
8al. (2012)). All chemicals used in the preparation of the synthetic groundwater were of
214
analytical grade. Solutions were prepared with deionized Milli-Q water which was stripped
215
with Ar prior to use. ÄGWS has a comparable composition to natural Äspö groundwater
216
sampled in-situ from borehole KA3600-F-2 sampled in a Ar pre-flushed 50 L Teflon-coated
Al-217
barrel at the CP-CROCK site (Heck and Schäfer, 2012). Chemical compositions of the ÄGWS
218
used and natural groundwater samples from Äspö and Grimsel (GGW) (glacial melting water
219
analogue with low ionic strength) are presented in Table 2. Relatively high Eh values of
220
ÄGWS and GGW is explained by the low concentration of the redox couples (e.g.
221
Fe(II)/Fe(III)) in the solution, which cannot be measured using a Pt-electrode.
222
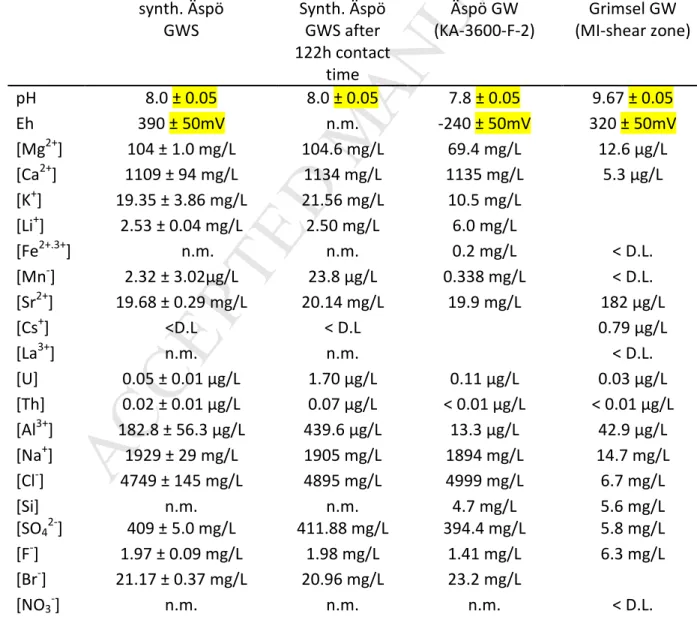
Table 2. Overview of the chemical compositions of the synthetic Äspö groundwater simulant (GWS),
223
Äspö groundwater and Grimsel groundwater, respectively. 224 synth. Äspö GWS Synth. Äspö GWS after 122h contact time Äspö GW (KA-3600-F-2) Grimsel GW (MI-shear zone) pH 8.0 ± 0.05 8.0 ± 0.05 7.8 ± 0.05 9.67 ± 0.05 Eh 390 ± 50mV n.m. -240 ± 50mV 320 ± 50mV [Mg2+] 104 ± 1.0 mg/L 104.6 mg/L 69.4 mg/L 12.6 µg/L [Ca2+] 1109 ± 94 mg/L 1134 mg/L 1135 mg/L 5.3 µg/L [K+] 19.35 ± 3.86 mg/L 21.56 mg/L 10.5 mg/L [Li+] 2.53 ± 0.04 mg/L 2.50 mg/L 6.0 mg/L [Fe2+.3+] n.m. n.m. 0.2 mg/L < D.L. [Mn-] 2.32 ± 3.02µg/L 23.8 µg/L 0.338 mg/L < D.L. [Sr2+] 19.68 ± 0.29 mg/L 20.14 mg/L 19.9 mg/L 182 µg/L [Cs+] <D.L < D.L 0.79 µg/L [La3+] n.m. n.m. < D.L. [U] 0.05 ± 0.01 µg/L 1.70 µg/L 0.11 µg/L 0.03 µg/L [Th] 0.02 ± 0.01 µg/L 0.07 µg/L < 0.01 µg/L < 0.01 µg/L [Al3+] 182.8 ± 56.3 µg/L 439.6 µg/L 13.3 µg/L 42.9 µg/L [Na+] 1929 ± 29 mg/L 1905 mg/L 1894 mg/L 14.7 mg/L [Cl-] 4749 ± 145 mg/L 4895 mg/L 4999 mg/L 6.7 mg/L [Si] n.m. n.m. 4.7 mg/L 5.6 mg/L [SO42-] 409 ± 5.0 mg/L 411.88 mg/L 394.4 mg/L 5.8 mg/L [F-] 1.97 ± 0.09 mg/L 1.98 mg/L 1.41 mg/L 6.3 mg/L [Br-] 21.17 ± 0.37 mg/L 20.96 mg/L 23.2 mg/L [NO3-] n.m. n.m. n.m. < D.L.
M
AN
US
CR
IP
T
AC
CE
PT
ED
ACCEPTED MANUSCRIPT
9 [HCO3] n.m. n.m. n.m. 3.0 mg/L [B] 306.5 ± 212.5 µg/L 146.1 µg/L 885 µg/L n.m. – not measured; D.L. – detection limit.225 226 2.4. Batch experiments 227 2.4.1. Sorption experiments 228
Before the start of the batch sorption kinetic experiments the crushed material was
229
contacted with relevant groundwater simulant (GWS) for one day and exchanging the water
230
five times. This step was conducted to remove any remaining fines/colloids from the sieving
231
procedure. In case of un-oxidized ÄD the last step was performed with natural ÄGW to
232
establish more realistic conditions. All batch experiments were carried out in 20 mL LSC vials
233
(HDPE, Zinsser©) inside an Ar glovebox with O2 concentrations ≤ 1 ppm at room
234
temperature (20 ± 2° C). The solid-liquid ratio chosen was 2.00g of granitic rock and 8.0mL of
235
groundwater (250 g/L). Sample duplicates were prepared and kept closed during the
236
sorption experiments to prevent oxidation of Fe(II) at the mineral surfaces. All sorption
237
experiments were conducted at pH 8.1 ± 0.05. Tc(VII) concentrations of 1x10⁻⁵M, 1x10⁻⁸M
238
and 1x10⁻⁹M were used in the experiments. For measurement of 99Tc content in the sample
239
supernatant after the desired contact time 1 mL aliquots were taken and added to 10 mL of
240
Ultima Gold LSC cocktail for analysis with LSC. To differentiate between potentially formed
241
colloidal phases (e.g. Tc(IV) eigencolloids) and dissolved species a phase separation by
242
ultracentrifugation (Beckman Optima XL-90, 90,000 rpm, 694,000 × g) for 1 h was applied.
243
Redox potential of selected samples was measured in the Ar glovebox by using a Metrohm
244
(Ag/AgCl, KCl (3 M)) electrode. The measurements were performed directly in the sample
245
without phase separation. The Eh values were recorded every hour and then corrected for
246
the standard hydrogen potential (Eh always denotes corrected EhSHE in this work). The Eh
247
values were recorded after ca. 1 hour contact time. The redox potential measurements in
248
the sorption experiments samples were carried out after about two weeks and 1 month
249
contact time, respectively. Every sample was measured over a period of one day in the open
250
vial in the Ar glovebox (< 1 ppm O2) to monitor the Eh evolution. A typical time dependent
251
Eh evolution is shown in Figure 1. The initial drop in Eh is likely due to the equilibration of
M
AN
US
CR
IP
T
AC
CE
PT
ED
ACCEPTED MANUSCRIPT
10the electrode with the solution, whereas the continuous drift to more oxidizing potentials in
253
the later period might be explained to be a result of oxidation due to traces of oxygen in the
254
Ar glovebox (< 1 ppm O2) that seems to be enough to compensate the redox capacity of the
255
sample within 24 hours. Therefore, the lowest Eh value detected was used as most
256
representative for the undisturbed rock/water system in the closed vials.
257
Figure 1: Typical evolution for Eh measurement in synthetic Äspö groundwater simulant with
un-oxidized diorite sample ([Tc] = 10-10 M). Dashed line marks the Eh value chosen as the final one.
2.4.2. Desorption experiments 258
Subsequent to the sorption kinetic experiments, desorption kinetic studies have been
259
conducted. The Tc containing supernatant of the sorption experiment samples (samples with
260
3 months contact time in the sorption kinetic experiments) was removed and 8 mL of fresh
261
Tc-free groundwater added (natural ÄGW and Grimsel groundwater (glacial meltwater
262
analogue)). For each contact time, the supernatant was always completely removed,
263
analysed by LSC and substituted with fresh Tc-free groundwater of the same volume. A
264
subset of the samples was oxidized under air for one month after the sorption experiments.
265
For this, the initial Tc-containing liquid phase was removed and dry material in the vial was
266
exposed to air before the fresh Tc-free groundwater was added under aerobic atmosphere.
267
For this experiment ÄGWS was used instead of natural ÄGW to keep oxidizing conditions.
268
Desorption experiments cover a time range between a few seconds and 1 month contact
269
time.
M
AN
US
CR
IP
T
AC
CE
PT
ED
ACCEPTED MANUSCRIPT
11 2.5. X-ray spectroscopy 2712.5.1. X-ray photoelectron spectroscopy (XPS) 272
To examine the Tc surface speciation X-ray photoelectron spectroscopy (XPS) was applied.
273
For XPS analysis small un-oxidized Äspö diorite fragments with unpolished faces after cutting
274
by circular saw were contacted with 10-5 M Tc(VII) in ÄGWS for two months and washed by
275
MilliQ water for a few seconds to prevent salt precipitation directly before the XPS analysis.
276
All preparation and measurement steps were performed under Ar atmosphere. Transport of
277
the samples from the Ar glovebox to the XPS spectrometer under anoxic atmosphere was
278
achieved by using an O-ring sealed vacuum transfer vessel (PHI model 04-110). XPS
279
measurements were carried out with the XPS system PHI 5000 VersaProbe II (ULVAC-PHI
280
Inc.) equipped with a scanning microprobe X-ray source (monochromatic Al Kα (1486.6 eV)
X-281
rays) in combination with an electron flood gun and a floating ion gun generating low energy
282
electrons (1.1 eV) and low energy argon ions (8 eV) for charge compensation at isolating
283
samples (dual beam technique), respectively. The angle between sample surface and
284
analyser was set to 45°. Survey scans were recorded with an X-ray source power of 12 W and
285
pass energy of 187.85 eV. Narrow scans of the elemental lines were recorded at 23.5 eV pass
286
energy. All spectra were charge referenced to C 1s (hydrocarbon) at 284.8 eV. Data analysis
287
was performed using ULVAC-PHI MultiPak program, version 9.5.
288
2.5.2. X-ray absorption spectroscopy (XAS) 289
XAS experiments were performed at the INE-Beamline at the ANKA 2.5 GeV synchrotron
290
radiation facility, Karlsruhe Institute of Technology (KIT), Karlsruhe, Germany. The detailed
291
description of the instrumental setup of the INE-beamline is presented in Rothe et al. (2012).
292
Tc K-edge (21,044 eV) X-ray absorption near edge structure (XANES) spectra were collected
293
in fluorescence mode using one element VITUS Vacuum-Silicon Drift Detector (SDD, Munich,
294
Germany). The uranium mineral meta-schoepite (UO3·nH2O) was measured simultaneously
295
with all samples and the Tc(IV) and Tc(VII) references. Pertechnetate solution with
296
concentration of 10-2 M was taken as a Tc(VII) reference and TcO2×1.6H2O(s) solid phase was
297
prepared by TcO4- reduction in the electrochemical cell and used as Tc(IV) reference. The U
298
L2 (20,948 eV) edge XANES spectra were used for energy calibration. The set of samples with
M
AN
US
CR
IP
T
AC
CE
PT
ED
ACCEPTED MANUSCRIPT
12Tc concentrations of ≈10-3 M contacted with crystalline rock materials was prepared and
300
mounted in an inert gas cell under argon atmosphere (see Table 3 for an overview of all XAS
301
samples and references measured). During the measurements, argon continually flowed
302
through the cell. Data reduction and normalization was performed with the ATHENA
303
program part of the IFEFFIT software package (Ravel and Newville, 2005).
304
Table 3. List of samples studied by XAS.
305
Sample [Tc], M Description
Tc(VII) reference 0.01 TcO4- solution
Tc(IV) reference - Solid TcO2 covered with supernatant
Tc on ÄD 0.001 Centrifuged suspension
2.6. Thermodynamic modelling
306
Geochemical speciation calculations and sorption modelling were conducted with the
307
geochemical speciation code PHREEQC (version 2) (Parkhurst and Appelo, 1999). The SIT
308
database provided with PHREEQC is used, in which the thermodynamic constants for Tc
309
correspond to the ones selected by the NEA Thermochemical Database (Guillaumont et al.,
310
2003). Pourbaix diagrams were calculated and plotted with “Geochemist’s Workbench”
311
(version 8.0, Aqueous Solution LLC) code with the default database thermo.dat also modified
312
for Tc species in accordance with NEA Thermochemical Database (Guillaumont et al., 2003).
313
Under the applied experimental conditions TcO4- and TcO(OH)2 are the only relevant
314
dissolved species for Tc(VII) and Tc(IV), respectively. The redox reaction is:
315
(2)
316
(3)
317
where KVII/IV is the conditional constant of reaction (2) at a given ionic strength. From here
318
the pe (pe = -log = 16.9×Eh at 25°C) is calculated according to the following equation:
M
AN
US
CR
IP
T
AC
CE
PT
ED
ACCEPTED MANUSCRIPT
13 (4) 320where pHc = - log [H+]. The pe corresponding to the 50/50% Tc(VII)/Tc(IV) borderline on a
321
Pourbaix diagram pertaining only to the aqueous species (denoted peaq or Ehaq for redox
322
potential) is found as follows:
323
(5)
324
Sorption of Tc(IV) onto mineral surfaces can also be taken into account. Because this study is
325
restricted to pH ≈8 and low ionic strength for the sorption studies, no surface site protolysis
326
or electrostatics are taken into account. We have considered the following simple reaction
327
(6) to describe sorption onto the mineral surface:
328
(6)
329
where ≡S is a generic surface site and [≡S] can be calculated using equation (7) with the
330
following parameters: site density: 1 site/nm2; surface area: 0.16 m2/g; S/V: 250 g/L.
331
(7)
332
where NA is the Avogadro constant. A similar surface complexation approach was proposed
333
by (Cui and Eriksen, 1996) for Tc uptake by Fe(II)-bearing minerals. According to the reaction
334
(6) the reaction constant is calculated as (8):
335
(8)
336
Tc(IV) uptake on mineral surfaces is high (Westsik Jr et al., 2014), so [≡STcO(OH)2] is
337
expected to be much larger than [TcO(OH)2(aq)]. By contrast, Tc(VII) uptake on minerals can
338
be neglected (Wildung et al., 2004). Using the surface complexation model, the Tc(VII)/Tc(IV)
339
borderline on a Pourbaix diagram accounting for both processes in solution and at the
340
mineral surfaces (denoted pesurf or Ehsurf) is calculated as follows:
M
AN
US
CR
IP
T
AC
CE
PT
ED
ACCEPTED MANUSCRIPT
14 (9) 342 (10) 343In other words, pesurf is the pe value for 50% Tc uptake. Equation (10) applies only for
344
sufficiently low [Tc]tot or high Eh, i.e. where the precipitation of TcO2·1.6H2O(s) does not
345
occur. Note that, in a modelling study of plutonium (Pu) uptake on kaolinite, (Marsac et al.,
346
2015a) calculated borderlines between two Pu oxidation states pertaining only to the
347
speciation at the kaolinite surface. Such type of calculation cannot be made in our study
348
because Tc(VII) uptake on minerals is unlikely to be quantifiable, in contrast to the relevant
349
Pu oxidation states.
350
3.
Results
351
3.1. Batch sorption studies
352
3.1.1. Sorption on Äspö diorite 353
In the following the term “sorption” implies the total Tc uptake by the solid phase
354
independent of the underlying process (sorption only or reductive sorption). Time
355
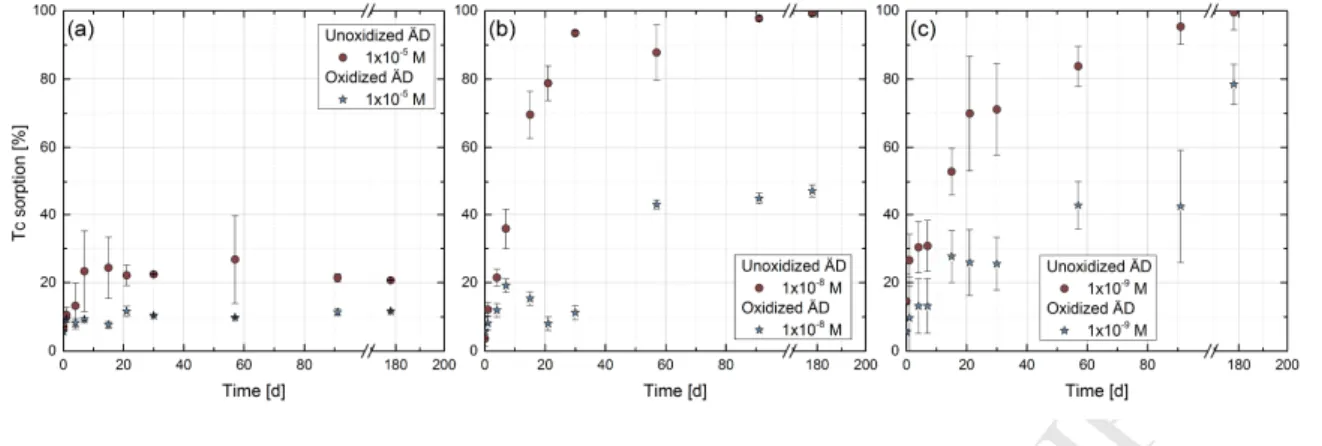
dependent sorption of different Tc(VII) concentrations onto oxidized and un-oxidized ÄD are
356
given in Figure 2 for [Tc]tot = 10-5 (Figure 2a), 10-8 (Figure 2b) and 10-9 M (Figure 2c). From the
357
Tc sorption kinetic experiments, it is evident that Tc uptake on un-oxidized material is much
358
higher than the artificially oxidized one. For the sample series of 10-8 M and 10-9 M [Tc]tot on
359
un-oxidized material plateau values close to 100% sorption are obtained (after 90 days
360
contact time), whereas during the same observation period in experiments with oxidized ÄD
361
only ≈ 40% are removed from solution. Reaching the plateau value for Tc uptake takes more
362
time at lower [Tc]tot concentration. In samples with 10-5 M Tc much less relative uptake is
363
observed showing a plateau level for sorbed Tc of around 20 – 25% for the un-oxidized
364
samples and ≈10% for the oxidized samples. The steady state is reached after approximately
365
seven days which is much faster than observed for experiments with lower [Tc]tot.
M
AN
US
CR
IP
T
AC
CE
PT
ED
ACCEPTED MANUSCRIPT
15Figure 2. Tc sorption kinetics for different Tc concentrations in presence of oxidized and un-oxidized
ÄD (pH 8, I = 0.2 M).
The formation of colloidal Tc phases (eigencolloids) examined by comparison of Tc
367
concentration in ultracentrifuged to non-ultracentrifuged samples was not detectable within
368
the uncertainty limits (± 5-10%). Either these colloidal phases are not formed or are not
369
stable under the Äspö GWS conditions chosen (ionic strength ≈0.2 M, pH 8).
370
Redox potential measurements of Tc containing ÄGWS after two weeks and 1 month
371
equilibration time with oxidized and un-oxidized ÄD for three different [Tc]tot are shown in
372
Figure 3, together with Pourbaix diagrams calculated for the ÄGW composition. For the
373
oxidized ÄD material the redox potential (EhSHE) does not change significantly as a function
374
of Tc concentration and is within the range of +230 to +280 mV. However, for un-oxidized
375
ÄD material two trends were observed during the Eh measurements: (a) for low Tc
376
concentration (up to 10-8 M) the Eh value decreases with time from 14 days to one month
377
and (b) for the highest Tc concentration used (10-5 M) the Eh value was unchanged within
378
the analytical uncertainty. Based on the measured redox potentials in combination with
379
thermodynamic considerations the following conclusions can be drawn (at least after 2
380
weeks contact time): (i) for [Tc] = 10-9 M Tc(VII) is reduced to a Tc(IV) species in solution
381
whereas (ii) for [Tc] = 10-8 M Tc(IV) precipitates as a solid phase. In case of Tc = 10-5 M (iii)
382
Tc(VII) might not be fully reduced to Tc(IV) since the measured EhSHE values are above the
383
borderline. Nevertheless, a fraction of Tc(VII) might be reduced since the borderline
384
represents already 50%/50% Tc(VIII)/Tc(IV). In this case the reduced Tc precipitates as a
385
Tc(IV) solid phase.
M
AN
US
CR
IP
T
AC
CE
PT
ED
ACCEPTED MANUSCRIPT
16Figure 3. Pourbaix diagrams for ÄGWS containing different Tc concentrations: (a) 10-5 M, (b) 10-8 M and (c) 10-9 M. Data points are given for oxidized (open symbols) and un-oxidized (filled symbols) ÄD for a contact time of two weeks (squares) and one month (circles).
3.2. Desorption studies
387
3.2.1. Desorption experiments without artificial oxidation 388
Tc desorption was experimentally monitored over one month using sorption samples for
389
which Tc had been previously equilibrated with rock material for three months. Very low Tc
390
desorption was observed in all cases studied irrespective of the nature of the material
391
(oxidized or un-oxidized) used for sorption. For the case of ÄD samples two types of natural
392
groundwater were used, namely Äspö and Grimsel GWs (representing glacial melt water
393
composition with low ionic strength, see Table 2). Tc was detected in the liquid phase only
394
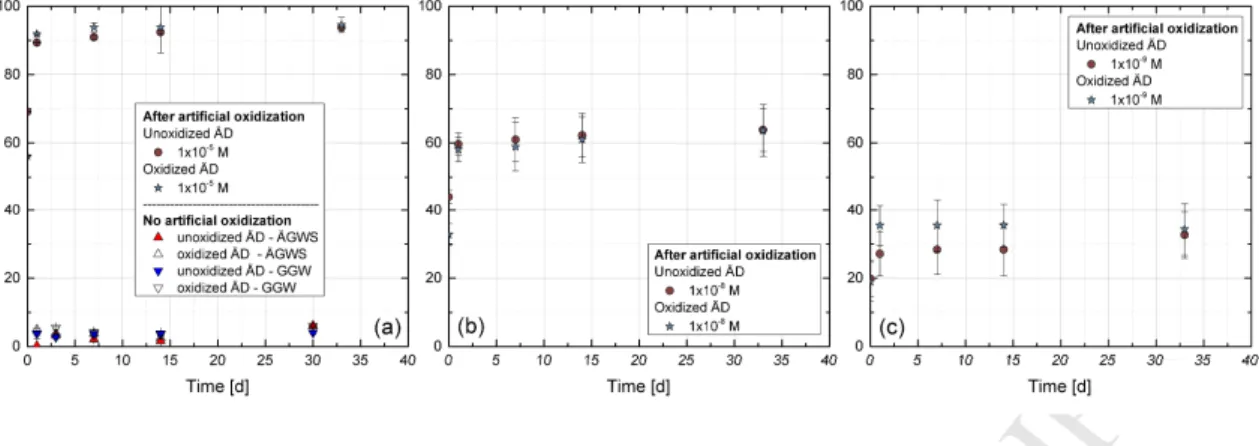
for samples after contact with 10-5 M Tc ÄGWS (Figure 4). After 1 day contact time
395
desorption achieved values of up to 7% of the Tc amount sorbed after the uptake studies.
396
This level remained relatively stable up to 30 days of contact time. For lower Tc
397
concentrations (10-8 M and 10-9 M initial concentration for sorption experiments) no
398
desorption was detected with the detection limit of the analytical method.
M
AN
US
CR
IP
T
AC
CE
PT
ED
ACCEPTED MANUSCRIPT
17Figure 4. Desorption of Tc sorbed to oxidized and un-oxidized ÄD material by ÄGWS after 1 month
pre-oxidation under atmospheric conditions. Results of the experiment after artificial oxidization and contact with ÄGWS and GGW are additionally included in (a). Please note, that these data points have the unit “% desorbed”.
3.2.2. Desorption experiments with artificial oxidation 400
Desorption kinetics for ÄD with different [Tc]initial after sample pre-oxidation is given in Figure
401
4. Pre-oxidation of the ÄD samples under aerobic conditions for 1 month before addition of
402
ÄGWS changed the Tc desorption behaviour drastically (Figure 4). Both sorption experiments
403
with originally oxidized and un-oxidized materials revealed the same desorption behaviour.
404
Desorption is fast with the main part of technetium being released after a few seconds
405
contact time and after one day a concentration plateau value was reached.
406
3.3. Spectroscopic analyses
407
3.3.1. X-ray photoelectron spectroscopy (XPS) 408
XPS analysis of an un-oxidized ÄD disc fragment after contacting with 10-5 M Tc(VII) in ÄGWS
409
for2 months under Ar atmosphere in the glovebox revealed that Tc is associated to mafic
410
(dark) minerals only (see Figure A.2), whereas on felsic (light) minerals no Tc was found.
411
Figure 5 (left) shows the measured Tc 3d XPS spectra with the characteristic 3d3/2 and 3d5/2
412
peak
M
AN
US
CR
IP
T
AC
CE
PT
ED
ACCEPTED MANUSCRIPT
18Figure 5. (left) Tc 3d XPS narrow scan spectrum of an ÄD sample after contacting with
Tc(VII)-containing ÄGWS. The green (dashed) and blue (dotted) curves show the fits to the 3d3/2 and 3d5/2 XPS
elemental lines, respectively, the red line represents the residuum. (right) Normalized Tc K-edge XANES spectra of a sample after sorption of Tc onto ÄD and of Tc(IV) and Tc(VII) references.
positions. Due to the rather low Tc concentration used in the sorption experiment on the ÄD
414
disc the spectra is quite noisy. Both Tc(VII) and Tc(IV) should have two 3d peaks (3d5/2 and
415
3d3/2) for each oxidation state. Since there are only two peaks in the area of interest, the
416
conclusion is that there is only one Tc oxidation state present at the mineral surface, and the
417
position of Tc(IV) 3d5/2 (TcO2) at 256.8 eV reference line is closer to the experimental data
418
(255.9 eV) than the Tc(VII) 3d5/2 (NaTcO4) 259.7 eV reference line. It was therefore
419
concluded that Tc found on the ÄD surface is in the tetravalent oxidation state. Binding
420
energy reference lines for TcO2 and NaTcO4 were taken from (Wester et al., 1987).
421
3.3.2. X-ray absorption near-edge structure (XANES) 422
XANES analysis provides bulk information on the Tc oxidation states after interaction of 10-3
423
M Tc with ÄD. Normalized Tc K-edge XANES spectra are presented in Figure 5 (right) for Tc
424
on ÄD together with Tc(IV) and Tc(VII) references. The Tc K-edge XANES spectra of the TcO2
425
and TcO4-reference materials have characteristic spectral features, which readily allow Tc
426
oxidation state characterization. For example, the spectrum of the Tc(VII) reference, where
427
Tc is surrounded by four oxygen atoms in tetrahedral conformation, exhibits a pre-edge
428
absorption resonance at about 21,050 eV generated by the 1s → 5p/4d transijon (Altmaier
M
AN
US
CR
IP
T
AC
CE
PT
ED
ACCEPTED MANUSCRIPT
19et al., 2011b). Since Tc(IV) generally possesses octahedral coordination, this transition is
430
forbidden and the pre-edge feature cannot be seen in the spectrum of the Tc(IV) reference
431
compound. The overall shape and energy position of the rising absorption edge of the Tc
K-432
edge XANES spectrum of Tc on Äspö diorite is similar to the TcO2 reference without the
pre-433
edge feature of Tc(VII). These fingerprint approach allows to identify Tc(IV) as dominating Tc
434
species on ÄD in line with the XPS results.
435
4.
Discussions
436
4.1. Tc uptake mechanisms
437
The spectroscopic investigations described above together with the batch
438
sorption/desorption experimental results and the thermodynamic calculations demonstrate
439
that Tc retention in a reducing condition is always coupled to a reduction process from
440
Tc(VII) to Tc(IV). Tc(VII) shows no or only very weak sorption. Thus, the mechanism leading
441
to the removal of Tc from solution may be attributed to (i) a sorption/surface complexation
442
of a Tc(IV) species after reduction in solution by e.g. dissolved Fe(II) and/or (ii) precipitation
443
of poorly soluble TcO2·1.6H2O(s) again due to Tc(VII) reduction in solution by e.g. dissolved
444
Fe(II) species. Especially in those experiments with the highest Tc concentration a
445
reduction/precipitation process might occur, as the Tc(IV) solubility limit of 4.4×10⁻⁹ M (Duro
446
et al., 2006) should be significantly exceeded in case of reduction. A third possible
447
mechanism of Tc retention could be (iii) the Tc(VII) reduction by structurally bound or
448
surface bound Fe(II) species. A general scheme of the processes potentially involved into
449
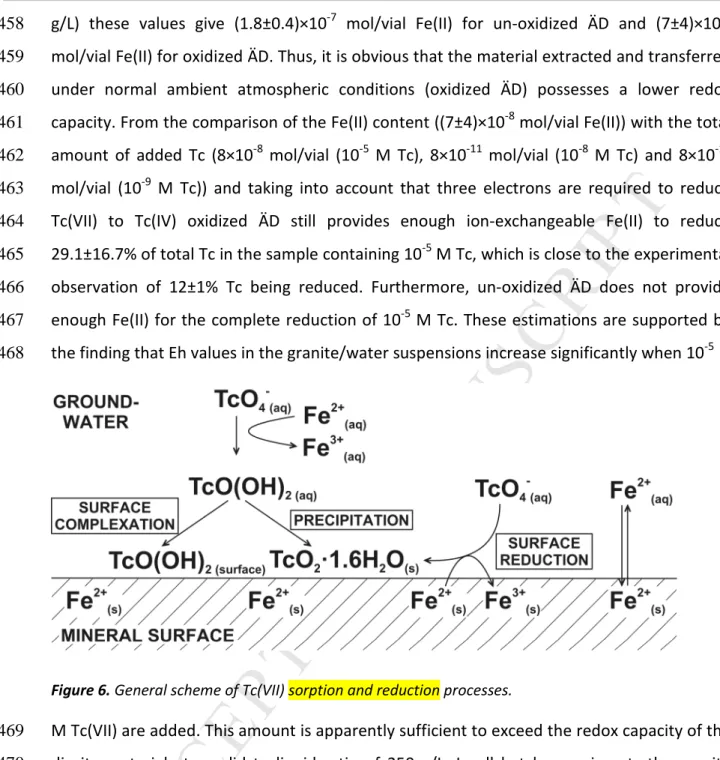
Tc(VII) immobilization is shown in Figure 6.
450
Considering only Fe(II) as a potential reducing agent for Tc(VII)/Tc(IV) the transformation
451
follows according to equation (11):
452
(11)
453
In a first attempt we simply tried to assess whether the available amount of Fe(II) is
454
sufficient to reduce added Tc(VII). The ion-exchangeable Fe(II) content was taken as an
455
approximation for the readily “available Fe(II)” and decreases from (2.2±0.5)×10-5 M in
un-456
oxidized ÄD to (9±5)×10-6 M in oxidized ÄD. Based on the solid to liquid ratio chosen (250
M
AN
US
CR
IP
T
AC
CE
PT
ED
ACCEPTED MANUSCRIPT
20g/L) these values give (1.8±0.4)×10-7 mol/vial Fe(II) for un-oxidized ÄD and (7±4)×10-8
458
mol/vial Fe(II) for oxidized ÄD. Thus, it is obvious that the material extracted and transferred
459
under normal ambient atmospheric conditions (oxidized ÄD) possesses a lower redox
460
capacity. From the comparison of the Fe(II) content ((7±4)×10-8 mol/vial Fe(II)) with the total
461
amount of added Tc (8×10⁻⁸ mol/vial (10-5 M Tc), 8×10-11 mol/vial (10-8 M Tc) and 8×10-12
462
mol/vial (10-9 M Tc)) and taking into account that three electrons are required to reduce
463
Tc(VII) to Tc(IV) oxidized ÄD still provides enough ion-exchangeable Fe(II) to reduce
464
29.1±16.7% of total Tc in the sample containing 10-5 M Tc, which is close to the experimental
465
observation of 12±1% Tc being reduced. Furthermore, un-oxidized ÄD does not provide
466
enough Fe(II) for the complete reduction of 10-5 M Tc. These estimations are supported by
467
the finding that Eh values in the granite/water suspensions increase significantly when 10-5
468
Figure 6. General scheme of Tc(VII) sorption and reduction processes.
M Tc(VII) are added. This amount is apparently sufficient to exceed the redox capacity of the
469
diorite material at a solid to liquid ratio of 250 g/L. In all batch experiments the granite
470
material should provide enough Fe(II) for the Tc(VII) reduction at lower [Tc]tot.
471 472
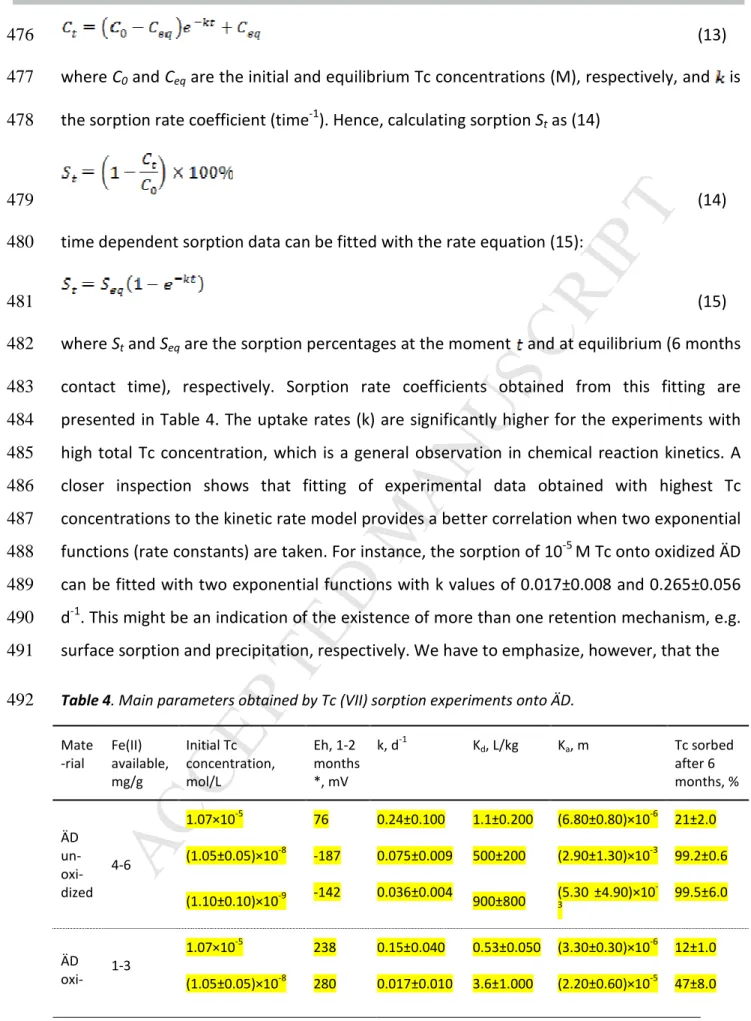
4.2. Sorption parameters
473
The temporal change in Tc concentration during the batch sorption experiment can be
474
described with an exponential decay equation (13):
M
AN
US
CR
IP
T
AC
CE
PT
ED
ACCEPTED MANUSCRIPT
21 (13) 476where C0 and Ceq are the initial and equilibrium Tc concentrations (M), respectively, and is
477
the sorption rate coefficient (time-1). Hence, calculating sorption St as (14)
478
(14)
479
time dependent sorption data can be fitted with the rate equation (15):
480
(15)
481
where St and Seq are the sorption percentages at the moment and at equilibrium (6 months
482
contact time), respectively. Sorption rate coefficients obtained from this fitting are
483
presented in Table 4. The uptake rates (k) are significantly higher for the experiments with
484
high total Tc concentration, which is a general observation in chemical reaction kinetics. A
485
closer inspection shows that fitting of experimental data obtained with highest Tc
486
concentrations to the kinetic rate model provides a better correlation when two exponential
487
functions (rate constants) are taken. For instance, the sorption of 10-5 M Tc onto oxidized ÄD
488
can be fitted with two exponential functions with k values of 0.017±0.008 and 0.265±0.056
489
d-1. This might be an indication of the existence of more than one retention mechanism, e.g.
490
surface sorption and precipitation, respectively. We have to emphasize, however, that the
491
Table 4. Main parameters obtained by Tc (VII) sorption experiments onto ÄD.
492 Mate -rial Fe(II) available, mg/g Initial Tc concentration, mol/L Eh, 1-2 months *, mV k, d-1 Kd, L/kg Ka, m Tc sorbed after 6 months, % ÄD un- oxi-dized 4-6 1.07×10⁻⁵ 76 0.24±0.100 1.1±0.200 (6.80±0.80)×10-6 21±2.0 (1.05±0.05)×10-8 -187 0.075±0.009 500±200 (2.90±1.30)×10-3 99.2±0.6 (1.10±0.10)×10-9 -142 0.036±0.004 900±800 (5.30 ±4.90)×10 -3 99.5±6.0 ÄD oxi-1-3 1.07×10⁻⁵ 238 0.15±0.040 0.53±0.050 (3.30±0.30)×10-6 12±1.0 (1.05±0.05)×10-8 280 0.017±0.010 3.6±1.000 (2.20±0.60)×10-5 47±8.0
M
AN
US
CR
IP
T
AC
CE
PT
ED
ACCEPTED MANUSCRIPT
22 dized (1.10±0.10)×10-9 264 0.007 ±0.001 22±8 (1.40±0.5)×10-4 84±6.0* values in Fig. 3; N/A – not applicable.
493 494
system consists of highly coupled redox, precipitation and surface interaction phenomena. A
495
simple interpretation of sorption mechanisms just based on reaction rate analysis is certainly
496
not feasible. This becomes obvious when looking to literature data. Exponential fitting of Tc
497
sorption data from Bondietti and Francis (1979) gives a k value of around 1.1±0.4 d-1 for an
498
initial Tc concentration of 1.1×10⁻⁷ M with Westerly granite as a solid material (167 g/L
499
solid/liquid ratio). The pH/Eh values for this material were also comparable (pH 8, Eh -100
500
mV) to the conditions used in present work, but neither Fe(II) content nor specific surface
501
area of the material were specified in the paper, which could significantly contribute to the
502
enhanced rates found in Bondietti and Francis (1979).
503
Distribution coefficients (Kd in L/kg) obtained for Tc sorption onto Äspö material were
504
calculated using the following equation (16):
505
(16)
506
where and are the equilibrium concentrations of solutes in aqueous and solid phases,
507
respectively, and are the initial and final aqueous radionuclide activities at equilibrium
508
(Bq/mL), respectively, is the volume of the aqueous phase (mL) and is the solid
509
mass (g). Typical Kd values obtained within the present work are presented in Table 4
510
together with measured initial Tc concentrations, amount of ion-exchangeable Fe(II) and
511
redox potentials. From a thermodynamic point of view the Kd approach assumes a fully
512
reversible sorption process, but in most papers it is used even when irreversible
513
reduction/precipitation processes are involved (Albinsson et al., 1991; Allard et al., 1979;
514
Kaplan and Serne, 1998). In the report of USEPA (1999) authors describe “conditional” Kd
515
values for the interpretation of experimental data in cases when the rigorous application of
516
the Kd approach is prohibited (e.g. in non-equilibrium, irreversible, or solubility controlled
517
systems). In the present work Kd values are considered as conditional distribution
M
AN
US
CR
IP
T
AC
CE
PT
ED
ACCEPTED MANUSCRIPT
23coefficients. For a better comparison of the retention behaviour with literature data, Kd
519
should be normalized to the specific surface area of the solid material used in the
520
experiments according to the equation (17):
521
(17)
522
where Ka is the surface area normalized distribution coefficient (m) and SBET is the specific
523
surface area of the solid determined by N2-BET (m2/g). Ka values for the ÄD material are
524
shown in Table 4. Since the surface area of oxidized and un-oxidized ÄD remains the same,
525
this normalization does not affect the comparison between them. The Kd values obtained for
526
the oxidized material (see Table 4; 10-5 M Tc) in this study with 0.53±0.05 L/kg for oxidized
527
ÄD are in good agreement with recently published data of Videnska and Havlova (2012) who
528
reported a Kd value of 0.3 L/kg under oxidizing conditions for 1.6×10⁻⁴M 99Tc on granitic rocks
529
from Melechov Massive, Centre Bohemian Massive, Czech Republic (> 0.8 mm size fraction).
530
Since the surface area was not mentioned in the publication, Ka values cannot be calculated
531
for these results. Batch-type studies on Tc uptake with well-preserved un-oxidized crushed
532
granitic rocks can hardly be found in the literature. We have compared the data obtained
533
with experiments performed under artificial reducing conditions. Ito and Kanno (1988) have
534
published the Tc distribution between solution and granitic rocks (0.49 – 0.83 mm size
535
fraction, 10-12 M [95mTc]) together with a number of other minerals under oxidizing and
536
reducing conditions. Under oxidizing conditions (in 0.16 M NaNO3) Kd values of 0.1 L/kg (Ka =
537
4.8×10⁻⁷ m) were obtained, while under reducing conditions (0.1 M NaBH4 and 0.16 M
538
NaNO3) values of 45.6 L/kg (Ka = 2.2×10⁻⁴ m) increasing up to 68 L/kg (Ka = 3.2×10⁻⁴ m) with
539
decreasing NO3- concentration down to 0.016 M could be determined. The paper by
540
McKinley and Scholtis (1993) summarized the data on Kd values of Tc on different materials
541
including granitic rocks used for the safety assessment of waste disposal at that time. Here
542
the values range from 0 to 250 L/kg depending on the experimental conditions and the
543
origin of the rocks. The authors emphasize that Tc sorption under oxidizing conditions is
544
normally very low or zero, and for reducing conditions Kd values increase by 1–2 orders of
545
magnitude.
M
AN
US
CR
IP
T
AC
CE
PT
ED
ACCEPTED MANUSCRIPT
24 4.3. Tc desorption 547As was shown in the results section, Tc desorption without artificial oxidation of the material
548
is almost negligeable. We suppose that the relatively rapid establishment of a steady state
549
for the Tc concentration after only 1 day desorption is the consequence of washing out
550
residual Tc(VII) in the porewater rather than desorption of sorbed or precipitated Tc(IV). For
551
the desorption experiments after artificial oxidation, the general trend of the fast desorption
552
up to a plateau value might be explained by the rapid oxidation of surface associated Tc(IV)
553
to the heptavalent oxidation state and thus to the (almost) non-sorbing pertechnetate anion
554
whereas strongly sorbing un-oxidized Tc(IV) does not have any significant contribution to the
555
desorption processs. The same observations were made by numerious investigators (Begg et
556
al., 2008; Burke et al., 2006; Morris et al., 2008), where Tc(IV) oxidation to Tc(VII) was found
557
to be a driving force for the Tc desorption process. Taking into account Tc uptake
558
mechanisms discussed in section 4.1, one can assume two different mechanisms, namely
559
predominantly surface complexation for log [Tc]tot = -8 and -9 and TcO2·1.6H2O(s)
560
precipitation for log [Tc]tot = -5 governing the Tc sorption process. Consequently, for the
561
same initial Tc concentration, a similar Tc desorption behaviour can be expected for oxidized
562
and un-oxidized systems, which is in a good agreement with the experimental data observed
563
for the ÄD. A higher degree of desorption observed for the samples with higher [Tc]initial
564
might be explained by the relatively easier oxidation of the surface associated TcO2·1.6H2O(s)
565
phase in comparison to the surface complexed Tc(IV) species (see Table 5) which are
566
probably more recalcitrant to remobilization during oxidation. Similar presumptions were
567
expressed (Begg et al., 2008; Burke et al., 2006; Morris et al., 2008), but the mechanistical
568
nature of this resistance is still a matter of further research.
569
Table 5. Comparison of the sorption/desorption values for the oxidized and un-oxidized ÄD for the
570
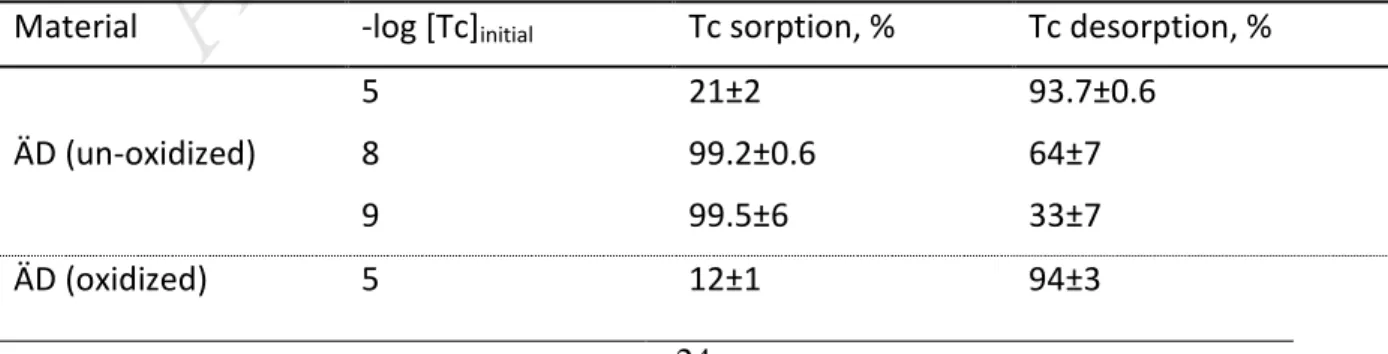
artificially oxidized sample series. Desorption time of 1 month. 571
Material -log [Tc]initial Tc sorption, % Tc desorption, %
ÄD (un-oxidized)
5 21±2 93.7±0.6
8 99.2±0.6 64±7
9 99.5±6 33±7
M
AN
US
CR
IP
T
AC
CE
PT
ED
ACCEPTED MANUSCRIPT
25 8 47±8 64±8 9 84±6 35±8 572 4.4. Spectroscopic analyses 573According to the XPS results (see Figure 5 left), the Tc signal was detected only on dark
mica-574
type mineral surface (most likely biotite or magnetite), which contains structural Fe(II). It is
575
well known that Tc(VII) is concentrated on Fe(II)-containing minerals (Burke et al., 2010;
576
Fredrickson et al., 2009; McBeth et al., 2011) as “hotspots” due to surface (heterogeneous)
577
reduction into insoluble Tc(IV) oxide phase or/and homogeneous reduction in the solution
578
into soluble Tc(IV) species with subsequent sorption on the mineral surface. According to the
579
results of Peretyazhko et al. (2008a) heterogeneous Tc(VII) reduction on the surface
580
associated Fe(II) is orders of magnitude faster than the homogeneous reduction by aqueous
581
Fe2+ and may occur on the Fe(II)-containing mineral surfaces. XANES analysis of the Äspö
582
diorite contacted with Tc-containing ÄGWS indicated the presence of Tc(IV) as well.
583
4.5. Thermodynamic modelling
584
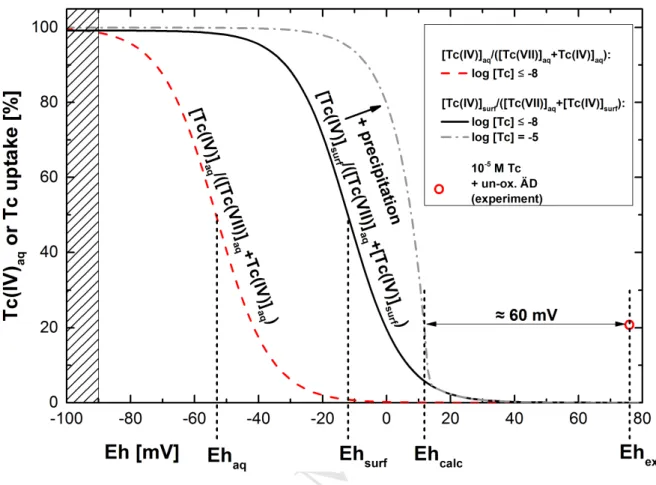
The general scheme of the modelling applied is described in Section 2.6. A similar calculation approach was applied in previous studies related to the modelling of Pu sorption to kaolinite (Marsac et al., 2015a) and Np sorption on illite (Marsac et al., 2015b) with respect to the differences in chemistry. Figure 7 shows the Tc(IV) fraction in the aqueous phase modelled with PHREEQC for log [Tc]tot ≤ -8 as a function of the redox potential. For pH = 8.0 and I = 0.1 M, Eh of the [Tc(VII)]aq/[Tc(IV)]aq borderline is -53 mV (Ehaq, calculated from equation (5)), as highlighted in Figure 7. To account for sorption processes (see equation (9)), log KVII/IV,surf is determined as follows. The site density is arbitrarily set equal to 1 site/nm2, which is the same order of magnitude as commonly observed for several minerals (Burlakov et al., 2000; Jeppu and Clement, 2012). The value for log KVII/IV,surf is strongly dependent on this arbitrarily chosen site density. At Eh values ≤ -90 mV almost all Tc is calculated to be Tc(IV) (see Figure 8). Such conditions prevail in the experiments with un-oxidized ÄD and log [Tc]tot ≤ -8. Taking these experimental data, log KVII/IV,surf is deduced by a fitting procedure and is found to be equal to 35.7 (see equation (8)). This value is kept constant for all the following calculations.
M
AN
US
CR
IP
T
AC
CE
PT
ED
ACCEPTED MANUSCRIPT
26Figure 7. Tc(IV) fractions depending on the redox potential (pH 8, I = 0.1 M) calculated according to
the equations (4) and (9), respectively. Ehexp corresponds to the measured redox potential; Ehcalc
relates to the calculated redox potential where 21% of Tc is removed from solution in the experiment with log [Tc]tot = -5; [Tc(VII)]aq/[Tc(IV)]aq and [Tc(VII)]aq/[Tc(IV)]surf borderline redox potentials are as
well marked by vertical dashed lines; the shaded area at the left side shows the Eh region where model calculations predict quantitative uptake.
The borderline redox potential where [Tc(IV)]surf and [Tc(VII)]aq exist in equimolar
585
concentrations, Ehsurf, is found equal to -12 mV in accordance to the equation (10). In
586
agreement with the findings of Marsac et al. (Marsac et al., 2015a; Marsac et al., 2015b) for
587
Np and Pu sorption to clays, the strong sorption behaviour of Tc(IV) shifts the borderline Eh
588
to higher values as compared to that for the [Tc(IV)]aq/[Tc(VII)]aq ratio, Ehaq, in aqueous
589
solution in the absence of mineral surfaces. For log [Tc]tot = -5 precipitation of TcO2·1.6H2O(s)
590
is predicted, which represents the 2nd retention mechanism, and extends the stability field of
591
Tc(IV) further. In the respective experiment the measured Eh value (Ehexp) is 76 mV ± 50mV,
![Figure 1: Typical evolution for Eh measurement in synthetic Äspö groundwater simulant with un- un-oxidized diorite sample ([Tc] = 10 -10 M)](https://thumb-eu.123doks.com/thumbv2/123doknet/14776300.593946/13.892.287.745.274.551/figure-typical-evolution-measurement-synthetic-groundwater-simulant-oxidized.webp)