Publisher’s version / Version de l'éditeur:
Vous avez des questions? Nous pouvons vous aider. Pour communiquer directement avec un auteur, consultez la
première page de la revue dans laquelle son article a été publié afin de trouver ses coordonnées. Si vous n’arrivez
pas à les repérer, communiquez avec nous à PublicationsArchive-ArchivesPublications@nrc-cnrc.gc.ca.
Questions? Contact the NRC Publications Archive team at
PublicationsArchive-ArchivesPublications@nrc-cnrc.gc.ca. If you wish to email the authors directly, please see the
first page of the publication for their contact information.
https://publications-cnrc.canada.ca/fra/droits
L’accès à ce site Web et l’utilisation de son contenu sont assujettis aux conditions présentées dans le site
LISEZ CES CONDITIONS ATTENTIVEMENT AVANT D’UTILISER CE SITE WEB.
Toxicon: X, 6, 2020-03-23
READ THESE TERMS AND CONDITIONS CAREFULLY BEFORE USING THIS WEBSITE.
https://nrc-publications.canada.ca/eng/copyright
NRC Publications Archive Record / Notice des Archives des publications du CNRC :
https://nrc-publications.canada.ca/eng/view/object/?id=546afb45-99fe-486d-a38c-0fe7de9158be
https://publications-cnrc.canada.ca/fra/voir/objet/?id=546afb45-99fe-486d-a38c-0fe7de9158be
NRC Publications Archive
Archives des publications du CNRC
This publication could be one of several versions: author’s original, accepted manuscript or the publisher’s version. /
La version de cette publication peut être l’une des suivantes : la version prépublication de l’auteur, la version
acceptée du manuscrit ou la version de l’éditeur.
For the publisher’s version, please access the DOI link below./ Pour consulter la version de l’éditeur, utilisez le lien
DOI ci-dessous.
https://doi.org/10.1016/j.toxcx.2020.100031
Access and use of this website and the material on it are subject to the Terms and Conditions set forth at
In vitro hepatic biotransformation of the algal toxin pectenotoxin-2
Sandvik, Morten; Miles, Christopher O.; Wilkins, Alistair L.; Fæste, Christiane
Toxicon:X 6 (2020) 100031
Available online 23 March 2020
2590-1710/© 2020 The Authors. Published by Elsevier Ltd. This is an open access article under the CC BY license (http://creativecommons.org/licenses/by/4.0/).
In vitro hepatic biotransformation of the algal toxin pectenotoxin-2
Morten Sandvik
a,*, Christopher O. Miles
a,b, Alistair L. Wilkins
a,c, Christiane Fæste
aaNorwegian Veterinary Institute, P. O. Box 750 Sentrum, NO-0106, Oslo, Norway
bBiotoxin Metrology, Measurement Science and Standards, National Research Council, 1411 Oxford Street, Halifax, NS, B3H 3Z1, Canada cWaikato University, Private Bag 3105, Hamilton, 3240, New Zealand
A B S T R A C T
We have investigated the in vitro metabolism of pectenotoxin-2 (PTX-2) using primary hepatocytes from Wistar rats in suspension. Puriied PTX-2 was rapidly metabolized. Two major and several minor oxidized PTX-2 metabolites were formed, none of which had retention times corresponding to PTX-1, -11, or 13. Hydrolysis products, such as PTX-2 seco acid, were not observed. Preliminary multi-stage LC-MS analyses indicated that the major hepatic PTX-2 metabolites resulted from the insertion of an oxygen atom at the positions C-19 to C-24, or at C-44. The rapid oxidative metabolism may explain the low oral toxicity of PTXs observed in vivo studies.
1. Introduction
Pectenotoxins (PTXs) are a group of marine polyether-lactone toxins exclusively produced by dinolagellate algae of Dinophysis species (Yasumoto, 1989; Lee et al., 1989; Farabegoli et al., 2018). Long-term observation of their abundance in Northern seas have shown a nega-tive correlation with increasing sea surface temperatures and wind speed, and consequently on the production of PTXs (Hinder et al., 2012). The toxins can get into the food chain in bivalve molluscs and crusta-ceans that feed on PTXs-containing microalgae. They have been detec-ted shellish in Australia, Japan, New Zealand and different European countries (Suzuki et al., 2001a, 2005, 2001b; Miles et al., 2004a). In an assessment on the occurrence of PTX-2 in different shellish in 2009, the European Food Safety Authority (EFSA) determined the toxin in only 18% of the surveyed shellish samples, mostly in mussels and oysters (Alexander et al., 2009). Evaluating the risk for human consumers of shellish, EFSA established an acute reference dose (ARfD) of 0.8 μg
PTX-2 equivalents/kg body weight (bw) based on a lowest-observed-adverse-effect-level (LOAEL) of 250 μg/kg bw for
in-testinal toxicity of PTX-2 observed in mice. Considering the lack of suficient data, a provisional toxicity equivalent factor (TEF) of 1 was used for PTX-1, PTX-2, PTX-3, PTX-4, PTX-6 and PTX-11, whereas the much less toxic PTX-7, PTX-8, PTX-9, PTX-2 seco acid (SA) and 7-epi-PTX-2 SA were not assigned TEFs (Alexander et al., 2009).
At least 14 PTX analogues have been described, of which PTX-2, PTX- 11, PTX-12, PTX-13 and PTX-14 are produced by Dinophysis, whereas all others are products of metabolism reactions in shellish or spiroketal stereoisomers (Sasaki et al., 1998; Suzuki et al., 2003; Miles et al.,
2006a; Suzuki et al., 2006; Alfonso et al., 2014). PTX-2 appears to be the main precursor, of which derivatives such as PTX-1, PTX-3, and PTX-6 are formed through progressive oxidative biotransformation in the gut of bivalves (Suzuki et al., 1998; Burgess and Shaw, 2001), although PTX-1 has also been reported in algae (Krock et al., 2008). PTX-2 SA, a hydrolysis product of PTX-2, has been detected in different shellish species (Daiguji et al., 1998; Suzuki et al., 2001a, 2001b; Miles et al., 2004a). Incubation of PTX-2 with homogenates of green-lipped mussels (Perna canaliculus) and scallops (Pecten novaezelandiae) has revealed that the hydrolysis to PTX-2 SA is enzyme-catalysed (Suzuki et al., 2001a, 2001b), and studies with blue (Mytilus edulis) and green-lipped mussels have shown that the hydrolytic reaction is rapid and that the enzymes involved are water-soluble (Miles et al., 2004a).
There is a large difference in toxicity between the intraperitoneal (i. p.) and per oral (p.o.) application of PTX-2 to mice (Alexander et al., 2009). Both, incomplete absorption and a high elimination rate due to extensive biotransformation might cause low systemic concentrations after oral application (Masimirembwa et al., 2003). However, little is known about PTX toxicokinetics besides hydrolysis of PTX-2 to PTX-2 SA and oxidation to PTX-1, PTX-3 and PTX-6 in scallops (Suzuki et al., 1998; Burgess and Shaw, 2001). Preliminary data from studies in mice with single oral doses of 0.3, 1 and 5 mg/kg bw PTX-2 suggested low uptake from the gastrointestinal tract and considerable metabolic elimination (Burgess and Shaw, 2001; Alexander et al., 2009). In vivo biotransformation processes such as the rapid hydrolysis to non-toxic seco acid forms like PTX-2 SA or the formation of oxidized PTXs like PTX-11 could have contributed to decrease the amount of PTX-2 that was detectable in different organs and blood (MacKenzie et al., 2005). * Corresponding author.
E-mail address: morten.sandvik@vetinst.no (M. Sandvik).
Contents lists available at ScienceDirect
Toxicon: X
journal homepage: www.journals.elsevier.com/toxicon-x
https://doi.org/10.1016/j.toxcx.2020.100031
Toxicon: X 6 (2020) 100031
2
In mouse bioassays for the determination of toxic potentials, PTX-11 displayed a similar toxicity proile as PTX-2, with an LD50 of 0.24 mg/kg
bw i. p., but no effects were detected after the application of as much as 5 mg/kg bw p. o. (Suzuki et al., 2006). Since PTX-11is, in contrast to PTX-2, relatively resistant to enzymatic hydrolysis in mussels ( MacK-enzie et al., 2005), this pathway is probably not mainly responsible for the lack of oral toxicity of the PTXs. The discrepancy regarding the considerable cellular and i. p. toxicity of the PTXs on the one hand, and the lack of toxicity after p. o. administration on the other, could there-fore originate from the toxicokinetic characteristics of this compound class. However, toxicokinetic parameters after oral and intravenous application of important PTXs have not been determined or predicted for animals or humans.
Primary hepatocytes or hepatic microsomes represent well- established systems to study drug metabolism in vitro (Iwatsubo et al., 1997; Ito et al., 1998; Nagilla et al., 2006; Fagerholm, 2007; Houston and Galetin, 2008). Freshly isolated hepatocytes in suspension have been used in short-term incubations under kinetic conditions to predict
in vivo clearances. Assays with test substance in excess are used to
identify major metabolites. Primary hepatocytes retain the capacity for biotransformation of xenobiotics by different oxidative phase I and conjugative phase II pathways (Blanchard et al., 2006). In the present study, we report the oxidative metabolism of PTX-2 by fresh rat hepa-tocytes, and the partial characterization of the metabolites by LC-MS/MS analysis.
2. Materials and methods
2.1. Materials
PTX-2 was puriied from an algal bloom in Sognefjorden, Norway (Miles et al., 2004a, 2004b). After puriication by application to basic alumina, the fraction containing PTXs was applied to a column of Lichroprep RP-18 (17 � 2 cm; 40–63 μm, Merck, Germany), and the
column was eluted by a step-wise gradient of methanol (MeOH) in water. Fractions containing most of the PTX-2 were applied to a 32 � 1 cm Lichroprep RP-18 column. Fractions were eluted by a linear gradient of MeOH in water, and collected and monitored by LC-MS. PTX-1 was a gift from T. Yasumoto (Japan Food Research Laboratories). Hepes buffer and collagenase (type IV) were obtained from Sigma (Buchs, Switzerland). All other chemicals were of analytical grade.
2.2. Preparation of primary rat hepatocytes
Isolated rat liver cells were prepared by a two-step collagenase ex
vivo perfusion from male Wistar rats, weighing 250–300 g and kept
under routine laboratory conditions with free access to standard labo-ratory pelleted feed and water (Seglen, 1976). The hepatocytes were separated by gradient centrifugation (Fæste and Moldes-Anaya, 2016), suspended in PBS, and stored for up to 1 h on ice before use (Sidelmann et al., 1996; Gebhardt et al., 2003). Cell viability was determined microscopically (Leica DMIL microscope; Leica Microsystems GmBH, Wetzlar, Germany), using Trypan blue staining and a Neubauer-counting chamber. About 2.5 � 108 living cells per liver were
obtained on average, and only preparations with viabilities >92% were used in the metabolism experiments.
2.3. In vitro hepatocyte assays under kinetic conditions
The hepatocyte suspension was diluted with KRB–HEPES buffer pH 7.4 (Krebs-Ringer buffer containing 145 mM NaCl, 5.4 mM KCl, 0.8 mM MgSO4, 0.33 mM Na2HPO4, 0.34 mM KH2PO4, 2 mM CaCl2, and 20 mM
HEPES) to a inal assay concentration of 2.5 � 106 cells/mL. The
in-cubations were performed in capped round-bottom glass tubes in a total assay volume of 5 mL. After pre-incubation for 5 min at 37 �C in a
shaking water bath, 5–25 μL of a PTX-2 stock solution containing 1 mg/
mL PTX-2 in MeOH were added, resulting in initial concentrations of 1–5 μg/mL PTX-2 in the assay. Aliquots (300 μL) were taken after 0, 2.5,
5, 7.5, 10, 15, 30, and 60 min of incubation and directly transferred into 300 μL ice-cold acetonitrile (ACN) in Eppendorf tubes. Two control
samples were included in the experiments, a blank matrix control and a PTX-2 stability control. After centrifuging all samples at 16,000 g for 1 min (5415D centrifuge; Eppendorf AG, Hamburg, Germany), the su-pernatants were transferred to HPLC vials for analysis by liquid chro-matography mass spectrometry (LC-MS) to determine the half-life of PTX-2 in rat hepatocytes.
2.4. In vitro hepatocyte assays with substrate saturation
Six replicate preparative incubations each containing 160 μg PTX-2
were performed for 30 min as described above. The reactions were stopped by transferring the complete 5 mL-assays into 10 mL ice-cold ACN in 50 mL glass tubes and centrifuged at 9000 g for 10 min (J2- MC; Beckman Instruments, Palo Alto, CA, USA). The six supernatants were combined, and evaporated to dryness in vacuo using a rotary evaporator (Büchi R-200, Flavil, Switzerland). The residue was dis-solved in 50 mL water and subsequently re-extracted with diethyl ether (3 � 30 mL). The combined ether extracts were evaporated to dryness in
vacuo, re-dissolved in 1 mL ACN–water (40–60) and submitted to
pre-parative high performance liquid chromatography (HPLC).
2.5. Separation of PTX-2 metabolites by preparative HPLC
The concentrated sample was fractionated by lash column chro-matography using a glass column (10 � 130 mm), slurry-packed with 5 g LiChroprep RP-18 (40–63 μm; Merck, Germany) in ACN and conditioned
with 40% ACN in water. The column was eluted using a step-wise gradient of 40%, 60%, and 80% ACN in water (5 mL per step) and, inally, 20 mL 100% ACN. Thirty-ive 1-mL fractions were collected manually into 10 mL glass tubes. Substance concentrations in the frac-tions were determined by LC-MS, and accordingly, the fracfrac-tions 4, 5, 6, 7, 8 and 12 were combined for further analysis. They were concentrated to 300 μL by evaporation in a nitrogen stream at 40 �C and in the
following puriied by preparative HPLC. Preparative HPLC was per-formed on a 250 � 10 mm, 5 μm, Supelcosil LC-18 DB semi-preparative
column (Supelco, Bellefonte, PA, USA) using a Gilson model 321 pump, a model 232 XL sampling injector and a 206 fraction collector (Gilson, Middelton WI, USA). Metabolites were eluted with isocratic mixtures of ACN and water at 3 mL/min. Fractions were collected manually by monitoring absorbance at 235 nm with a model 1100 series G1315A diode array detector (Agilent, Santa Clara, CA).
2.6. LC-MS and LC-MSn analysis
LC-MS analyses of centrifuged aliquots from the kinetic assays were performed under reversed phase conditions using a Symmetry C18
col-umn (5 μm, 3.9 � 150 mm) (Waters, Milford, MA, USA) and a binary LC
pump (Finnigan Mod. 250) coupled to an Autosampler Plus (Thermo Electron Corporation, San Jose, CA, USA). 5–20 μL samples were
injected and eluted using a linear gradient starting with ACN/water (40:60, v/v, both containing 0.1% formic acid and 2 mM ammonium formate) and rising to 100% ACN in 20 min. Isocratic elution with 100% ACN was maintained for 5 min before the eluent was returned to the starting conditions. The low rate was set to 1 mL/min.
Separated metabolite fractions from the preparative HPLC puriica-tion were eluted with a linear gradient from 40% to 100% ACN in 40 min using a Symmetry C18 column (5 μm, 4.6 � 250 mm) (Waters, Milford,
MA, USA). The HPLC system was coupled by an electrospray ionization (ESI) interface to an LCQ linear ion trap mass spectrometer (Thermo Electron Cooperation). The instrument was operated in MS or MSn full-
scan positive ion mode, and spectra were collected from m/z 350–1200. Typical ESI parameters were a spray voltage of 3.5 kV, desolvation
temperature at 250 �C, source temperature at 100 �C and cone gas and
desolvation gas at 40 and 600 L/h N2, respectively. The mass
spec-trometer was operated in MSn mode with argon as collision cell gas at 1 �10 3 Torr. Ionization and MSn collision energy settings were 40–45 eV. Total ion chromatograms (TIC) were measured for all incubation aliquots, and the respective peak retentions, MS, MS2 and MS3 data of PTX-2 and potential metabolites were obtained.
2.7. Calculation of the hepatic clearance of PTX-2 in rats
The in vitro assay clearance (CLassay) of PTX-2 was calculated from
the hepatocyte incubations run with irst order kinetics (CLassay ¼Vassay �ln2/t1/2 [Lh 1]) using the assay volume (Vassay) and the disappearance half-life (t1/2) of the parent compound as determined from the slope of
the linear regression from a semi-logarithmic concentration vs. time plot (Obach, 1999). The intrinsic clearance (CLint), which is independent of
the experimental conditions (CLint ¼CLassay x HC x rL/N [L (h x kg) 1]) [15] was derived from CLassay under consideration of the number of
hepatocytes in the assay (N), the rat hepatocellularity (HC ~ 1.1 � 108/g
liver) (Smith et al., 2008), and the rat liver weight (rL ~ 33 g/kg bw) (Lin and Lu, 1998). In this study, we did not consider potential protein binding of PTX-2 in the hepatocyte incubation and did not include the fraction unbound in the assay (fuassay ¼1) into the calculations (Obach,
1996). The in vivo hepatic blood clearance (CLb) was calculated from
CLint by applying the non-restricted well-stirred model (CLb ¼CLint x Q/(CLint þQ) [L (h x kg) 1]) (Houston, 1994), considering the hepatic blood low in rat (Q ~ 4.2 L (h x kg) 1) (Lin and Lu, 1998). Potential
binding to blood components in vivo was not considered in this study and thus the fraction unbound in blood (fub) set to 1. The maximum
bioavailability (Fmax) of PTX-2 in rats was estimated (Fmax ¼Fa x (1 – (CLb/Q) under the assumption of complete absorption from the
gastro-intestinal tract (Fa ¼1) (De Buck et al., 2007) and negligible non-hepatic elimination. Fmax was ranked according to the criteria for low (0–10%),
moderate (10–30%) and high bioavailability (up to 100%) (Obach, 1996).
3. Results and discussion
3.1. Identity of isolated PTX-2 by LC/MS and LC/MSMS
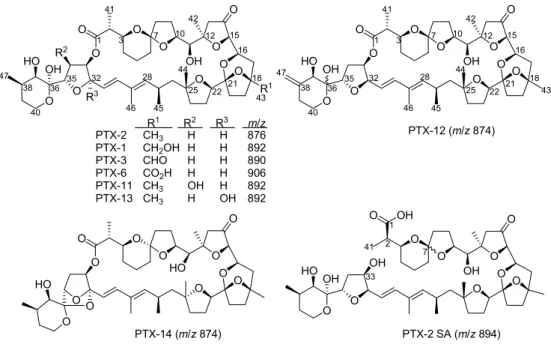
PTX-2 (Fig. 1) was puriied from an algal bloom in Sognefjorden,
Norway (Miles et al., 2004a, 2004b). Reverse-phase chromatography of the ethereal extract, followed by preparative HPLC, provided 13 mg pure PTX-2 with ca. 80% recovery. NMR and LC–MS conirmed the structure and purity of PTX-2 isolated by this method (Miles et al., 2004a). The MS/MS product ion spectrum of PTX-2 was essentially identical to the published PTX-2 reference spectrum, showing the same fragments (Gerssen et al., 2008).
3.2. Kinetics of PTX-2 elimination and metabolite formation in the rat hepatocyte assay
PTX-2 was rapidly metabolized in freshly isolated rat hepatocytes. The disappearance of the parent compound and the formation of the two potential main metabolites M1 and M2 are plotted as a function of the incubation time in Fig. 2. The assay half-live of PTX-2 was comparable in incubations with different start concentrations, indicating linear kinetics (Table 1). At all concentrations, PTX-2 underwent rapid metabolic transformation with 17–20% remaining unchanged after 30 min of
Fig. 1. PTXs in algae and shellish. Functional group patterns and m/z values of [M þ NH4]þions are shown.
Fig. 2. Concentration-versus-time curves of PTX-2 (m/z 881) (▪), M1 (m/z 897) (�) and M2 (m/z 897) (◦), determined by LC–MS during incubation of PTX-2 (1.4 μg/mL) in primary rat hepatocytes. Regression lines are best its for irst- order kinetics.
Toxicon: X 6 (2020) 100031
4
incubation. Metabolism of PTX-2 to other PTX derivatives by shellish, and biosynthesis of analogues in algae, has provided a growing library of compounds for comparison (Yasumoto et al., 1985; Suzuki et al., 1998, 2006; Daiguji et al., 1998; Miles et al. 2004b, 2006b; Halim and Brimble, 2006).
3.3. Prediction of the in vivo hepatic clearance and maximum bioavailability of PTX-2 in rats
The intrinsic clearance (CLint) describes the eficiency of the
meta-bolism enzymes for a compound. CLint can be scaled to the in vivo blood
clearance (CLb), which is a measure for the systemic elimination, by
considering physiological parameters such as hepatocellularity, liver weight, a model of hepatic extraction such as the well-stirred model, and the hepatic blood low. Assuming a negligible inluence of protein binding and unrestricted absorption, the in vitro-based estimate of in vivo data predicted a moderate hepatic blood clearance and bioavailability for PTX-2 in rats. After oral uptake, up to 32% of the compound is predicted to remain unmetabolized after the irst pass through the liver (Table 1). However, the few available in vivo results from mouse studies with oral PTX-2 application indicted a rather limited gastrointestinal absorption (Burgess and Shaw, 2001; Alexander et al., 2009), so that the actual bioavailability is probably considerably lower than the predicted
Table 1
PTX-2 half-lives in primary rat hepatocytes and predicted toxicokinetic parameters.
PTX-2 (μg/mL) t½,assay [h] CLint [l/(h⋅kg)] CLb [l/(h⋅kg)] fmax [%]
1.4 0.19 8.74 2.84 32 2.6 0.16 10.44 3.00 29 4.8 0.20 8.58 2.82 33
Fig. 3. LC-MS chromatograms (scan mode m/z 850–920, [M þ NH4]þ, conditions of LC-MSn analysis) showing PTX-2 and three potential metabolites in 30 min- incubations with rat hepatocytes (left panel). LC-MS spectra displaying [M þ NH4]þand [MþNa]þions of PTX-2 and the PTX-2 metabolites (right panel).
Fig. 4. LC-MS2 chromatogram of monohydroxylated M1 indicating the presence of three isomeric OH-PTX-2 species with [MþNa]þ
ions at m/z 897 (left panel). The species with retention times 18.43 and 18.71 min produce a signiicant fragment ion at m/z 555 for [MþNa]þin MS2 spectra, whereas the third species with retention time 19.06 min produces a signiicant fragment ion at m/z 611 (right panel).
maximal fmax value. Furthermore, caution should be exercised for
compounds undergoing extensive metabolism due to the potential for signiicant extrahepatic metabolism (Obach, 1996; Soars et al., 2002). If PTX-2 was additionally cleared by mechanisms other than liver meta-bolism (e.g. extrahepatically by the kidneys, plasma enzymes, protein binding or chemical instability), the total clearance would be the sum of the individual clearances, including the hepatic blood clearance.
3.4. Metabolite proile after incubation of PTX-2 with rat hepatocytes
LC-MS analysis of 30 min-incubations with PTX-2 in primary rat hepatocytes revealed the presence of a major monohydroxylated peak (M1) eluting at 11.45 min, which showed [M þ NH4]þand [MþNa]þat m/z 892 and 897, respectively (Fig. 3). A second, minor mono-hydroxylated peak (M2), or more likely an epoxide, eluted at 15.75 min and thus later than PTX-2 at 14.13 min. It also produced [M þ NH4]þ
and [MþNa]þwith m/z 892 and 897, respectively. Moreover, a minor
dihydroxylated product (M3), eluting at 11.08 min, showed [M þ NH4]þ
and [MþNa]þat m/z 908 and 913, respectively.
3.5. LC/MS and LC/MSn analyses of the isolated metabolites
When combined 30-min incubations were fractionated and
subsequently subjected to preparative HPLC using a longer, 250 mm- column and a slower ACN–water gradient, the fraction containing the major monohydroxylated M1 peak was resolved into three partially overlapping peaks (Fig. 4). Analysis of MS2 spectra ([MþNa]þ)
sug-gested that the fraction of monohydroxylated M1 included contributions from different OH-PTX-2 species. The two signals with retention times 18.43 and 18.71 min (leading edge of the main peak) produced both a
m/z 555 fragment ion, and the minor signal at 19.06 min, possibly
consisting of isomeric compounds (tailing edge of the peak) produced a signiicant fragment ion with m/z 611.
3.6. Characterization of the potential hepatic PTX-2 metabolites
The [M þ NH4]þMS2 and MS3 spectra of the monohydroxylated
metabolites M1 and M2 showed sequential losses of water ( 18 Da) resulting in the fragment ions of m/z 857 → 839 → 821 → 803 → 785 → 767, and M3 with fragment ions of m/z 873 → 855 → 837 → 819 → 801, comparable to the distinct fragmentation pattern of PTX-2 (m/z 869 → 851 → 823 → 805 → 787 → 769) (Fig. 5). Moreover, we observed the combined loss of CO2 ( 44 Da) and a 298 Da-fragment (in total 342
Da) from the molecule ions, producing the typical fragment ions at m/z 549 (M1, M2) and m/z 533 (PTX-2), that again can lose water. Analo-gous typical fragments were found in the MS2 spectra of numerous other PTXs, including PTX-2 SA, 7-epi-PTX-2 SA, PTX-12a, PTX-12 b and PTX- 2 (Miles et al., 2004b; Gerssen et al., 2008). Their presence in the spectra of M1 and M2 demonstrates that the metabolites are not hydroxylated in the upper region of the PTX skeleton, but potentially in the vicinity of R1 (Fig. 1), in the lower right region of the molecule (Fig. 5).
In contrast, the characteristic loss of 342 Da was not observed in the MS2 and MS3 spectra of the minor monohydroxylated metabolite species observed at a higher retention time (Fig. 4) and the dihydroxy-lated M3 (Fig. 3). In MS ([MþNa]þ), both afforded m/z 611, whereas m/ z 555 was the typical fragment for the dominant monohydroxylated
metabolites. This difference could be attributable to the presence of an added hydroxyl group in the upper region of the PTX skeleton. It appears to be probable that the minor monohydroxylated metabolite showing m/
z 611 and dihydroxylated M3 are oxygenated at the same position in the
upper PTX region. It is also probable that the second site of oxygenation in M3 is in the same position in the lower portion of the PTX skeleton as for the dominant monohydroxylated products affording the m/z 555 ion in [MþNa]þand m/z 567 ion in [M þ NH
4]þMS and MS2 spectra.
The [M þ NH4]þMS spectra of the monohydroxylated M1 and M2
(Fig. 3) were distinctly different to those of known PTX derivatives with the same molecular weights including PTX-2 (Yasumoto et al., 1984; Miles et al., 2004b), PTX-11 (Suzuki et al., 2006), and PTX-13 (Miles et al., 2006a). Furthermore, the retention times of the potential PTX-2 biotransformation products M1, M2 and M3 were different from that of an authentic PTX-1 standard, although PTX-1 has the same molecular formula (Krock et al., 2008). It can thus be assumed that the possible metabolic hydroxylation sites in the PTX-2 molecule, which we roughly localized by LC-MSn analysis, do not correspond with the sites that are
known to be oxygenated during the biosynthesis of PTX-1, PTX-11, and PTX-13. Formal structure elucidation of the hepatic metabolites detec-ted in the present study awaits the availability and puriication of a quantity of each compounds that is suficient for detailed NMR analyses. Declaration of competing interest
The authors declare that they have no known competing inancial interests or personal relationships that could have appeared to inluence the work reported in this paper.
CRediT authorship contribution statement
Morten Sandvik: Conceptualization, Methodology, Data curation, Writing - original draft, Visualization, Investigation. Christopher O.
Fig. 5. Proposed fragmentations observed in positive MS/MS spectra of [M þ NH4]þ ions from PTX-2 and the PTX-2 metabolites M1, M2 and M3 with comparison of the fragmentation pathways.
Toxicon: X 6 (2020) 100031
6
Miles: Data curation, Writing - original draft, Writing - review & editing, Investigation. Alistair L. Wilkins: Visualization, Writing - review & editing. Christiane Fæste: Investigation, Writing - review & editing. Acknowledgments
The authors wish to thank Dr. Seyed A. Mousavi at the Institute of Biology of the University of Oslo for providing us with primary hepa-tocytes. We would also like to thank Prof. T. Yasumoto from the Japan Food Research Laboratories for kindly providing the standard of PTX-1. This study was supported by the MARBioFEED project (partly funded by the European Commission, through 8th Framework Programme Con-tract). This study was additionally funded by the Norwegian research Council grant no. 258677.
References
Alexander, J., Benford, D., Cockburn, A., Cravedi, J.-P., Dogliotti, E., Fern�andez- Cruz, M., Fink-Gremmels, J., Fürst, P., Galli, C., Grandjean, P., Gzyl, J., Heinemeyer, G., Johansson, N., Mutti, A., Schlatter, J., Leeuwen, R., Peteghem, C., Eskola, M., 2009. Marine biotoxins in shellish – pectenotoxin group. EFSA Scientiic Opinion. EFSA J 1109. https://doi.org/10.2903/j.efsa.2009.1109.
Alfonso, A., Tobío, A., Louzao, M.C., 2014. Yessotoxins and pectenotoxins. In: Botana, L. M. (Ed.), Seafood and Freshwater Toxins: Pharmacology, Physiology, and Detection. Taylor & Francis, Abingdon, UK, pp. 657–676. https://doi.org/10.1201/b16662-27. Blanchard, N., Hewitt, N.J., Silber, P., Jones, H., Coassolo, P., Lav�e, T., 2006. Prediction of hepatic clearance using cryopreserved human hepatocytes: a comparison of serum and serum-free incubations. J. Pharm. Pharmacol. 58, 633–641. https://doi.org/ 10.1211/jpp.58.5.0008.
Burgess, V., Shaw, G., 2001. Pectenotoxins-an issue for public health: a review of their comparative toxicology and metabolism. Environ. Int. 27, 275–283. https://doi.org/ 10.1016/S0160-4120(01)00058-7.
Daiguji, M., Satake, M., James, K.J., Bishop, A., MacKenzie, L., Naoki, H., Yasumoto, T., 1998. Structures of new pectenotoxin analogs, pectenotoxin-2 seco acid and 7-epi- pectenotoxin-2 seco acid, isolated from a dinolagellate and greenshell mussels. Chem. Lett. 27, 653–654. https://doi.org/10.1246/cl.1998.653.
De Buck, S.S., Sinha, V.K., Fenu, L.A., Nijsen, M.J., Mackie, C.E., Gilissen, R.A., 2007. Prediction of human pharmacokinetics using physiologically based modeling: a retrospective analysis of 26 clinically tested drugs. Drug Met. Disp. 35, 1766–1780.
https://doi.org/10.1124/dmd.107.015644.
Fæste, C.K., Moldes-Anaya, A., 2016. Biotransformation of the fungal neurotoxin Thomitrem A by primary rat hepatocytes. Toxicon 124, 36–43. https://doi.org/ 10.1016/j.toxicon.2016.11.003.
Fagerholm, U., 2007. Prediction of human pharmacokinetics — improving microsome- based predictions of hepatic metabolic clearance. J. Pharm. Pharmacol. 59, 1427–1431. https://doi.org/10.1211/jpp.59.10.0014.
Farabegoli, F., Blanco, L., Rodríguez, L.P., Vieites, J.M., Cabado, A.G., 2018. Phycotoxins in marine shellish: origin, occurrence and effects on humans. Mar. Drugs 16, 188.
https://doi.org/10.3390/md16060188.
Gebhardt, R., Hengstler, J.G., Müller, D., Gl€ockner, R., Buenning, P., Laube, B., Schmelzer, E., Ullrich, M., Utesch, D., Hewitt, N., Ringel, M., Reder Hilz, B., Bader, A., Langsch, A., Koose, T., Burger, H.-J., Maas, J., Oesch, F., 2003. New hepatocyte in vitro systems for drug metabolism: metabolic capacity and recommendations for application in basic research and drug development, standard operation procedures. Drug Met. Rev. 35, 145–213. https://doi.org/10.1081/DMR- 120023684.
Gerssen, A., Mulder, P., van Rhijn, H., de Boer, J., 2008. Mass spectrometric analysis of the marine lipophilic biotoxins pectenotoxin-2 and okadaic acid by four different types of mass spectrometers. J. Mass Spectrom. 43, 1140–1147. https://doi.org/ 10.1002/jms.1407.
Halim, R., Brimble, M.A., 2006. Synthetic studies towards the pectenotoxins: a review. Org. Biomol. Chem. 4, 4048–4058. https://doi.org/10.1039/b611531b. Hinder, S.L., Hays, G.C., Edwards, M., Roberts, E.C., Walne, A.W., Gravenor, M.B., 2012.
Changes in marine dinolagellate and diatom abundance under climate change. Nat. Clim. Change 2, 271–275. https://doi.org/10.1038/nclimate1388.
Houston, J.B., 1994. Utility of in vitro drug metabolism data in predicting in vivo metabolic clearance. Biochem. Pharmacol. 47, 1469–1479. https://doi.org/ 10.1016/0006-2952(94)90520-7.
Houston, J.B., Galetin, A., 2008. Methods for predicting in vivo pharmacokinetics using data from in vitro assays. Curr. Drug Metabol. 9, 940–951. https://doi.org/10.2174/ 138920008786485164.
Ito, K., Iwatsubo, T., Kanamitsu, S., Ueda, K., Suzuki, H., Sugiyama, Y., 1998. Prediction of pharmacokinetic alterations caused by drug-drug interactions: metabolic interaction in the liver. Pharmacol. Rev. 50, 387–412 doi:0031-6997/98/5003-0387 $03.00/0.
Iwatsubo, T., Hirota, N., Ooie, T., Suzuki, H., Shimada, N., Chiba, K., Ishizaki, T., Green, C.E., Tyson, C.A., Sugiyama, Y., 1997. Prediction of in vivo drug metabolism in the human liver from in vitro metabolism data. Pharmacol. Therapeut. 73, 147–171. https://doi.org/10.1016/S0163-7258(96)00184-2.
Krock, B., Tillmann, U., John, U., Cembella, A., 2008. LC-MS-MS aboard ship: tandem mass spectrometry in the search for phycotoxins and novel toxigenic plankton from
the North Sea. Anal. Bioanal. Chem. 392, 797–803. https://doi.org/10.1007/ s00216-008-2221-7.
Lee, J.S., Igarashi, T., Fraga, S., Dahl, E., Hovgaard, P., Yasumoto, T., 1989. Determination of diarrhetic shellish toxins in various dinolagellate species. J. Appl. Phycol. 1, 147–152. https://doi.org/10.1007/BF00003877.
Lin, J.H., Lu, A.Y.H., 1998. Inhibition and induction of cytochrome P450 and the clinical implications. Clin. Pharmacokinet. 35, 361–390. https://doi.org/10.2165/ 00003088-199835050-00003.
MacKenzie, L., Beuzenberg, V., Holland, P., McNabb, P., Suzuki, T., Selwood, A., 2005. Pectenotoxin and okadaic acid-based toxin proiles in Dinophysis acuta and Dinophysis acuminata from New Zealand. Harmful Algae 4, 75–85. https://doi.org/ 10.1016/j.hal.2003.12.001.
Masimirembwa, C.M., Bredberg, U., Andersson, T.B., 2003. Metabolic stability for drug discovery and development. Clin. Pharmacokinet. 42, 515–528. https://doi.org/ 10.2165/00003088-200342060-00002.
Miles, C.O., Wilkins, A.L., Munday, R., Dines, M.H., Hawkes, A.D., Briggs, L.R., Sandvik, M., Jensen, D.J., Cooney, J.M., Hollande, P.T., Quilliam, M.A., MacKenziee, A.L., Beuzenberg, V., Towers, N.R., 2004a. Isolation of pectenotoxin-2 from Dinophysis acuta and its conversion to pectenotoxin-2 seco acid, and preliminary assessment of their acute toxicities. Toxicon 43, 1–9. https://doi.org/ 10.1016/j.toxicon.2003.10.003.
Miles, C.O., Wilkins, A.L., Samdal, I.A., Sandvik, M., Petersen, D., Quilliam, M.A., Naustvoll, L.J., Rundberget, T., Torgersen, T., Hovgaard, P., Jensen, D.J., Cooney, J. M., 2004b. A novel pectenotoxin, PTX-12, in Dinophysis spp. and shellish from Norway. Chem. Res. Toxicol. 17, 1423–1433. https://doi.org/10.1021/tx049870a. Miles, C.O., Wilkins, A.L., Hawkes, A.D., Jensen, D.J., Selwood, A.I., Beuzenberg, V.,
MacKenzie, A.L., Cooney, J.M., Holland, P.T., 2006a. Isolation and identiication of pectenotoxins-13 and-14 from Dinophysis acuta in New Zealand. Toxicon 48, 152–159. https://doi.org/10.1016/j.toxicon.2006.04.005.
Miles, C.O., Wilkins, A.L., Munday, J.S., Munday, R., Hawkes, A.D., Jensen, D.J., Cooney, J.M., Beuzenberg, V., 2006b. Production of 7-epi-pectenotoxin-2 seco acid and assessment of its acute toxicity to mice. J. Agric. Food Chem. 54, 1530–1534.
https://doi.org/10.1021/jf0523871.
Nagilla, R., Frank, K.A., Jolivette, L.J., Ward, K.W., 2006. Investigation of the utility of published in vitro intrinsic clearance data for prediction of in vivo clearance. J. Pharmacol. Toxicol. Methods 53, 106–116. https://doi.org/10.1016/j. vascn.2005.08.005.
Obach, R.S., 1996. The importance of nonspeciic binding in in vitro matrices, its impact on enzyme kinetic studies of drug metabolism reactions, and implications for in vitro-
in vivo correlations. Drug Met. Disp. 24, 1047–1049.
Obach, R.S., 1999. Prediction of human clearance of twenty-nine drugs from hepatic microsomal intrinsic clearance data: an examination of in vitro half-life approach and nonspeciic binding to microsomes. Drug Met. Disp. 27, 1350–1359 doi:0090-9556/ 99/2711-1350–1359$02.00/0.
Sasaki, K., Wright, K.L.C., Yasumoto, T., 1998. Identiication and characterization of pectenotoxin (PTX) 4 and PTX7 as spiroketal stereoisomers of two previously reported pectenotoxins. J. Org. Chem. 63, 2475–2480. https://doi.org/10.1007/ 7081_020.
Seglen, P.O., 1976. Preparation of isolated rat liver cells. Methods Cell Biol. 13, 29–83.
https://doi.org/10.1016/S0091-679X(08)61797-5.
Sidelmann, U.G., Cornett, C., Tjørnelund, J., Hansen, S.H., 1996. A comparative study of precision cut liver slices, hepatocytes, and liver microsomes from the Wistar rat using metronidazole as a model substance. Xenobiotica 26, 709–722. https://doi. org/10.3109/00498259609046744.
Smith, R., Jones, R.D.O., Ballard, P.G., Grifiths, H.H., 2008. Determination of microsome and hepatocyte scaling factors for in vitro/in vivo extrapolation in the rat and dog. Xenobiotica 38, 1386–1398. https://doi.org/10.1080/00498250802491662. Soars, M.G., Burchell, B., Riley, R.J., 2002. In vitro analysis of human drug
glucuronidation and prediction of in vivo metabolic clearance. J. Pharmacol. Exp. Therapeut. 301, 382–390. https://doi.org/10.1124/jpet.301.1.382.
Suzuki, T., Mitsuya, T., Matsubara, H., Yamasaki, M., 1998. Determination of pectenotoxin-2 after solid-phase extraction from seawater and from the dinolagellate Dinophysis fortii by liquid chromatography with electrospray mass spectrometry and ultraviolet detection - evidence of oxidation of pectenotoxin-2 to pectenotoxin-6 in scallops. J. Chromatogr. A 815, 155–160. https://doi.org/ 10.1016/S0021-9673(98)00010-7.
Suzuki, T., Mackenzie, L., Stirling, D., Adamson, J., 2001a. Pectenotoxin-2 seco acid: a toxin converted from pectenotoxin-2 by the New Zealand Greenshell mussel, Perna canaliculus. Toxicon 39, 507–514. https://doi.org/10.1016/S0041-0101(00)00153- 7.
Suzuki, T., Mackenzie, L., Stirling, D., Adamson, J., 2001b. Conversion of pectenotoxin2 to pectenotoxin2 seco acid in the New Zealand scallop, Pecten novaezelandiae. Fisheries Sci 67, 506–510. https://doi.org/10.1046/j.1444-2906.2001.00265.x. Suzuki, T., Beuzenberg, V., Mackenzie, L., Quilliam, M.A., 2003. Liquid
chromatography–mass spectrometry of spiroketal stereoisomers of pectenotoxins and the analysis of novel pectenotoxin isomers in the toxic dinolagellate Dinophysis acuta from New Zealand. J. Chromatogr. A 992, 141–150. https://doi.org/10.1016/ S0021-9673(03)00324-8.
Suzuki, T., Jin, T., Shirota, Y., Mitsuya, T., Okumura, Y., Kamiyama, T., 2005. Quantiication of lipophilic toxins associated with diarrhetic shellish poisoning in Japanese bivalves by liquid chromatography-mass spectrometry and comparison with mouse bioassay. Fish. Sci. 71, 1370. https://doi.org/10.1111/j.1444- 2906.2005.01104.x.
Suzuki, T., Walter, J.A., LeBlanc, P., MacKinnon, S., Miles, C.O., Wilkins, A.L., Munday, R., Beuzenberg, V., MacKenzie, A.L., Jensen, D.J., Cooney, J.M., Quilliam, M.A., 2006. Identiication of pectenotoxin-11 as 34 S- M. Sandvik et al.
hydroxypectenotoxin-2, a new pectenotoxin analogue in the toxic dinolagellate Dinophysis acuta from New Zealand. Chem. Res. Toxicol. 19, 310–318. https://doi. org/10.1021/tx050240y.
Yasumoto, T., Murata, M., Oshima, Y., Sano, M., Matsumoto, G.K., Clardy, J., 1985. Diarrhetic shellish toxins. Tetrahedron 41, 1019–1025. https://doi.org/10.1016/ S0040-4020(01)96469-5.
Yasumoto, T., Murata, M., Oshima, Y., Matsumoto, G.K., Clardy, J., 1984. Diarrhetic shellish poisoning. In: Ragelis, E.P. (Ed.), Seafood Toxins, vol. 269. ACS Publications, pp. 207–214. https://doi.org/10.1021/bk-1984-0262.ch019.
Yasumoto, T., 1989. Polyether toxins produced by dinolagellates. In: Natori, S., Hashimoto, K., Ueno, Y. (Eds.), Mycotoxins and Phycotoxins ’88. Papers Presented at the 7th International IUPAC Symposium on Mycotoxins and Phycotoxins in Tokyo. Elsevier, Amsterdam, Netherlands, pp. 375–382.
![Fig. 4. LC-MS 2 chromatogram of monohydroxylated M1 indicating the presence of three isomeric OH-PTX-2 species with [M þ Na] þ ions at m/z 897 (left panel)](https://thumb-eu.123doks.com/thumbv2/123doknet/13994453.455237/5.892.149.747.365.711/fig-chromatogram-monohydroxylated-indicating-presence-isomeric-species-panel.webp)
![Fig. 5. Proposed fragmentations observed in positive MS/MS spectra of [M þ NH 4 ] þ ions from PTX-2 and the PTX-2 metabolites M1, M2 and M3 with comparison of the fragmentation pathways](https://thumb-eu.123doks.com/thumbv2/123doknet/13994453.455237/6.892.66.432.83.666/proposed-fragmentations-observed-positive-metabolites-comparison-fragmentation-pathways.webp)
