Publisher’s version / Version de l'éditeur: Student Report, 2008-12
READ THESE TERMS AND CONDITIONS CAREFULLY BEFORE USING THIS WEBSITE. https://nrc-publications.canada.ca/eng/copyright
Vous avez des questions? Nous pouvons vous aider. Pour communiquer directement avec un auteur, consultez la
première page de la revue dans laquelle son article a été publié afin de trouver ses coordonnées. Si vous n’arrivez pas à les repérer, communiquez avec nous à [email protected].
Questions? Contact the NRC Publications Archive team at
[email protected]. If you wish to email the authors directly, please see the first page of the publication for their contact information.
NRC Publications Archive
Archives des publications du CNRC
For the publisher’s version, please access the DOI link below./ Pour consulter la version de l’éditeur, utilisez le lien DOI ci-dessous.
https://doi.org/10.4224/19379148
Access and use of this website and the material on it are subject to the Terms and Conditions set forth at
Ice islands: their presence in the North Atlantic Ocean Armstrong, Tessa
https://publications-cnrc.canada.ca/fra/droits
L’accès à ce site Web et l’utilisation de son contenu sont assujettis aux conditions présentées dans le site LISEZ CES CONDITIONS ATTENTIVEMENT AVANT D’UTILISER CE SITE WEB.
NRC Publications Record / Notice d'Archives des publications de CNRC:
https://nrc-publications.canada.ca/eng/view/object/?id=298ae285-2c5e-4673-b22a-bada4092ab18 https://publications-cnrc.canada.ca/fra/voir/objet/?id=298ae285-2c5e-4673-b22a-bada4092ab18
National Research Council Canada Institute for Ocean Technology Conseil national de recherches Canada Institut des technologies oc ´eaniques
SR-2008-28
Student Report
ICE ISLANDS: THEIR PRESENCE IN THE NORTH
ATLANTIC OCEAN
Tessa Armstrong
December 2008
DOCUMENTATION PAGE
REPORT NUMBER SR-2008-28
NRC REPORT NUMBER DATE
December 2008 REPORT SECURITY CLASSIFICATION
Unclassified
DISTRIBUTION Unlimited TITLE
ICE ISLANDS: THEIR PRESENCE IN THE NORTH ATLANTIC OCEAN AUTHOR(S)
Tessa Armstrong
CORPORATE AUTHOR(S)/PERFORMING AGENCY(S)
Institute For Ocean Technology- National Research Council of Canada PUBLICATION
SPONSORING AGENCY(S)
Institute For Ocean Technology- National Research Council of Canada
IOT PROJECT NUMBER NRC FILE NUMBER
KEY WORDS
Iceberg, Ice island, IIP
PAGES v, 15, App A-B FIGS. 10 TABLES SUMMARY
Ice islands are extremely large icebergs that break off the ice shelves of Ellesmere Island and the glaciers of Greenland. A percentage of the ice islands will make their way south via the Nares Strait and drift with the Labrador current off the coast of Newfoundland and Labrador.
The content of this paper spans over a century of ice island sightings; beginning in the 1880s up until 2004. Data has been collected from numerous sources, including the historical Iceberg Sighting Database by Brian Hill, as well as PERD Iceberg Database. A total of 340 ice islands were reported within that data thus far compiled. These reports have been organized into an excel spreadsheet, consisting of detailed information for each ice island such as position, size and date.
The ice island data has been plotted in a series of graphs, displaying different trends related to the position and size of ice islands. These graphs contribute to final analysis of the data as displayed by the graphs and figures.
ADDRESS National Research Council Institute for Ocean Technology Arctic Avenue, P. O. Box 12093 St. John's, NL A1B 3T5
National Research Council Conseil national de recherches Canada Canada
Institute for Ocean Institut des technologies
Technology océaniques
ICE ISLANDS: THEIR PRESENCE IN THE NORTH ATLANTIC OCEAN
SR-2007-28
Tessa Armstrong
SUMMARY
Ice islands are extremely large icebergs that break off the ice shelves of
Ellesmere Island and the glaciers of Greenland. A percentage of the ice islands
will make their way south via the Nares Strait and drift with the Labrador current
off the coast of Newfoundland and Labrador.
The content of this paper spans over a century of ice island sightings; beginning
in the 1880s up until 2004. Data has been collected from numerous sources,
including the historical Iceberg Sighting Database by Brian Hill, as well as PERD
Iceberg Database. A total of 340 ice islands were reported within that data thus
far compiled. These reports have been organized into an excel spreadsheet,
consisting of detailed information for each ice island such as position, size and
date.
The ice island data has been plotted in a series of graphs, displaying different
trends related to the position and size of ice islands. These graphs contribute to
1.0 INTRODUCTION
1.1 Ice islands
The International Ice Patrol defines an ice island as any iceberg measuring 300 meters
or greater in length. They are “usually characterized by a regularly undulating surface
giving a ribbed appearance from the air,” 1 and many have melt pools across their
surface. Ice islands have been reported in a variety of shapes, including pinnacles,
wedges and domes. Many islands are tabular, or flat, as seen in Figure 1. Ice floes
have a similar appearance and may be mistakenly identified as an ice island. To
eliminate this problem it is generally said that an ice island must have a height equal to
or greater than five meters.
Figure 1: A tabular ice island
1.2 Their origin
This paper is a study of the presence of ice islands in the North Atlantic Ocean, focusing
reported off the coast of Newfoundland and Labrador originate from the ice shelves off
the northern coast of Ellesmere Island in Northern Canada as well as the glaciers of
Greenland, most commonly the Petermann and Ryder glaciers. “Many variables control
the movement of the ice islands including wind, water currents, time of year, and the
location of the pack ice.” 1 These large icebergs may drift around the Arctic Ocean for
many years before reaching the North Atlantic via the Nares Strait, shown in Figure 2.
Once through the Strait the ice islands drift with the Labrador Current down the coast.
There are reported occurrences of ice islands off the east coast of Greenland. This
sighting is displayed in Appendix B using Google Maps. In this case the ice island may
have broken off a glacier on the east coast of Greenland. The possibility exists that
more ice islands have broken off east coast glaciers and followed the east Greenland
Current and west Greenland Current before hitting the Labrador Current.
Ice Shelves
Glaciers
Figure 2: The Labrador Current Figure 3: Ice shelves of Ellesmere Island, Ryder and
1.3 Importance of data
Ice islands have made headlines in recent years due to the accelerated deterioration of
ice shelves as the result of a warming trend in the Arctic. Issues may arise if these
extremely large ice islands break into smaller islands, allowing them to travel through
the Strait into navigable waters where ships and/or oil platforms may be in their path.
An example of the creation of an ice island is illustrated in Figure 4. In the summer of
2001 an extremely large ice island began to break away from the Petermann glacier on
the northern coast of Greenland. This figure displays the ice island in August of 2001,
after it had broken off the glacier and began to drift.
Figure 4: Ice island breaking off the Petermann glacier in August 2001. Photo courtesy of NASA
The ice shelves off the northern coast of Ellesmere Island are also a concern. “During
the early part of the 20th century, a large continuous ice sheet extended along 450km of
major ice shelves, totalling one tenth of the extent of the original shelf, remained along
the north coast of Ellesmere Island.” 2 “As of the summer of 2008, these ice shelves are
undergoing almost daily changes, with some ice shelves collapsing completely and
others calving large ice islands and accompanying ice fragments.” 1
These occurrences and the concern for how they may affect trans-Atlantic shipping and
recent offshore oil and gas activities off Newfoundland have resulted in a need for data
analysis related to ice islands and their presence in the North Atlantic Ocean.
2.0 DATA
Previous ice island studies that have been conducted did not have access to the wide
range of data currently available. One paper to note is John P. Newell’s Exceptionally
Large Icebergs and Ice Islands in Eastern Canadian Waters: A Review of Sightings
from 1900 to Present. His paper relied on sightings by the International Ice Patrol,
which account for a very small percentage of ice island reports in the late part of the 19th
century, and early 20th century. The data available today has been collected from a
wide range of sources and compiled into the following databases.
2.1 Iceberg Sighting Database
The Iceberg sighting database, created by Mr. Brian Hill of the Institute of Ocean
Technology, is a historical log of iceberg sightings off the coast of Newfoundland and
Labrador prior to 1960. Iceberg sightings are entered according to year into an Excel
spreadsheet where the date, location, size and any additional comments are recorded
limited to the Hydrographic Bulletin (HB), the New York Maritime Register (NYMR) and
the International Ice Patrol (IIP). The HB, of which transcribing data is still in progress,
has only recently been added to the database as a source, and has provided thousands
of new entries in the late 1800s and early 1900s. These data provide a significant
amount of information which to base observations of early century iceberg sightings.
The International Ice Patrol (IIP) was established in 1912 as a result of the Titanic
disaster and began regular patrols of the Trans-Atlantic shipping lanes in 1914. Up to
that point ships relied solely on others to report any iceberg sightings as they crossed
the Atlantic to their destination. It was not until the late 1920’s that the IIP overtook
papers such as the HB and NYMR as the main source for iceberg sightings.
2.2 PERD Database
The Program on Energy and Research Development (PERD) Iceberg Sightings
Database, compiled by BMT Fleet Technology, is a collection of iceberg sightings off
the coast of Newfoundland and Labrador beginning in the late eighteen hundreds to the
present day. In collaboration with Brian Hill’s historical Iceberg Sighting Database and
the International Ice Patrol they have created a comprehensive source to assist with the
research of iceberg activity over the past century. The database was created to help
identify possible problems that may interfere with current offshore activities.
The PERD Database has a similar format to the Iceberg Sighting Database, providing
iceberg location, size etc. PERD uses Microsoft Access to store, search and display the
2.3 Accuracy of Data
The content of this paper spans over a century of ice island sightings; beginning in the
1880s up until 2004. Prior to the introduction of aircraft patrols in the 1930s followed by
radar in later years, ship reports were the main source for iceberg sightings. The
accuracy of the visual sightings was highly dependent on weather, sea conditions and
the time of day that the ship passed the iceberg. All of these factors must be kept in
mind when considering the accuracy of the iceberg positions recorded, as well as their
dimensions and shape.
The reports at the early part of the century did not have the consistency that the
International Ice Patrol provided with regular patrols. Very rarely did reports reveal the
path that the iceberg was taking, and when a ship came across an iceberg they had no
way of knowing whether it had already been identified by another ship at a different
location. This makes it very difficult to discern whether or not an ice island has been
reported more than once, commonly known as a resight, and thus counted more than
once in the total number of sightings. Some resights are easily identified; icebergs may
have been reported as having a similar size and location at around the same date.
These sightings are counted as one report. As technology progresses, and we are
capable of following icebergs via radar, this problem becomes one of the past, as this
paper spans over a century of sightings, it must be taken into consideration when
3.0 DATA ANALYSIS
3.1 Occurrence of ice islands
As stated, this paper spans 120 years of ice island sightings. During this period of time
there were 340 reports of ice islands in the data that has been thus far compiled. These
reports have been organized into one spreadsheet (Appendix A), consisting of detailed
information for each ice island such as position, size, date, sighting source and any
additional comments. Any reports that are known resights of an ice island are not
included in this final count. If a sighting was reported as “a number of ice islands,” and
the actual count is unknown, it was recorded as one island for the purpose of this paper.
A visual representation of the data compiled in Appendix A is displayed in Appendix B
using Google Earth. Each purple icon is a representation of a reported ice island. One
icon may represent more than one report at that location. This illustration gives a
general idea of where we may expect to find ice islands.
3.2 Sea ice extent
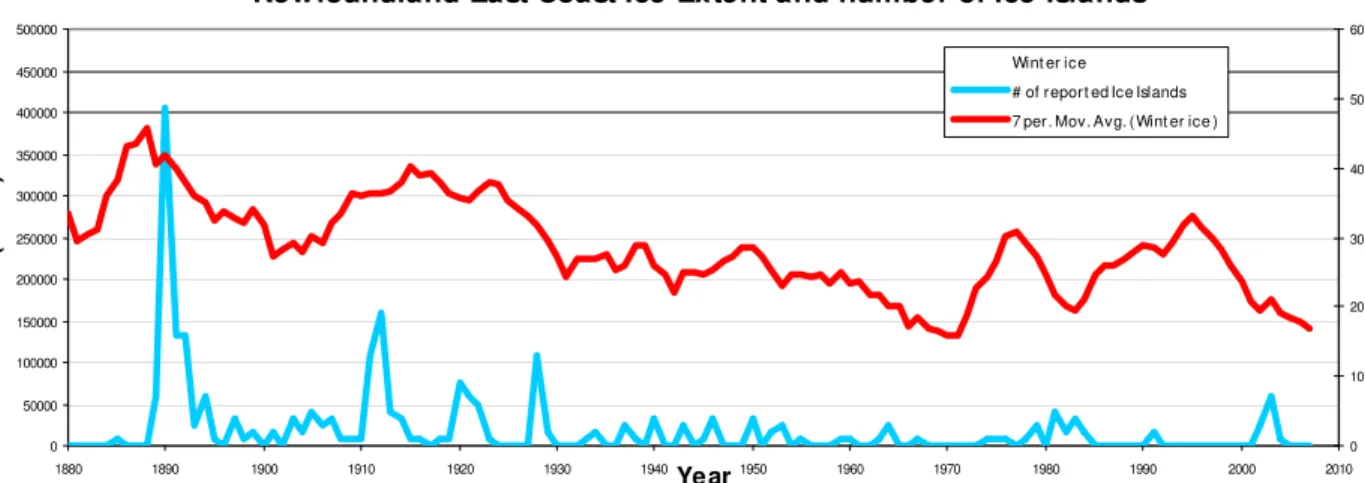
Newfoundland East Coast Ice Extent and number of Ice Islands
0 50000 100000 150000 200000 250000 300000 350000 400000 450000 500000 1880 1890 1900 1910 1920 1930 1940 1950 1960 1970 1980 1990 2000 2010 Year A rea (km ^ 2) 0 10 20 30 40 50 60 Wint er ice
# of report ed Ice Islands 7 per . Mov. Avg. ( Wint er ice )
Figure 5: Sea Ice extent plotted with number of ice island reports for each year. Graph courtesy of Brian
In Figure 5 the area of the sea ice extent off the coast of Newfoundland and Labrador is
plotted for each year, beginning in 1880 11. On the same graph the total number of ice
islands reported has been summed for each year beginning in 1885 and displayed in
blue. Zero reports in a year may signify that there were no ice islands reported in that
year but it may also be the result of incomplete data; ongoing data entry may have a
significant affect on displayed results.
Upon analysis of the two plots it can be seen that both follow a similar downward trend
over the past century. In regard to the sea ice extent this indicates that the overall area
has decreased in the past 120 years, evidence of a warming trend. This warmer
environment may be the cause for the downward trend in the number of ice island
reports. Higher water and air temperatures result in the ice islands breaking up and/or
melting into much smaller icebergs before they reach more southerly latitudes.
Another relationship that can be discerned between the two plots is that the majority of
years that contain a large number of ice islands reports, 1890 and 1928 are two
examples, occurred during a warming period as indicated by a downward slope in the
sea ice extent. This may be due to the fact that previous to these years of warming the
ice islands may have been caught in sea ice up North, which prevented them from
drifting further south. It may also indicate that during these warming trends there were a
greater number of islands breaking off of the ice shelves in the Arctic, resulting in more
reports as they travelled farther south.
Sea ice can have a notable affect on the size of an ice island as well as how far south it
maintain its large size for a longer period of time before breaking up. It can be surmised
that a greater area of sea ice of the coast of Newfoundland and Labrador will allow
larger ice islands to drift to more southerly latitudes. This was established by Marko et al
(1994) in Iceberg Severity off Eastern North America: Its Relationship to Sea Ice
Variability and Climate Change.10
3.3 Further analysis
The following graphs were plotted using information found in each ice island report.
Each plot displays different trends related to ice islands and contribute to final
conclusions found through analysis of the data as displayed by the graphs and figures.
Latitude vs. Length of reported Ice island
0 2,000 4,000 6,000 8,000 10,000 12,000 14,000 16,000 18,000 20,000 35 40 45 50 55 60 65 70 75 80 85 Latitude (degrees) Length (m)
Figure 6: Ice island sightings plotted in Latitude vs. reported Length
Figure 6 displays the latitude of each reported ice island versus its length. The
apparent trend is that the lengths of the ice islands, thus their overall size, tend to
there is less sea ice to protect the islands as the travel father south, warmer waters and
climate at lower latitudes, and the simple fact that the farther south they reach the
longer they have been drifting, giving them more time to deteriorate.
This plot also displays that the largest ice island ever recorded within the data scope of
this paper was just over twenty kilometres long, reported at latitude 81 in July of 1963.
Reports in more northerly latitudes were not possible prior to the introduction of airplane
patrols and radar technology.
Anomalies to the apparent trend are indicated in the top left corner of the plot. These
three extremely large ice islands, all reported well below latitude 50, were recorded as
having a length greater than nineteen kilometres. These three islands occurred in 1891,
1899 and 1901 respectively. Upon analysis of the length of ice islands versus the year
that they were reported, as seen in Figure 7, it can be seen that extremely large ice
islands were more common in the late 19th century, early 20th century.
Length of Ice Islands by Year
0 2,000 4,000 6,000 8,000 10,000 12,000 14,000 16,000 18,000 20,000 1880 1890 1900 1910 1920 1930 1940 1950 1960 1970 1980 1990 2000 Year Length (m)
As stated, technology is allowing ice patrols to go farther north. With this said it could
be generally assumed that since patrols had the capability to travel farther north with the
introduction of new technologies the average size of ice islands reported would have
increased. Upon analysis of the data displayed in Figure 7, the trend indicates the
opposite. With few exceptions, the size of the ice islands reported is generally smaller;
a downward trend in the length of the ice islands beginning in the 1880’s up until 2004 is
displayed. This trend reinforces previous analysis, a smaller area of sea ice of the
coast of Newfoundland results in smaller ice islands. Another cause for the smaller
islands may be that as the Arctic ice shelves break up the reservoir is reduced, resulting
in smaller islands.
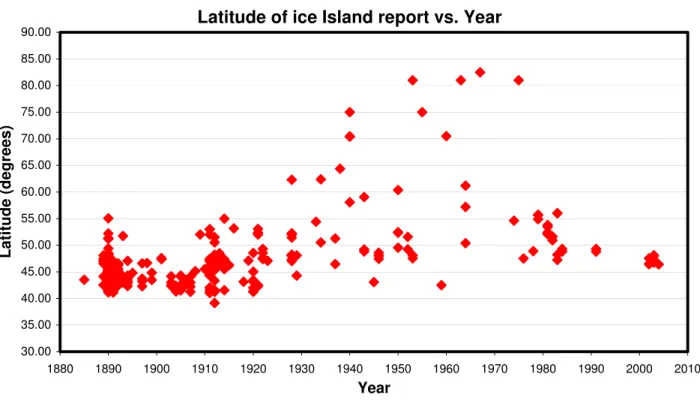
Latitude of ice Island report vs. Year
30.00 35.00 40.00 45.00 50.00 55.00 60.00 65.00 70.00 75.00 80.00 85.00 90.00 1880 1890 1900 1910 1920 1930 1940 1950 1960 1970 1980 1990 2000 2010 Year Latitude (degrees)
Examining the data points, over the last 100 years there have only been two ice islands
within our data scope reported that came near three kilometres below latitude 51.
Previous to that there were numerous ice islands reportedly longer than three
kilometres as shown in Figure 7. In a graph of the reported latitude versus year, as
shown in Figure 8, it can be seen that the majority of reports in the late 1800’s, early
1900’s were below latitude 51. This again reinforces that larger ice islands were coming
much farther south.
Figure 8 also provides a visual representation of when the International Ice Patrol
started patrolling farther North in the 1930’s with the introduction of airplanes, and in
later years radar, as indicated by the more northerly data points.
3.4 Offshore Oil and Gas activity
When exploration of the oilfields off the coast of Newfoundland began, studies were
conducted to assess the danger that icebergs may pose to the potential offshore
activities. None of the studies that were conducted had access to the large scope of
data currently available. Records of historical sightings were sparse and unknown to
exist, and data was not as widely available as it is today. In Figure 9 the yellow marker
represents the location of the oil fields, and is shown in relation to the reported ice
island sightings using Google Earth. As has been discussed, many of these reports
occurred over a century ago, but this illustrates that there is a precedence of ice islands
in the area. Ice islands that were reported in the vicinity of the oilfields in 2002, 2003
illustrated in Figure 10. It can be very difficult or even impossible to alter the path of an
ice island, as well as smaller bergs. These figures indicate that it is very possible that
the offshore drilling platforms may be in the path of ice islands, posing a threat to their
drilling activities as well as their workers.
Oil fields
Figure 10: Drift patterns of ice islands
Figure 9: Location of oilfields and ice island reports
As has been indicated throughout the paper, ice islands reaching the southerly latitudes
of the oilfields have decreased in size as time progresses. While these smaller ice
islands may have the potential to cause less damage if they should hit something it also
makes it more likely that they will be able to reach oilfields. As the length of the ice
islands decrease so does the draft, or the depth of the berg below the water line. As a
rule of thumb the ratio is 1:5. So as the size of the ice islands decreases it is more likely
that they will be able to drift over the Grand Banks, as opposed to around, without
4.0 CONCLUSIONS
The data presented within this paper displays a warming trend of the North Atlantic
Ocean. Both the number of ice islands reported and the area of the sea ice extent off
the coast of Newfoundland and Labrador have decreased over the past century. This
could indicate a warmer environment, where sea ice is not allowed to form as it has in
past years resulting in little protection for ice islands against wave erosion and other
detrimental weather effects that result is smaller ice islands that break up before
reaching southerly latitudes. A warmer environment would also have an affect of the
melting rates of the ice islands reaching the North Atlantic.
Large ice shelves and glaciers in the Arctic are breaking up at accelerated rates, but
there are fewer ice islands reported in recent years as compared to the late 19th early
20th centuries. Those that do reach the North Atlantic are smaller in size; this may be
the result of a depleted reservoir as the ice breaks up as well as the warmer
temperatures.
A greater scope of data, as compared to the data available for previous papers, has
provided a better insight into whether or not the ice islands that drift down the coast of
Newfoundland and Labrador pose a potential threat to offshore activities. It was shown
that there is a precedence for ice islands in the area of the oil fields over the past
century, and as recently as 2004. These large icebergs could cause significant damage
to drilling platforms and endanger the lives of their workers if a collision should happen.
complete picture into the analysis of ice island drift patterns, as well as how the number
of reports and the sizes being reported relates to a global warming trend.


![[PDF] Installation de Windows 2003 Serveur | Cours windows serveur](data:image/gif;base64,R0lGODlhAQABAIAAAP///wAAACH5BAEAAAAALAAAAAABAAEAAAICRAEAOw==)