Alterations in Cardiovascular Regulation and Function Assessed Using Cardiovascular System Identification
by
Ming-Hokng Maa
Submitted to the Department of Electrical Engineering and Computer Science in Partial Fulfillment of the Requirements for the Degrees of
Bachelor of Science in Electrical [Computer] Science and Engineering and Master of Engineering in Electrical Engineering and Computer Science
at the Massachusetts Institute of Technology May 10, 2000
Copyright 2000 Ming-Hokng Maa. All rights reserved.
The author hereby grants to M.I.T. permission to reproduce and distribute publicly paper and electronic copies of this thesis
and to grant others the right to do so.
Author
Department of Eldctrical Engineering and Computer Science
May 10, 2000
Certified by
Fchard J. Cohen Thesis Supervisor Accepted by .-Arthur6 SithChairman, Department Committee on Graduate Theses
MG
MASSACHUSETTS INSTITUTE
Alterations in Cardiovascular Regulation and Function Assessed using Cardiovascular System Identification
By
Ming-Hokng Maa
Submitted to the Department of Electrical Engineering and Computer Science on June 15, 2000 in Partial Fulfillment of the Requirements for the Degrees of Bachelor of Science in Electrical [Computer] Science and Engineering and Master of Engineering in Electrical Engineering and
Computer Science
ABSTRACT
Cardiovascular System Identification (CSI), a novel technique for the noninvasive and quantitative characterization of short-term cardiovascular regulation, was applied to determine the
effects of simulated microgravity environments on cardiovascular deconditioning in general and orthostatic intolerance in particular. Preliminary results indicate that simulated micro-gravity environments significantly alter the autonomic mediation of short-term cardiovascular reflexes,
including the heart-rate baroreflex. Furthermore, CSI was applied to determine the effects of visual pathway stimulation on short-term autonomic regulation. The results indicate that visually induced virtual tilt does elicit changes in short-term cardiovascular regulation, correlating
positively with individual measures of tilt perception. Finally, to provide a reference point with
existing cardiovascular analysis, three quantitative models were created to estimate the Smyth heart-rate baroreflex sensitivity coefficient from CSI analysis. Using these models, we were able
to non-invasively estimate heart-rate baroreflex sensitivity without the use of pharmaceuticals.
Thesis Supervisor: Richard J. Cohen
Acknowledgments
I wish to thank my academic advisor, Professor Martha Gray, for her flexibility and encouragement of my academic and nonacademic pursuits. I also wish to thank my research advisor Professor Richard Cohen for giving me the opportunity to work in his laboratory, thereby introducing me to the world of engineered physiology. I also wish to thank Professor Cohen for his flexibility and his patience for my work. Furthermore, I wish to thank all of Professor Cohen's Lab team, past and present, especially Ramakrishna Mukkamala, Craig Ramsdell, Antonis Armoundas, Derin Sherman, Tom Mullen, Karin Toska, Grete Sundby, and Jacquelyn
Baskin for their immense help, without which this thesis would have been neither remotely
possible nor thinkable.
Thanks also to Kaitlyn Liao for keeping me sane.
Last but most importantly, however, I wish to thank my family: my mother, father, and brother, for their unwavering confidence, support, understanding, and love, which molded me into my present persona and allowed me to pursue my studies at MIT, often at their personal
sacrifice. For this, there can be no words of gratitude.
The work reported here was made possible through funding by the Massachusetts Institute of Technology and the National Space Biomedical Research Institute.
Contents
1
Preface ...
8
2
Cardiovascular System Identification (CSI) ...
10
2.1
Introduction ...
10
2.2
Analysis Tools...
16
3
Alterations in Cardiovascular Regulation During Simulated Space Flight... 18
3.1
Introduction and M otivation...
18
3.2
Short-Term Bedrest Study...20
3.2.1
Experim ental Protocol...
20
3.2.2
CSI Results...
22
3.2.3
Discussion ...
27
3.3
Long-Term Bone Demineralization/Calcium Metabolism Study ...
28
3.3.1
Experim ental Protocol...
28
3.3.2
CSI Results...
29
4
CSI Calculation of Sm yth's Baroreflex Sensitivity ...
35
4.1
Introduction to Heart Rate Baroreflex Sensitivity...
35
4.2
Experim ental Protocol...
38
4.3
Calculating Sm yth's Baroreflex Sensitivity...
38
4.4
CSI Results...
41
4.5
Calculating Heart-Rate Baroreflex Sensitivity from CSI...
43
4.5.1
M ethod 1 ...
43
4.5.2
M ethod 2 ...
48
4.5.3
M ethod 3 ...
50
4.6
Discussion ...
54
5
Visual-Autonomic Influence on Short-term Cardiovascular Regulation...55
5.1
Introduction and M otivation...
55
5.2
Experim ental Protocol...
56
5.3
CSI Results and Discussion...
58
6
Sum m ary and Future W ork ...
63
List of Figures
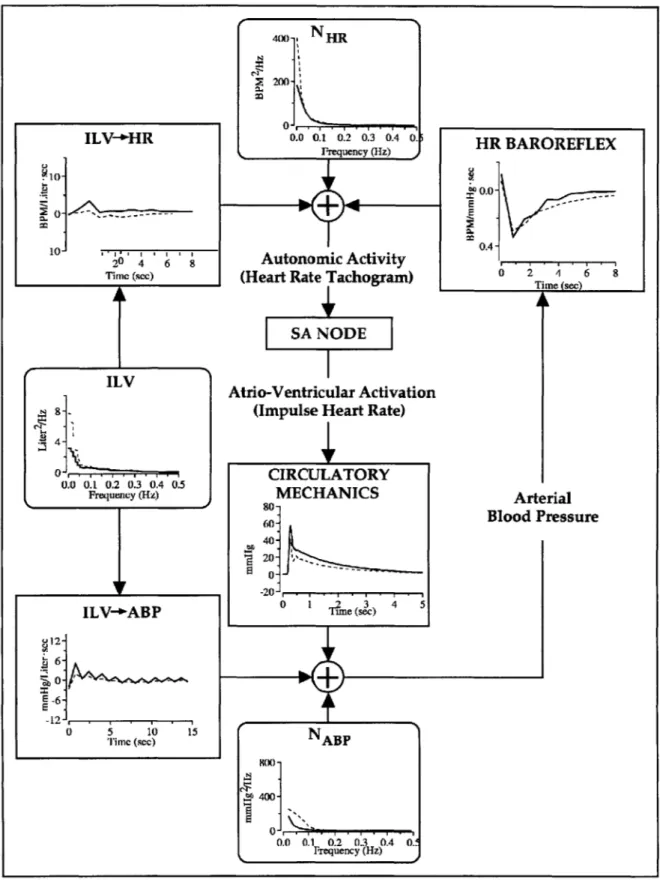
Figure 2-1. CSI Model of short-term cardiovascular regulation. Reprinted from Mullen et al. 1997 ... 1 1
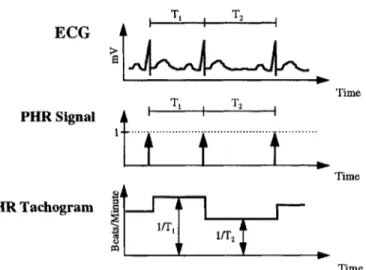
Figure 2-2. Derivation of HRT from ECG... 12
Figure 2-3. Group-averaged results for subjects in supine (solid lines) and standing (dashed lines) postures. Reprinted from Mullen et al. 1997... 14
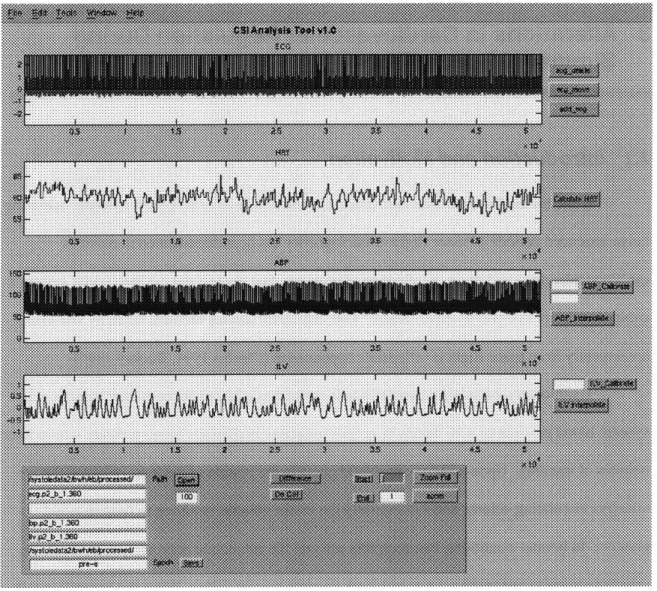
Figure 2-4. Screenshot of the CSI Analysis Tool. ... 17
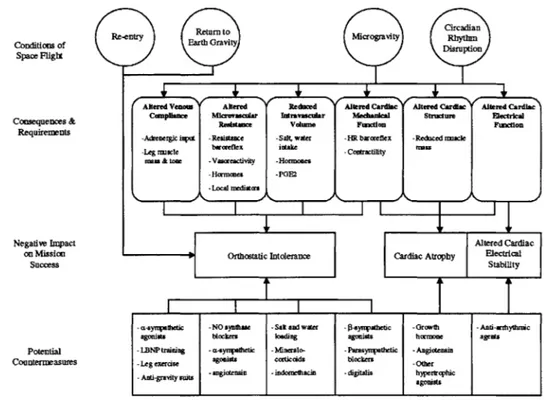
Figure 3-1. Diagram of the cardiovascular effects of space flight, potential mechanisms, and possible countermeasures. Reprinted from Cohen Annual Program Report 1999. ... 19
Figure 3-2. Group-averaged comparison of supine (solid lines) and standing (dashed lines) postures in Bedrest subjects during Phase 4 Post-bedrest. ... 23
Figure 3-3. Group-averaged CSI results for Bedrest subjects in Supine position during pre-bedrest (thick solid line), last-day of pre-bedrest (dashed line), and post-pre-bedrest (thin solid line). ... 2 5 Figure 3-4. Group-averaged CSI results for Bedrest subjects in Standing position during pre-bedrest (thick solid line), last-day of pre-bedrest (dashed line), and post-pre-bedrest (thin solid line).
...
2 6
Figure 3-5. Group-averaged comparison of supine (solid lines) and standing (dashed lines) postures during Post-bedrest Phase 4 Week 1... 30Figure 3-6. Group-averaged CSI results for 5 Bone subjects in supine position during Pre-bedrest p2_wl (thick solid line), End-bedrest p3_w17 (dashed lines), and Post-bedrest p4_w2 (thin solid line). ... 32
Figure 3-7. Group-averaged CSI results for 5 Bone subjects in standing position during Pre-bedrest p2_w I (thick solid line), End-bedrest p3_w17 (dashed lines), and Post-bedrest p4_w 2 (thin solid line). ... 33
Figure 4-1. Typical arterial blood pressure response to phenylephrine. Heart rate is reduced in compensation to drive arterial blood pressure back to steady-state values... 37
Figure 4-2. Phe-BRSaII (blue filled points + red empty points) and Phe-BRSex (blue filled points) for subject 13. The red dashed line corresponds to the Phe-BRSai regression. The blue solid line corresponds to the Phe-BRSex regression... 39
Figure 4-3. For each subject, the mean Phe-BRSan (red empty circles) and Phe-BRSex (blue filled circles) are plotted along with the range of two standard deviations... 40
Figure 4-4. Group averaged CSI results...42
Figure 4-5. Block Diagram of Method 1. ... 44
Figure 4-6. Diagram of an IPFM model. Reprinted from Boer and Karemaker 1985. ... 44
Figure 4-7. The mean BRSMethod I ± 2 standard deviations are plotted for each subject... 46
Figure 4-8. Comparison of Phe-BRS and BRSMethod 1 .---..----.--...
47
Figure 4-9. Block Diagram of Method 2. ... 49
Figure 4-10. Comparison of Phe-BRS and
BRSMetfod 2...49
Figure 4-11. Block Diagram of Method 3...51
Figure 4-12. Comparison of Phe-BRS and BRSMthod 3...51
Figure 4-13. Phe-BRS vs. BRSMethd2 with modified ABP ramps. The top graph uses an ABP ramp averaged across all subjects and all analyzable pressure segments. The bottom graph uses an ABP ramp averaged across all pressure segments for each subject. ... 53
Figure 5-1. CSI data is obtained during periods I, II, and III. Perception of body and head tilt
orientation were obtained after 3 and 13 min. Symbols depict means t stdev. Reprinted
from Ram sdell 1999... 57
Figure 5-2. The distribution of perceived tilt orientation for each virtual stimulus after 3 min
exposure. The box plots show the 10th, 25th, 50th (median, heavy line), 75th and 90th percentiles. Reprinted from Ramsdell 1999...59 Figure 5-3. Group averaged CSI results for subjects in supine (thick solid line), standing (thin
List of Tables
Table 3-1. Comparison of CSI results: supine and standing postures during pre-bedrest, end-bedrest, and post-bedrest (mean standard error). * denotes a p-value < 0.05 with respect to
pre-bedrest. A denotes a p-value < 0.05 with respect to supine. N=16 subjects. ... 27
Table 3-2. Comparison of CSI results: supine and standing postures during phase 2 week 1 vs. phase 3 week 17 vs. phase 4 week 1. (mean ± standard error). * denotes p-value < 0.05 with respect to pre-bedrest. A denotes p-value < 0.05 with respect to supine. N=5 subjects... 34
Table 4-1. CSI results (mean stderr). N=13 Subjects... 41
Table 4-2. Parameters of the perturbing ABP ramp used in Method 3. ... 53
Table 5-1. Perceived orientation. Mean±standard error. ... 58
Table 5-2. Comparison of CSI results: supine vs. standing vs. virtual tilt (mean±stderr). * indicates parameters with P-values < 0.05 with respect to supine. N=16 subjects... 60
1 Preface
The normal cardiovascular system generally functions well in maintaining arterial blood pressure within a narrow homeostatic range despite a number of internal and external
cardiovascular perturbations. Some of these internal perturbations include processes such as respiration and fluctuations in peripheral resistance; while external perturbations include such factors as a person's level of exercise, the ambient temperature, and a person's posture (Akselrod
1985, Hirsch 1981, Saul 1991). The cardiovascular system compensates for these perturbations
through a closed-loop network of cardiovascular reflexes including among others, the heart-rate
baroreflex and the Bainbridge reflex. Unfortunately, while the basic mechanisms responsible for short-term cardiovascular regulation arefait accompli, the integrated homeodynamic system remains to be well understood (Mullen 1997).
Because of this gap in our understanding, physicians have been unable to properly diagnose or prescribe therapies for a variety of cardiovascular problems arising from extreme internal and/or external perturbations. Of unique importance is a class of problems arising from
extreme external perturbations involving extended microgravity environments on the normal
functioning of our cardiovascular system. For example, microgravity has been documented to
result in cardiovascular deconditioning, a collection of problems that impairs the cardiovascular
system's ability to readapt to a gravity environment. Indeed, one especially serious problem
faced by astronauts upon reentry from space flight is orthostatic intolerance, an inability to
maintain proper blood perfusion to various vital centers of the body.
In order to ensure the safety of astronauts, who are increasingly exposed to progressively longer periods of spaceflight and eventually habitation, a full elucidation of our integrated
battery of experiments sponsored by the National Space Biomedical Research Institute to explore the effects of long-term microgravity environments on our cardiovascular regulatory systems.
In Section 2, we describe Cardiovascular System Identification (CSI), a novel process by which to quantitatively and noninvasively characterize short-term cardiovascular regulation. CSI, which has been proven to provide a useful prognostic indicator of various autonomic disorders, will provide the primary tools with which we investigate cardiovascular hemodynamics under
various perturbations and stresses. In Section 3 Alterations in Cardiovascular Regulation During
Simulated Space Flight, we describe and discuss two experimental protocols that simulate the
cardiovascular effects of microgravity on earth. In Section 4 CSI Calculation of Smyth's
Baroreflex Sensitivity, we investigate the heart-rate baroreflex sensitivity, a popular index of
heart-rate baroreflex function, and propose methods to predict this index using noninvasive CSI
methods. Finally, in Section 5 Visual-Autonomic Influence on Short-term Cardiovascular
Regulation, we begin an initial exploration into the effects of integrated visual pathway stimulation on short-term autonomic regulation.
2 Cardiovascular System Identification (CSI)
2.1 Introduction
Cardiovascular System Identification is a noninvasive process by which to quantitatively characterize short-term cardiovascular regulation. Specifically, CSI quantifies the short-term physiologic couplings between such cardiovascular variables as arterial blood pressure (ABP), instantaneous lung volume (ILV), and instantaneous heart rate (HRT), by analyzing their second-by-second fluctuations. By quantifying these physiologic couplings, moreover, CSI provides a closed-loop model of such short-term cardiovascular regulatory functions as the heart-rate baroreflex, circulatory mechanics, ILV->HR, and ILV-*ABP. See Figure 2-1.
As described in Mullen et al., the heart-rate baroreflex characterizes the inverse
autonomic baroreflex coupling between fluctuations in ABP and HRT, which is closely related to the net autonomic input modulating the sinoatrial node (SA Node). Figure 2-2 summarizes the relationship between ECG and HRT, while a more detailed discussion of the heart-rate baroreflex
will be presented later.
The ILV-+HR function characterizes the non-causal autonomic coupling between respiration and HRT and is responsible for respiratory sinus arrhythmia, a process manifested by an increase in heart rate during inspiration and a decrease during expiration. Previous studies
have linked sinus arrhythmia to an increase in sympathetic activity during inspiration and an
increase in vagal traffic during expiration (Berne 1998).
The ILV-4ABP function characterizes the mechanical stimulation of respiration on ABP
due to alterations in venous return and the filling of intrathoracic vessels and heart chambers
associated with the changes in intrathoracic pressure (Mullen 1997). In contrast to the other physiologic couplings, the ILV-*ABP function is primarily mechanically mediated.
NHR HR BAROREFLEX Heart Rate ILV-1-HIRTachogram ILV+HR(HR)
(Autonomic Activity)
Instantaneous
Lung Volume
SA
DE
(ILV)
I
Arterial Blood
Pulsatile
Pressure
Heart Rate
(ABP)
(PHR)
1ILV-ABP
CIRCULATORY
MECHANICS
NABP
Figure 2-1. CSI Model of short-term cardiovascular regulation. Reprinted
from Mullen et aL 1997.
The SA Node is an integrate-and-fire center that closely models the underlying
physiologic process, converting HRT into a pulsatile heart rate signal (PHR), a train of impulses
synchronized with left-ventricular contractions.
Finally, the circulatory mechanics coupling characterizes the ABP waveform that is
generated with each cardiac contraction and is determined by parameters such as cardiac
contractility and the mechanical properties of the arteries and peripheral circulatory system.
In addition, two noise sources, NHR and NAp, are also included. NHR models the changes
in HRT not caused by changes in ABP or ILV. These changes may derive from autonomic
cerebral activity that cannot be modeled. Similarly, NAp models the changes in ABP not caused by ILV or PHR. Such a source may derive from variations in local peripheral vascular resistance caused by any number of existing physiologic pathways.
ECG Time PHR Signal T 2 i Time HR Tachogram lIT2 Time Figure 2-2. Derivation of HRT from ECG.
This CSI model can be represented by the following pair of linear time-invariant
autoregressive moving-average (ARMA) difference equations:
Mn p
HRT(t)= aiHRT(t - i) + biABP(t - i)+ IciILV(t - i) +WHR(t
i=1 i=1 i=-p'
ABP(t) =
diABP(t
-i)
+ eX PHR(t - i) + f1ILV(t - i)+
WABP (t)where m, n, p, p', q, r, s, and s' are all positive integers and restrict both the model's order and the causality or non-causality of the associated physiologic couplings. WHR and WAr represent the noise terms associated with NHR and HAp. Before solving this system of equations, all signals
are downsampled to match the bandwidth of the particular transfer function involved. Both equations can be solved by minimizing the variance of the noise terms in a least squares sense. The system-identification algorithms are discussed elsewhere (Ljung 1987; Perrott 1996).
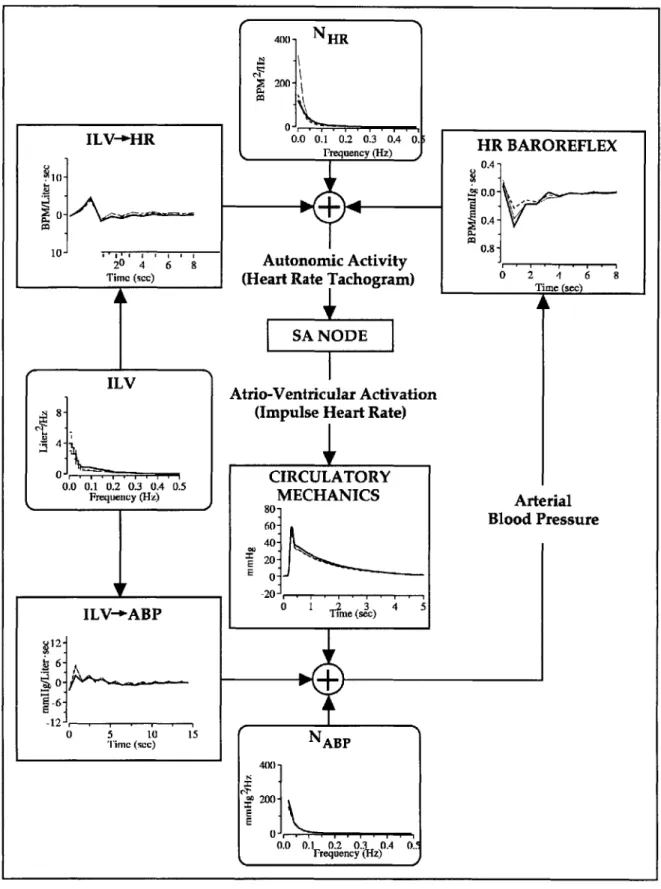
Figure 2-3 plots a solution set to the CSI equations comparing cardiovascular regulation and function during postural changes from supine to standing positions (Mullen 1997). Of especial importance to this thesis are the four transfer functions: HR-Baroreflex, ILV-4HR, Circulatory Mechanics, and ILV->ABP. As expected, both the HR-Baroreflex impulse response and the ILV-+HR impulse response reflect normal physiologic behavior. In response to an
impulse of ABP at time 0, the HR-Baroreflex function immediately decreases at time 0 towards
negative values, representing a reflexive decrease in HRT. Similarly, notice that the ILV-+HR impulse response function characterizes a noncausal increase in heart rate associated with inspiration or an impulse of ILV at time 0. This is consistent with the observation that HRT typically increases in anticipation of corresponding changes in ILV. Finally, notice that the circulatory mechanics impulse response resembles a single blood pressure pulse with a time delay of approximately 0.25s, reflecting the interval between the cardiac R-wave and the onset of the radial ABP pulse (Mullen 1997).
Note that the change in posture from supine to standing positions results primarily in a shift from parasympathetic toward sympathetic control. Accordingly, both the HR-Baroreflex and ILV-+HR impulse responses are diminished. This is consistent with previous human studies that have found heart rate variability to be primarily controlled via parasympathetic pathways (Akselrod 1985, Saul 1991). In contrast, the mechanically mediated circulatory mechanics and ILV->ABP transfer functions do not exhibit large changes during postural shifts. Later parts of this thesis will further reconfirm the effects of postural changes on these autonomically mediated reflexes.
ILV-+HR 8- 4-0 ... ... -4-'2 0 2 4 6 8 Time (sec) 4. ILV 1-0.0 0.1 0.2 0.3 0.4 0.5 Frequency (Hz) 800 NHR 600H Autonomic Activity (Heart Rate Tachogram)
SA NODE
Atrio-Ventricular Activation (Pulsatile Heart Rate)
CIRCULATORY MECHANICS 200 -00 O 0.5 '' 1 . 0 5 Time (sec) Frequency (Hz) SA0 NABP 0 0.0 0.5. .0. .5 FresecH) HR BAROREFLEX 0.2-0.0' .. -0.2-,' -0.4-y S-0.6 -0.8. (02 Time (sec) A Arterial Blood Pressure
Figure 2-3. Group-averaged results for subjects in supine (solid lines) and standing (dashed lines) postures. Reprinted from Mullen et a. 1997.
In order to make quantitative comparisons of these transfer functions, they will first be parameterized according to the following equations:
6. ILV-ABP 3- --' 0. -3-0 5 10 15 Time (sec) k
Peak Amplitude = I1 niin[h(t)] I for HR Baroreflex
max[h(t)] otherwise
Area= fh(t)dt
Absolute Area= f Ih(t) I dt
t I
h(t)Idt
Characteristic Time= -'
JI
h(t)Idt
These parameters will then be log normalized and compared using a two-tailed paired student
t-test.
Unless otherwise stated, each of the experimental protocols outlined below involved acquiring six-minute segments of all CSI variables according to the protocol outlined in Mullen et
al. In this protocol, the ABP signal is measured from the middle finger of either hand using a
Finapres blood pressure monitor (Ohmeda, Inc). The ILV signal is measured with a Respitrace system two-belt chest-abdomen inductance plesthysmograph (Ambulatory Monitoring Systems, Inc.) and calibrated with an 800 cc inflatable spirobag. Data is collected under a random interval breathing protocol to broaden the frequency content of the recorded physiologic signals for CSI analysis (Berger 1989). In this breathing protocol, subjects breathe in response to pre-recorded auditory cues with a mean rate of 12 breaths per minute and inter-breath intervals randomly varying between 1 to 15 seconds. Finally, all CSI analysis is performed using the methods and
2.2
Analysis Tools
In order to efficiently process the large volume of CSI data expected to enter the various studies described in the following chapters, a graphical analysis tool was created in Matlab 5.0 to provide a flexible software platform from which to quickly prototype and integrate various
pre-and post-processing algorithms with the existing CSI algorithms. This graphical analysis tool included functionalities ranging from signal annotation to signal deglitching, data calibration, and push-button interfaces to existing CSI algorithms. HRT is directly calculated from the
electrocardiogram signal in the manner described by Berger et al. Figure 2-4 displays a
screenshot of the application. Unless otherwise noted, all algorithms implemented in the chapters
to follow were similarly prototyped in Matlab 5.0.
For several of the studies described below, data was digitally acquired and
recorded onto digital audio tapes (DAT) by offsite collaborating laboratories that
physically conducted all of the human experimental protocols. This data was
subsequently digitized at MIT via a TEAC RD-120TE DAT recorder, calibrated, and
archived onto several Linux-based workstations for signal processing and CSI analysis.
The complete dataset, CSI algorithms, and associated signal conditioning algorithms is
archived at the data repository of the National Space Biomedical Research Institute.
3 Alterations in Cardiovascular Regulation During
Simulated Space Flight
3.1
Introduction
and Motivation
While the cardiovascular system generally functions well over a large dynamic operating range, extended periods of space flight or microgravity has been documented to result in
cardiovascular deconditioning, a collection of problems that impairs the cardiovascular system's ability to readapt to a gravity environment. One especially serious problem faced by astronauts upon reentry from space flight is orthostatic hypotension (Charles 1994, Buckey 1996).
Traditionally, orthostatic hypotension is defined as a 20 mmHg or greater reduction in systolic blood pressure or a 10 mmHg or greater reduction in diastolic blood pressure within three minutes of standing. Upon standing, the blood pools in the vessels of the legs, reducing the effective circulating volume and subsequently the stroke volume, resulting in drop in blood pressure. In normal conditions, baroreceptors activate the autonomic nervous system to release catecholamines to restore blood pressure back towards normal values. When the baroreflex fails,
however, heart rate and blood pressure do not rise adequately, resulting in orthostatic
hypotension. In some cases, the effects of orthostatic hypotension are sufficiently severe such
that astronauts cannot stand erect for an extended period immediately following reentry from
space, and instead experiencing episodes of syncope or fainting. This results in potentially dangerous situations in the event of emergency egress from spacecraft either on Earth or on other planetary bodies such as Mars.
During extended periods of microgravity space flight, it is hypothesized that orthostatic
hypotension occurs due to blood pooling in the legs, reducing the preload to the heart, decreasing cardiac output, and resulting in hypotension. Factors believed to contribute to this process
rate arterial baroreflex, decreases in intravascular fluid volume, and changes in cardiac function (Cohen Annual Report 1999). Figure 3-1 outlines some of the potential mechanisms underlying cardiovascular deconditioning and their potential countermeasures. Unfortunately, while current evidence suggests microgravity induced alterations in cardiovascular regulation are to blame, the precise physiologic mechanisms responsible for these changes in cardiovascular regulation remain unknown. In part, our gaps in knowledge are due to the ambiguity and imprecision of existing data from studies to date on the cardiovascular effects of space flight.
Retun toCircadian
Conditions of Re-en Ert to Space Flight
Altered Ves Altered Reduced Altered Cardiac Altered Cardiac Attend Cardia
Compliance Mcrowascular Intravascular Mechanical Structure Electrical
Consequenes& Resistance Volume Function Function
Requirements -Adrenergic ixt -Resistance -Salt, water -HR barcreflex -Reduced rascle
-lgmscle baorefle intake -Contractility Mau
rean & tone -Vascreactivity -Hormones
-Hormones -PGE2
-LAcal maediatcrs
Negative Impact Altered Cardiac
on Mission Orthostatic Intolerance Cardiac Atrophy Electrical
Success Stability
a-syrapathetic -NO synthase -Sal and water --syapathetic -Growth -Anti-a hyturic
agonists blockera loading ageoita hormone agents
Potential -LBNP training - esyroatlfeic -Mineralo- -Parasynpathetic -Angiotensin
Countermeasures -Lg exercise agonists corticcids blockers Other
-Antd-gravity suits -angictensin -indomehacin -digitalis hyperbrcphic agonists
Figure 3-1. Diagram of the cardiovascular effects of space flight, potential mechanisms, and possible countermeasures. Reprinted from Cohen Annual Program Report 1999.
Two studies were therefore initiated to examine the effects of simulated microgravity on changes in cardiovascular regulation: the Short-Term Bedrest Study and the Long-Term Bone Demineralization/Calcium Metabolism Study. In both of these studies, the primary goal was to apply CSI to quantitatively characterize changes in cardiovascular regulation and function, if any,
caused by simulated microgravity. With the aid of CSI, the primary hypothesis under experiment
is that the heart rate baroreflex and other autonomically mediated physiologic mechanisms are
altered by exposure to simulated microgravity. Furthermore, alterations in these physiologic
mechanisms play an important role in orthostatic intolerance. These studies are described in
greater depth below.
3.2 Short-Term Bedrest Study
In 1998, a study was initiated at the General Clinical Research Center of the Brigham and Women's Hospital to study the effects of 16 day simulated microgravity, sleep deprivation, and disruption of diurnal rhythms on cardiovascular regulation in general and orthostatic intolerance in particular. In the main, this thesis will focus on the first stimulus while ignoring the effects of
the other stimuli.
3.2.1 Experimental Protocol
While it is difficult in general to reproduce a microgravity environment on earth, the most commonly used model and the one adopted for this study is prolonged supine bedrest, five-degree
head down tilt.
Fifteen male subjects in excellent health and with anthropometric characteristics similar
to those of American astronauts [age = 33.5 ± 11.3 (SD) years, height = 70± 2.4 (SD) inches, weight = 76.8 ± 7.6 (SD) kilograms] were selected after screening physical and psychological examinations. Screening laboratories and tests included a 12-lead electrocardiogram, complete blood count with differential, chemistry profile, thyroid function tests and urinalysis. The exclusion criteria included history or evidence for psychiatric disorders, hypertension, diabetes, coronary artery disease, renal insufficiency, thyroid disease, alcohol or drug abuse, viral hepatitis
or anemia. The Brigham and Women's Hospital (Boston, Massachusetts) Research Committee approved the protocol and informed consent was obtained.
Following the screening procedures, subjects were admitted to the Brigham and Women's Hospital General Clinical Research Center for Phase 2. During Phase 2, they spent three (subjects 1-4) or five (subjects 5-15) days undergoing baseline testing and equilibrating to an isocaloric diet consisting of 200 mEq sodium, 100 mEq potassium, and 2500 ml fluid. Subjects were then instrumented for CSI in conjunction with a tilt-stand protocol. Data
acquisition for CSI involves non-invasively measuring and recording the surface ECG, ABP, and ILV, for each subject using an on-line dedicated data sampling and analysis program. The ABP signal is measured from the middle finger of the left or right hand using a Finapres (Ohmeda, Inc.) or Portapres (TNO, Netherlands) blood pressure monitor. The ILV signal is measured with a Respitrace (Ambulatory Monitoring Systems, Inc.) system two belt chest-abdomen inductance plethysmograph and calibrated with an 800 cc inflatable spirobag. For each CSI data acquisition period, these signals were recorded for eight minutes. For data acquisition, subjects breathe
according to a random interval breathing protocol (Berger et al. 1989) which requires them to
breathe in response to auditory cues at a comfortable mean rate of 12 breaths per minute, but with inter-breath intervals randomly varying between one and 15 seconds. Subjects adjust their own tidal volumes thereby leaving blood gases unperturbed. The random interval breathing protocol broadens the frequency content of the recorded physiological signals, thereby facilitating CSI. Data for CSI was acquired with subjects laying supine on a tilt table, then at thirty degrees head up tilt, then at sixty degrees of head up tilt, and finally standing. Following these CSI data
acquisition sessions, the subjects stood upright quietly for an additional 140 minutes for hormonal measurements for a parallel study. The test was immediately terminated if a subject experienced a sudden precipitous drop in blood pressure and had difficulty appropriately responding to questions, i.e., manifested mental status changes consistent with presyncopal symptoms.
During Phase 3, days 5 through 21, subjects then underwent -5* head-down tilt bed rest for nine (subject 1), 14 (subjects 2-4), or 16 days (subjects 5-15). Subjects were strictly confined to bed for the entire bed rest period. They ate all meals lying on their side, propped up with one
elbow. They used a bedpan to urinate or defecate. All CSI variables were measured on days 10, 20, and 21. The tilt-stand test with CSI data acquisition described above was repeated at the end of the bed rest period and again finally in Phase 4 (Post-Bedrest), after two (subjects 1-4) or three (subjects 5-15) days of normal ambulatory activity.
3.2.2 CSI Results
To reconfirm the effects of postural changes on short-term cardiovascular regulation presented by Mullen et al., we first compared the changes in parameterized CSI results from
supine to standing positions using data acquired during post-bedrest. These results are
summarized graphically in Figure 3-2. Changes in posture from supine to standing result in both autonomic shifts from parasympathetic toward sympathetic activity as well as mechanical effects in left-ventricular pre-load. Accordingly, notice that the peak amplitudes of all coupling
mechanisms, both autonomic and mechanical, are altered. In particular, both the ILV-+HR and
Heart Rate Baroreflex couplings are diminished in the standing posture relative to supine. This is
consistent with findings in humans that the parasympathetic nervous system is normally the
400- NHR 2-I 0-0.0 0.1 0.2 0.3 0.4 0. Frequency (Hz) HR BAROREFLEX 0.0 -UE 10-04 20 4 ' ' Autonomic Activity
Tim (scc) (Heart Rate Tachogram) 0 2 4 6
SA NODE
Atrio-Ventricular Activation
8. (Impulse Heart Rate)
0-
CIRCULATORY
0. 0 .1 0.2 0.3 0.4 0.5 ICLTR
Frequency (Hz) MECHANICS Arterial
60- Blood Pressure 40--20 . ILV+-6ABP rie (s u12- 6-E -6-12. 5 5 10 15 N
Timc (sec) ABP
8(X)
-,f
400-0.0 0.1 0.2 0.3 0.4 0.
Frequency (Hz)
Figure 3-2. Group-averaged comparison of supine (solid lines) and standing
(dashed lines) postures in Bedrest subjects during Phase 4 Post-bedrest.
Figure 3-3 plots the group-averaged CSI results in supine position during pre-bedrest
(thick solid line), last-day of bedrest (dashed line), and post-bedrest (thin solid line). Similarly,
Figure 3-4 plots the group-averaged CSI results in standing position during pre-bedrest (thick
solid line), last-day of bedrest (dashed line), and post-bedrest (thin solid line).
Notice that the peak amplitude of the heart-rate baroreflex function is noticeably diminished by simulated microgravity in both supine and standing postures, but more than recovers to pre-bedrest values three days after bed-rest. Likewise, the peak amplitude of the circulatory mechanics function is also diminished by bedrest only to recover to pre-bedrest values three days post-bedrest. This may be perhaps be explained by the fact that while circulatory mechanics is determined by the mechanical properties of the heart and vascular system, these parameters are autonomically modulated. For example, a decrease in cardiac contractility, which is modulated by beta-sympathetic pathways, may lead to a decrease in the peak amplitude of the
circulatory mechanics. These results suggest that extended periods of simulated microgravity
alters the heart-rate baroreflex and other autonomically mediated reflexes.
Finally, Table 3-1 compares all CSI parameters (mean ± standard error) of the impulse
response functions for pre-bed rest vs. end of bedrest (i.e., within an hour of completing the bed rest period) vs. post-bed rest (i.e., 2 or 3 days following bed rest) for both supine and standing
postures. An * denotes a parameter with a p-value < 0.05 with respect to the corresponding pre-bedrest parameter. An A denotes a parameter with a p-value < 0.05 with respect to the
corresponding supine parameter. While all parameters are presented, the Peak Amplitude
400- NHR
Ei 100-s
0.0 0.1 0.2 0.3 0.4 0.
Frequency (Hz) ,0
Autonomic Activity (Heart Rate Tachogram)
SA NODE
Atrio-Ventricular Activation (Impulse Heart Rate)
CIRCULATORY MECHANICS 80- 60- 40- 20--20-....s .. 0 1 T~m(sec) NABP 400 -200 r E 0.0 0.1 0.2 0.3 0.4 0.-rrequency (Hz) Arterial Blood Pressure
Figure 3-3. Group-averaged CSI results for Bedrest
position during pre-bedrest (thick solid line), last-day line), and post-bedrest (thin solid line).
subjects in Supine of bedrest (dashed ILV-+-HR 10-10i 20 4 6 8 Time (see) HR BAROREFLEX 0.4F 0.0 - 0.8-0 2 1 6 8 ILV 8-4-. 0.0 0.1 0.2 0.3 0.4 0.5 Frequency (Hz) ILV-'ABP
~12-g 6-0 5 1 -6. -12-T $ime (see) 15HR BAROREFLEX 4-2- 0.0 -0- E 2--0 20 4 6 8 Autonomic Activity ,.
Time (scc) (Heart Rate Tachogram) 0 2 6 8
SA NODE
Atrio-Ventricular Activation
8- (Impulse Heart Rate)
0 , .CIRCULATORY
0.0 0.1 0.2 0.3 0.4 0.5
Frequency (Hz) MECHANICS Arterial
80-Blood Pressure 20 . 140- S-6--12 0 ILVBTime 5 10 15N (sec)P 2200 60-0.0 0.1 0.2 0.3 0.4 0 Frequency (Hz)
Figure 3-4. Group-averaged CSI results for Bedrest subjects in Standing position during pre-bedrest (thick solid line), last-day of bedrest (dashed line), and post-bedrest (thin solid line).
ILV-+-HR 4X)>- NHR 2 20 0-0.0 0.1 0.2 0.3 0.4 0. Frequency (Hz)
Table 3-1. Comparison of CSI results: supine and standing postures during pre-bedrest, end-bedrest, and post-bedrest (meantstandard error). * denotes a p-value < 0.05 with respect to pre-bedrest. A denotes a p-value < 0.05 with respect to supine. N=16 subjects.
Impulse
Response Condition In(Peak Amplitude) Area In(Absolute Area) In(Characteristic Time)
Supine Standing Supine Standing Supine Standing Supine Standing
ILV->HR Pre-Bedrest 1.38±0.15 0.42±0.27A 0.02±3.08 -4.71±3.03 2.53±0.16 2.58±0.15 1.02±0.14 1.40±0.17
End Bedrest 1.15±0.16 0.30±0.26^ 3.01±2.56 -3.46±2.76A 2.56±0.18 2.43±0.12 1.22±0.15 1.65±0.18
Post-Bedrest 1.25±0.17 0.52±0.27" 6.26±4.61* -3.47±4.64 2.75±0.15 2.71±0.16 0.77±0.28 1.61±0.19^
HR baroreflex Pre-Bedrest -0.76±0.13 -0.82±0.10 -0.72±0.12 -1.39±0.23^ 0.16±0.09 0.47±0.10A 1.27±0.10 1.63±0.13^
End Bedrest -1.64±0.19* -1.33±0.15* -0.38±0.08* -1.05±0.15^ -0.29±0.15* 0.13±0.13 1.49±0.12 1.72±0.13 Post-Bedrest -0.92±0.09 -1.23±0.07*A -0.83±0.25 -1.07±0.20 0.27±0.09 0.31±0.11 1.42±0.13 1.82±0.15"
ILV->ABP Pre-Bedrest 0.77±0.11 1.26±0.22^ -0.78±2.65 0.60±2.95 2.66±0.14 2.86*0.19 2.12±0.10 1.93±0.08
End Bedrest 1.41±0.17* 1.00±0.24 5.76±3.95 4.17±4.02A 2.93±0.15 2.77±0.20 2.00±0.14 1.91±0.16
Post-Bedrest 1.44*0.13* 0.94±0.26 5.76±3.35 -2.62±3.97 2.88±0.19 2.88±0.15 1.92±0.13 1.94±0.13
Circulatory Pre-Bedrest 4.13±0.03 3.87±0.06" 67.76±2.68 55.48±3.26" 4.20±0.04 3.99±0.06" 0.58±0.04 0.67±0.06 Mechanics End Bedrest 4.04±0.04* 3.62±0.07*^ 60.47±3.80 45.59±3.02*^ 4.07±0.07 3.79±0.07*^ 0.53±0.06 0.67±0.09
Post-Bedrest 4.13±0.03 3.76±0.05" 62.93±2.44 45.92±2.59*^ 4.13±0.04 3.81±0.06*^ 0.55±0.05 0.65±0.08
3.2.3 Discussion
The results of the head-down tilt bedrest study indicate that simulated
weightlessness significantly decreases the gain of the autonomically-mediated Heart-Rate
Baroreflex, corroborating findings from previous studies by Convertino and Fritsch.
Interestingly, the other autonomically-mediated impulse response, ILV-+HR, was not
significantly attenuated by head-down tilt bedrest. This finding indicates that head-down
tilt bed rest does not necessarily cause a syndrome of global autonomic dysfunction
similar to diabetic autonomic neuropathy, but that it can alter the function of
autonomically-mediated cardiovascular regulatory mechanisms.
Head-down tilt also causes changes in the mechanically mediated Circulatory
Mechanics and ILV-+ABP impulse responses consistent with a decrease in intravascular
volume. These impulse responses are affected to a lesser degree than the
autonomically-mediated Heart-rate baroreflex.
3.3 Long-Term Bone DemineralizationlCalcium Metabolism
Study
In addition to the Short-Term 16-day Bedrest study, a second study was initiated with the
Bone Demineralization/Calcium Metabolism Team of the National Space Biomedical Research
Institute to examine the effects of long-term simulated microgravity on cardiovascular
deconditioning. Previously, the Bone Demineralization/Calcium Metabolism team had proposed
long-term 17-week bedrest studies to analyze the processes underlying bone demineralization and
calcium metabolism in space flight as well as potential countermeasures in the form of in-bed
resistive exercises. Appropriately, 17-weeks reflects the amount of time Mir crews currently
spend in microgravity. Collaboration with this study therefore offered a unique opportunity to
apply CSI techniques to the study of cardiovascular function and regulation in long-term
simulated space flight.
3.3.1 Experimental Protocol
The Bone Demineralization/Calcium Metabolism study will eventually analyze 20
normotensive subjects (10 males and 10 females) over three years. Each subject undergoes a
22-week testing period divided into three primary phases. The full protocol can be found in the
original project proposal submitted to the National Space and Biomedical Research Institute
(Cohen 1998). An abridged protocol, omitting procedures not directly relevant to CSI analysis, is
summarized as follows. During Phase 2 (weeks 1-2), all subjects undergo pre-bedrest orientation
and baseline measurements of all CSI variables in both supine and standing postures.
Each CSI data acquisition session is repeated twice for a total of 15 minutes as subjects breathe according to the random interval breathing protocol previously discussed. Subsequently, Phase 3 (weeks 1-17) consists of uninterrupted bedrest. Horizontal movement in bed is permitted and the
subjects will be allowed to rise on one elbow, with the armpit touching the bed, for eating and
reading. They will not be allowed to sit up or dangle their legs over the bed. All CSI variables are again measured twice for a total of 15 minutes during weeks 8, 12, 15, and 20. Finally, this protocol concludes with Phase 4 (weeks 1-2), which consists of post-bedrest recovery where subjects become re-ambulatory. All CSI variables are again measured in both supine and standing postures for a total of 15 minutes.
3.3.2 CSI Results
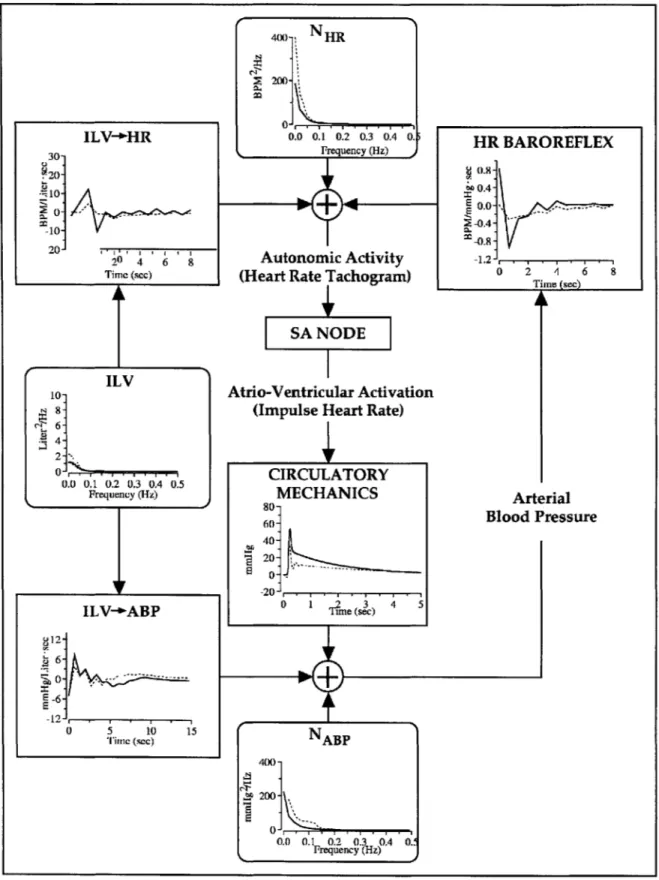
To date, only five subjects have completed the entire protocol. To reconfirm the effects of postural changes on short-term cardiovascular regulation as presented by Mullen et al., Figure 3-5 compares the group-averaged changes in CSI impulse responses from supine to standing positions using data acquired during post-bedrest phase 4 week 1 (p4_wl). Unfortunately, there was insufficient data to analyze the corresponding supine-standing comparison in the pre-bedrest phase. Notice that the peak amplitudes of all coupling mechanisms, both autonomic and
mechanical, are altered. In particular, both the ILV-*HR and Heart Rate Baroreflex couplings
are diminished in the standing posture relative to supine. This is consistent with findings in
humans that the parasympathetic nervous system is normally the primary mediator of heart rate
4xE- NHR 200-0. 0.0 0.1 0.2 0.3 0.4 0. Frequency (Hz) 200. 2 ;0 0.4 --10-
~
2-0.8-20- 1. Activity. 20 4 6 8Autonomic
Activity -1.2Time (scc) (Heart Rate Tachogram) 0 2 s c6
SA NODE
ILV
10. Atrio-Ventricular Activation
8- (Impulse Heart Rate)
6- 4-
2-CIRCULATORY
0
0 0.1 0.2 0.3 0.4 0.5Frequency (Hz) 80MECHANICS Arterial
80-60- Blood Pressure 40-ILV+ABP 0 1 Tme (s c) 4 20 -6 2 -6--12 S 5 10 15N
0 mcTime (sec) ABP
2200
0.0 0.1----.
Figure 3-5. Group-averaged comparison of supine (solid lines) and standing (dashed lines) postures during Post-bedrest Phase 4 Week 1.
Figure 3-6 plots the group-averaged CSI results in supine position, Pre-bedrest p2_wl (thick solid line), End-bedrest p3_w17 (dashed lines), and Post-bedrest p4_w l (thin solid line). Similarly, Figure 3-7 plots the group-averaged CSI results of the current five subjects in standing position, Pre-bedrest p2_wl (thick solid line), End-bedrest p3_w17 (dashed lines), and
Post-bedrest p4_w l (thin solid line). Finally, Table 3-2 compares all CSI parameters (mean ± standard error) of the impulse response functions for Pre-bedrest vs. End-bedrest vs. Post-bedrest for both supine and standing postures. An * denotes a parameter with a p-value < 0.05 with respect to the corresponding Pre-bedrest parameter. An A denotes a parameter with a p-value < 0.05 with respect to the corresponding supine parameter. While all parameters are presented, again the
Peak Amplitude parameter proved to be the most robust for comparing differences before and after bed rest.
Notice that the peak amplitude of the heart-rate baroreflex function is statistically diminished by the end of bedrest but more than recovers to pre-bedrest values two weeks after bed-rest. In contrast, like the Short-term Bedrest study, the peak amplitude of the ILV-+HR transfer function is not altered in a statistically significant sense. Interestingly, the ILV->ABP transfer function also shows a statistically significant change caused by bedrest. This difference, however, may be an artifact of the small sample size (data from only 3 subjects were compared after elimination of outliers in the paired t-test). While only a minimal sample set of data was available for this preliminary study, the results are encouraging and corroborate the results of the Short-term Bedrest study, suggesting that the heart rate baroreflex and other autonomically mediated physiologic mechanisms are altered by exposure to long term simulated microgravity.
ILV-+HR 30-Y20 -10- 20-201 , , 204 6 8 Time (scc) 400- NHR S2001~ 0-0.0 0.1 0.2 0.3 0.4 0. i Frequency (Hz) ", Autonomic Activity (Heart Rate Tachogram)
SA NODE
Atrio-Ventricular Activation (Impulse Heart Rate)
CIRCULATORY MECHANICS 80- 20-NABP 400-200 E 01 0.0 0.1 0.2 0.3 0.4 0 Frequency (Hz) Arterial Blood Pressure
Figure 3-6. Group-averaged CSI position during Pre-bedrest p2_wi (dashed lines), and Post-bedrest p4_
results for 5 Bone subjects in supine (thick solid line), End-bedrest p3_w17 w2 (thin solid line).
HR BAROREFLEX , 0.4 -~
S0.4-~-0.8-/
-1.2 0 2 6 8 Time (sec)A
ILVS2011
0.0 0.1 0.2 0.3 0.4 0.5 Frequency (Hzi) ILV-ABP g12-6 60 --12-. 0 5 10 15 Time (Sec)ILV-+HR 30- 520- -10-20- ,*. , , ' ILV 10. 8- 6--0 2 V 0.0 0.1 0.2 0.3 0.4 0.5 Frequency (Hz) 4x- NHR 0-0.0 0.1 O.2 0.3 0.4 0. Frequency (Hz) Autonomic Activity (Heart Rate Tachogram)
SA NODE
Atrio-Ventricular Activation (Impulse Heart Rate)
CIRCULATORY MECHANICS 80- 60- 40-4P - 20--20 S 3e(s c) 4 5 NABP 200-0. 0.() 0.1 0.2 0. 0.4 . Frequency (Hz)
HR BAROREFLEX
E 0.01 -0.8--1.2 ,. 0 2 6 8 Time (sec)Arterial
Blood Pressure
Figure 3-7.
Group-averaged CSI results for
5
Bone subjects in
standing position during Pre-bedrest p2_wl (thick solid line), End-bedrest
p3_w17 (dashed lines), and Post-bedrest p4_w2 (thin solid line).
ILV-+ABP 12- 6-EE-6' 0 5 10 15 Tiic (scc)
Table 3-2. Comparison of CSI results: supine and standing postures during phase 2 week 1 vs. phase 3 week 17 vs. phase 4 week 1. (mean t standard error). * denotes p-value < 0.05 with respect to pre-bedrest. A denotes p-value < 0.05 with respect to supine. N=5 subjects.
Impulse Response Condition In(Peak Amplitude) Area In(Absolute Area) In(Characteristic Time)
Supine Standing Supine Standing Supine Standing Supine Standing
ILV->HR Pre-bedrest 2.69±0.29 2.36±0.05 -1.70±3.88 -16.52±16.98 3.63±0.23 3.51±0.32 0.96±0.18 1.41±0.32 End-bedrest 2.01±0.15 -8.68±8.14 3.62±0.15 1.53±0.07* Post-bedrest 2.44±0.19 1.52±0.18A -5.12±7.18 -13.88±9.88 3.87±0.16 3.57±0.17 1.22±0.18 1.95±0.08^ HR baroreflex Pre-bedrest -0.51±0.24 -0.12±0.11 -0.19±0.14 -0.53±0.13 0.31±0.29 0.48±0.22 1.32±0.13 1.13±0.32 End-bedrest -0.72±0.22* -0.38±0.10 0.37±0.15 1.47±0.11 Post-bedrest -0.16±0.14 -0.98±0.07*A -0.41±0.09 -1.30±0.37 0.61±0.11 0.53±0.13* 1.12±0.11 1.86±0.15^ ILV->ABP Pre-bedrest 2.05±0.31 1.22±0.56 8.05±10.07 9.52±9.49 3.58±0.29 2.89±0.47 1.78±0.10 1.52±0.03 End-bedrest 1.93±0.10 6.78±4.31 3.13±0.14 1.67±0.08 Post-bedrest 1.86±0.17 1.87±0.21 -2.68±4.23 11.78±9.88 3.23±0.12* 3.82±0.10A 1.89±0.08 2.35±0.05^
Circulatory Mechanics Pre-bedrest 4.06±0.07 3.48±0.21^ 20.45±2.50 12.33±0.70 2.96±0.11 2.52±0.00 -0.66±0.07 -0.44±0.14
End-bedrest 3.87±0.08 14.53±1.27 2.61±0.12 -0.80±0.09
4 CSI
Calculation of Smyth's Baroreflex Sensitivity
Heart rate baroreflex sensitivity has been demonstrated to be a useful prognostic indicator of various cardiovascular diseases. Current methods to assess the heart rate baroreflex sensitivity,
however, are not only difficult to obtain, but also require invasive and difficult to administer
pharmacological or mechanical interventions. A joint study was therefore initiated with Dr. Ernst Raeder of the Veterans Affairs Medical Center NYC with the objective of creating algorithms to estimate a quantitative measure of heart-rate baroreflex sensitivity from noninvasive
Cardiovascular System Identification methods with the eventual goal of supplanting current
protocols.
4.1 Introduction to Heart Rate Baroreflex Sensitivity
The heart rate baroreflex is a common cardiovascular reflex that plays an important role in the beat-by-beat homeostatic regulation of arterial blood pressure in the presence of
cardiovascular perturbations. The feedback arm of this reflex is comprised of pressoreceptors in the carotid sinus and aortic arch that are activated by changes in arterial blood pressure. These pressoreceptors activate the glossopharyngeal nerve, increasing vagal stimulation to mediate changes in heart rate. Decreases in arterial blood pressure lead to a compensatory increase in heart rate that then increases cardiac output, restoring arterial blood pressure towards homeostatic norms. In contrast, increases in arterial blood pressure result in reflex decreases in heart rate and a subsequent reduction of arterial blood pressure (Handbook of Physiology, 755).
In terms of short-term cardiovascular regulation, the heart rate baroreflex plays several important roles, including maintaining sufficient arterial blood pressure during postural changes from supine to standing positions that might otherwise lead to syncope (Handbook of Physiology,
755). In addition, the heart rate baroreflex has also been found to be an important clinical
prognostic indicator of cardiovascular health, especially in patients after myocardial infarction
and those with congestive heart failure (Rea 1990, Bigger 1989, Billmanl982).
Historically, a number of techniques have been established to quantify the heart-rate
baroreflex. These include: 1) electrical stimulation of the carotid sinus nerves; 2) the use of
pressurized neck chambers to vary the transmural pressure across the carotid sinuses and hence
the vascular diameter, stimulating the carotid baroreceptors; and 3) the injection of vasoactive drugs to vary arterial blood pressure. Each of these techniques, however, has various advantages and disadvantages. For example, while electrical stimulation of the carotid sinus nerves permits for repeatable stimuli, it artificially activates the carotid sensors because activation occurs away
from the normal site of the pressoreceptors. Similarly, in the case of neck chambers, the disadvantages include difficulty of use, an inability to stimulate the aortic baroreceptors, and subject awareness of stimuli that may result in unwanted autonomic influences. Because of these
disadvantages, the use of vasoactives such as angiotensin and phenylephrine to vary vessel diameters and hence blood pressures has become popular in the calculation of heart-rate baroreflex (Handbook of Physiology, 755).
Smyth et al. was the first to introduce a quantitative measure of heart rate baroreflex
sensitivity using intravenous administration of the peripheral vasoconstrictor, phenylephrine, to
induce a transient increase in arterial blood pressure above steady-state levels. Figure 4-1 plots a typical pressure response to phenylephrine. In Smyth's protocol, he defined the heart-rate baroreflex sensitivity, Phe-BRS, as the slope of a linear least squares regression of R-R intervals
with the preceding value of systolic blood pressure (SBP). The choice of regression variables and sample delay was empirically determined. Other potential regression variables, such as pulse pressure or diastolic pressure were found to have less statistical correlation.
Arterial Blood Pressure
Injection
100
I 20 10 40 50 60 70 sec HeartRate 00 1r2 4 I 27 7 0A V * A sAte 60 -V
0020
3040
s0o6 70Figure 4-1. Typical arterial blood pressure response to phenylephrine. Heart rate is reduced in compensation to drive arterial blood pressure back to steady-state values.
Unfortunately, Smyth's protocol suffers from several drawbacks. First, Phe-BRS requires intravenous injections, which limits its ease-of-use and widespread clinical adoption. Second, Phe-BRS is not capable of distinguishing or isolating the feedback mechanism of arterial blood pressure on heart rate from the feedfoward effect of heart rate on blood pressure. Third, Phe-BRS has limited reproducibility due to several factors including: 1) Difficulties in identifying
the exact beginning of phenylephrine-induced changes in blood pressure from normal alterations in pressure and 2) Natural variations in the central influence that modulate baroreflex behavior
(Handbook of Physiology 759). While some of the influences comprising the third factor may be
4.2 Experimental Protocol
This study examined 13 healthy normotensive human patients at the Department of Veterans Affairs Medical Center using a concatenated protocol which consisted of the CSI protocol as outlined by Mullen immediately followed by the phenylephrine protocol as described by Smyth. For the Smyth protocol, multiple serially graded doses of phenylephrine injections were repeated. For each subject, therefore, two sets of data were acquired, a CSI data set and a phenylephrine data set. For both protocols, ECG, ABP, and ILV were digitally recorded onto a personal computer at 360 Hz via a single lead surface electrocardiograph, Finapres 2300, and
Respitrace, respectively.
4.3 Calculating Smyth's Baroreflex Sensitivity
For each subject, every region of data that exhibited an ABP(t) increase of at least 25 mmHg for at least 20 seconds was selected for analysis. These conditions were chosen to reflect
those observed by Smyth et al. The same portion of each pressure response, e.g., the 20-30
second rise in ABP(t) from the beginning of the response to the peak pressure was selected for analysis. Before analysis, all SBP[n] and R-R[n] data points within this response with values greater than or less than two standard deviations from their respective means were considered outliers and omitted from further analysis. For each valid data segment, the beat-by-beat systolic
pressures were linearly regressed against the successive value of R-R interval using the method of
least squares. The slope of this regression line then provided the heart-rate baroreflex sensitivity,
Phe-BRS. Least-squares regressions with p-values greater than 0.05 were omitted from further
In Smyth's original analysis, he noticed that Phe-BRS was dependant on the respiratory cycle, with a larger value during expiration than inspiration. One potential explanation is the activation of Po2 and Pco2 chemoreceptors on heart-rate control. Other theories suggest that, "central structures involved in breathing rhythmicity interfere with the integrating mechanisms of the baroreceptor-heart rate control" (Handbook of Physiology). The regression analysis was therefore performed twice, once regressing over all data points in a pressure response, Phe-BRSali, and once regressing over only those data points that began or occurred during expiration, Phe-BRSex. Figure 4-2 plots a typical regression.
Phe-BRSX and Phe-BRSall for Subject 13
1100
Phe-BRS.A: Slope. 2.5 ms/mm'-lg p-value - 2.61e-6
1050- Phe-BRS : Slope . 3.4 ms/mmHg p-value . 1.45e-6
1000-* 0* - 900-0 r5 -) -0 800-75 1 J.-( 160 165 170 175 180 185 190 195 200 205 210 Systolic Blood Pressure[n] (mmHg)
Figure 4-2. Phe-BRS.11 (blue filled points + red empty points) and Phe-BRSe, (blue filled points) for subject 13. The red dashed line corresponds to the Phe-BRS.11 regression. The blue solid line corresponds to the Phe-BRS,,
To calculate a representative Phe-BRSan and Phe-BRSex for each subject, all valid pressure
responses recorded for each subject were analyzed and the results averaged. For each subject,
Phe-BRSs greater than or less than two standard deviations from their respective means were considered outliers and omitted from the average. Figure 4-3 plots the average Phe-BRS - two
standard deviations for each subject.
Phe-BRS ex and Phe-BRSal for all Subjects 40 r 35 F -.30 E U25 Cn 20 CL 15 10 ca 0 -5
4
9 C,4)'
'4 A C. :4 I I I I I I I I I ' I 11 12 13 14 15 17 18 Subject 3 5 6 7 8 9Figure 4-3. For each subject, the mean Phe-BRSa.i (red Phe-BRS,, (blue filled circles) are plotted along with standard deviations.
empty circles) and
the range of two
Note that for some subjects, it was not possible to calculate one or both of their Phe-BRSs either because analyzable pressure response data did not exist or because the linear regressions resulted in p-values greater than 0.05. In addition, note that Phe-BRSan did not statistically differ from
BRSex. Because of this, future analysis ignored the effects of the respiratory cycle on Phe-BRS and used Phe-Phe-BRSu for all future comparisons.
4.4
CSI Results
Using the CSI data set for each subject, CSI analysis was then subsequently performed for each subject. All protocols and algorithms are outlined in Mullen et al. Figure 4-4 plots the group-averaged CSI results while Table 4-1 summarizes their parameterization.
Table 4-1. CSI results (meanwstderr). N=13 Subjects.
Impulse Response Ln (Peak Amplitude) Area Ln (Absolute Area) Ln (Characteristic Time) ILV-+HR 2.37±0.21 5.49±1.25 3.06±0.19 0.18±0.21
HR Baroreflex -1.18±0.14 -0.29±0.06 -0.52±0.15 1.04±0.06
ILV->ABP 1.65±0.11 0.61±3.45 3.19±0.12 1.68±0.04
ILV-+HR 20- L10- 20-20 4 8 Tinc (scc) ILV 2 0.0 0.1 0.2 0.3 0.4 0.5 Frequency (Hz) ILV-'ABP 12-. 6- 50-2 -6-2 0 5 10 15 Time (sec) 2W - HR M 0.0 0.1 0.2 0.3 0.4 0. Frequency (Hz) , Autonomic Activity (Heart Rate Tachogram)
SA NODE
Atrio-Ventricular Activation (Impulse Heart Rate)
CIRCULATORY MECHANICS 80- 60- 40- 20--20 0.0 0.5 Timksec) 1.5 2.1 NABP 2(W)1 .p 100-0' .0 0-2 . 0.3 0.4 0. Frequency (Hz)
Figure 4-4. Group averaged CSI results.
BAROREFLEX *40.0-S-0.4 0 2 ' 6 8 Time (sec) Arterial Blood Pressure XN
4.5
Calculating Heart-Rate Baroreflex Sensitivity from CSI
Several different approaches to estimate Phe-BRS from CSI analysis were evaluated. In this section, we describe three different approaches and discuss their results.
4.5.1 Method 1
The first method for estimating Phe-BRS from CSI methods is flow-diagrammed in Figure 4-5. First, the portion of the phenylephrine data set corresponding to the pressure ramp
response to phenylephrine is downsampled to 1.5 Hz and the mean removed to create AILVp,1.5(t),
AABPp,1.5(t), and AHR,1.5(t). Using the CSI transfer functions previously calculated, AHRp,1.5(t),
the changes in HRT or autonomic activity that CSI predicts would occur given the ABP ramp and
ILV signal associated with an injection of phenylephrine, can be calculated as the following sum of convolutions:
AHRp,1.S (t) = AILV,1.5 (t * HLv-+HR (t) + AABP,1. (t) * HABP4HR
(
In order to convert this predicted change in HRT into R-R intervals, we adopt the Integral Pulse Frequency Modulation (IPFM) model described by Hyndman and Mohn and summarized in Figure 4-6. IPFM models are especially useful in describing physiological processes that convert a continuous signal into a discrete signal. The input signal, composed of a DC term and a
modulating signal m(t), is integrated over time. Whenever the integrated value y(t) equals a fixed
threshold value I, an event is generated and the integrator is reset to zero. In the absence of a
modulating signal, the output signal x(t) is simply a periodic impulse train with constant intervals equal to I (Boer 1985).
Phenylephrine Ramp Data
ILV ,3(t) ABP,,310(t) ECGP 3,(t)
AILV,13(t) AABP ,1s(t) SBPP [n] RR [n]
CSI Data
AILVLS(t) _CSI H HA-BP-HHR
AABPus(t) AHR15(t) A HR ,,1.5 (t) H I; IPFM lk +1 A 1 = JHR ,,1.s (O dt tim RIZ [n]
Figure 4-5. Block Diagram of Method 1.
rset. 1 +m(t) ..: y(t) x(t) 1 +m(t) time y(t) time x(t) time
Figure 4-6. Diagram of an IPFM model. Reprinted from Boer and