HAL Id: hal-02385938
https://hal.archives-ouvertes.fr/hal-02385938
Submitted on 29 Nov 2019
HAL is a multi-disciplinary open access
archive for the deposit and dissemination of sci-entific research documents, whether they are pub-lished or not. The documents may come from teaching and research institutions in France or abroad, or from public or private research centers.
L’archive ouverte pluridisciplinaire HAL, est destinée au dépôt et à la diffusion de documents scientifiques de niveau recherche, publiés ou non, émanant des établissements d’enseignement et de recherche français ou étrangers, des laboratoires publics ou privés.
Do Bevacizumab solutions interact during an infusion
through implantable venous access ports with silicone or
polyurethane catheters ?
Nicolas Tokhadze, Philip Chennell, Régis Cueff, Valérie Sautou
To cite this version:
Nicolas Tokhadze, Philip Chennell, Régis Cueff, Valérie Sautou. Do Bevacizumab solutions in-teract during an infusion through implantable venous access ports with silicone or polyurethane catheters ?. Journal of the Royal Society Interface, the Royal Society, 2019, 16 (158), pp.20180721. �10.1098/RSIF.2018.0721�. �hal-02385938�
Do Bevacizumab solutions interact during an infusion through implantable
venous access ports with silicone or polyurethane catheters ?
NICOLAS TOKHADZE(1), PHILIP CHENNELL(1)*, REGIS CUEFF(2), VALERIE SAUTOU(1)
(1) UNIVERSITE CLERMONT AUVERGNE, CHU CLERMONT FERRAND, CNRS, SIGMA CLERMONT, ICCF, F-63000 CLERMONT-FERRAND, FRANCE
(2) UNIVERSITE CLERMONT AUVERGNE, CNRS, SIGMA CLERMONT, ICCF, F-63000 CLERMONT– FERRAND, FRANCE
* : corresponding author: [email protected]
DOI : 10.1098/RSIF.2018.0721
Abstract
This work aims to evaluate the possible impact of interactions between bevacizumab solutions and an implantable port equipped with a silicone or a polyurethane catheter after infusion through a complete infusion setup in simulated use conditions.
Physicochemical and structural stability of bevacizumab solution was assessed by: visual examination, subvisible particles counting, dynamic light scattering, size exclusion chromatography and ion exchange chromatography. Mechanical properties of the catheters were evaluated by measuring Shore-A hardness, strain at break, strain at stress and Young’s modulus. The physicochemical surface state of the catheters was assessed by FTIR-ATR spectroscopy, scanning electron microscopy (SEM) and by water contact angle measurement.
Analysis of the bevacizumab solution did not highlight any signs of instability or loss of active substance. Mechanical properties of both materials remained unchanged after the infusion. During material analysis, a decrease of water contact angle observed after infusion and was more pronounced for polyurethane catheters than for silicone’s, possibly due to bevacizumab adsorption or possible leachable extraction from the materials. Surface modifications were also noticed by SEM.
This study did not highlight any modifications that could alter the quality of the bevacizumab infusion, nor of the infusion catheter in polyurethane or silicone, despite a modification of surface hydrophilicity. Even if after a single infusion implantable ports remained safe to use, they aim to be used for several infusion of various drugs during its lifetime, and further studies are needed to assess the impact of repeated infusions.
Keywords
bevacizumab; implantable venous access port; catheter ; stability ; Content-container interactions; interfaces
1.
Introduction
Monoclonal antibodies (mAbs) are therapeutic agents broadly used in the field of oncology (1). It is known that their use for anti-tumor immunotherapy presents current and future opportunities for the treatment of cancers that conventional chemotherapy cannot bring, with fewer adverse effects. MAbs are immunoglobulins (or immunoglobulins fragments), composed of 2 heavy chains around 50 kDa and 2 light chains around 25 kDa, linked by intra or intermolecular interactions building a secondary and a tertiary structure giving the molecule its tridimensional structure (2).
Physicochemical stability and biological activity after reconstitution and dilution of numerous antibodies has already been studied in various containers (rituximab (3), bevacizumab (4,5), infliximab (6), etc.). Their instability can be generated by different factors, including interactions with the surfaces. Those interactions can cause a conformational rearrangement and aggregation (7), altered the immunogenic potential (8) or modify biological activity of the antibody (9). It has been shown that mAbs can interact (adsorption or aggregation) with many surfaces or interfaces, like glass, metallic particles, silica or silicon oils (10–13). Even though polymeric based surfaces (polyvinyl chloride, silicon, polyurethane) are always found in medical devices used for infusion, and that they are known for interacting with small peptides, like cyclosporine or insulin (14–16), their influence upon mAbs stability in clinical situations has not been fully studied. Sorption phenomenon can also be a major concern during the infusion process since the drug lost is not administered to the patient and means a loss of effectiveness of the treatment.
Bevacizumab is an IgG1 mAb anti-Vascular Endothelial Growth Factor (VEGF) mAb in anticancer therapy indicated for the treatment of (in association with other anticancer
drugs): metastatic colorectal cancer, non-small cell lung cancer or breast cancer (17). It was chosen as being representative of most of the therapeutic mAbs, as currently all the therapeutic mAbs are immunoglobulin G (IgG) and mostly from IgG1 subtype (18).
The objective of this study was to quantify bevacizumab and evaluate its physicochemical stability after an contact with polymers during infusion through a complete setup including a polyolefin bag, a PVC infusor and an implantable port equipped with a silicone or a polyurethane catheter in simulated use conditions, and to investigate potential topographic, mechanical and physicochemical material surface modification of the catheters.
2.
Materials and methods
2.1 MaterialsBevacizumab, Avastin 25mg/mL solution for infusion (batch H0191B07, expire on 02/2018) was purchased from Roche (Boulogne-Billancourt, France). Sodium chloride 0.9% IV bags were purchased from Fresenius-Kabi (Louviers, France). Titanium implantable port equipped with a silicone catheter (ref: 0602230CE, batch REAV0473, Expire 08/2021) and a PU catheter (ref: 0605320CE, batch REAU1520, expire 03/2021) were purchased from Bard Access Systems (Salt Lake City, USA). PVC infusion set (ref: A64, batch 4905, expire 11/2020) were purchased from Carefusion (Voisins-le-bretonneux, France).
Sodium sulfate (Na2SO4
)
, disodium phosphate (Na2HPO4)
, sodium azide (NaN3),4-Morpholinoethanesulfonic acid (MES), sodium chloride (NaCl), Guanidine Hydrochloride (GnHCl), Tris hydrochloride (Tris HCl), ammonium carbonate, dithiothreitol (DTT), iodoacetic acid, acetylated trypsin, sodium hydroxide (NaOH), hydrogen chloride (HCl), acetonitrile and trifluoroacetic acid (TFA) were all purchased from Sigma-Aldrich (Saint Quentin Fallavier Cedex, France). All reagents were certified of HPLC grade.
2.1 Study design
In order to simulate the infusion of a bevacizumab solution through an implantable port as it is performed in clinical conditions, an experimental apparatus was built as shown in Figure 1. Bevacizumab solutions were diluted to 4 mg/mL by addition of the vial content (4 mL) into a 100 mL NaCl IV bag and used right after preparation, and were infused through the infusion set and then through the implantable port during two hours at a flow rate of 1 mL/min as recommended for first time infusions of Bevacizumab. The bath water was maintained at
37°C to reproduce the body temperature, and the infusion set was kept just under the water surface by a metal plate, in order to remain at room temperature. Before infusion, the length of the implantable port’s catheter was standardized to 50 cm for both devices.
Bevacizumab solution samples were taken at T0 from the infusion bag, at T20min, 70min and 110min after the infusion set (from the Y withdrawing site of the Huber needle)and at T10min, 60min and 120min at the terminal tip of the catheter. Material samples were collected before any infusion (control) and after a 120 min infusion. A diluent control setup was also performed by infusing a NaCl solution without bevacizumab through silicone and PU catheters. After 120 min, surface and mechanicals properties of control catheters were assessed and compared to material samples collected after contact with bevacizumab.
Figure 1 : schematic representation of the experimental apparatus used to simulate the infusion of bevacizumab in clinical conditions. 1: infusion bag; 2: infusion set; 3: metal panel separating the infusion set and needle from the water; 4: water bath; 5: Y withdrawing site; 6: titanium implantable port; 7 Huber needle; 8: injection silicone membrane; 9: catheter
For both catheters, the whole experimental setup and the analyses performed at the different analytical times were realized in triplicate, except if mentioned otherwise.
2.2 Analyses performed on the bevacizumab solutions
Samples were analyzed in triplicate and diluted with 0.9% NaCl solutions to 0.4 mg/mL before analysis, except for subvisible particles counting, peptide mapping and second derivative Fourier Transform Infrared spectroscopy (SD-FTIR). The analytical methods used in this study were developed and used accordingly to the international guidelines for the characterization of mAbs, and are capable of highlighting changes in antibody structure (See Supplementary material).
2.2.1 Physical stability analysis
2.2.1.1 Visual inspection
The solutions were visually inspected under a white light in front of a matt black panel and a non-glare white panel. Aspect and colour of the solutions were noted, and a screening for visible particles, haziness, or gas development was performed.
2.2.1.2 Turbidimetry
Turbidity was evaluated by measuring the absorbance of the bevacizumab solutions at 320 nm and 350 nm using a spectrophotometer UV/VIS/NIR Jasco V – 670 (Jasco France, Bouguenais, France) equipped with a single monochromator, a deuterium lamp (range 190 - 350nm) and a halogen lamp (range 330 – 2700 nm).The results were analysed using the provided software (Spectra manager II).
An increase in the calculated aggregation index (AI) (Equation 1) compared to the D0 reference is indicative of an increase of samples turbidity.
Equation 1 : Estimation of turbidity by calculation of Aggregation Index (AI). A corresponds to absorbance at specified wavelengths (280 and 350 nm)
An AI value <10 was considered to be acceptable (19,20)
2.2.1.3 Subvisible particles counting
Subvisible particle counting was performed on a HIAC Royco 9703 (Hach Lange, Noisy le Grand, France) equipped with a HRLD 400 EC detector.
For each triplicate, four successive measurements were carried out on a volume of 2 mL, and the first run was discarded.The results were expressed as the number of particles larger 10 µm and 25 µm, per mL of solution.
2.2.1.4 Nanoparticle size determination
Dynamic Light Scattering (DLS) allows the estimation of the size of protein aggregates between 0.3 nm and 10 µm. The particle size is obtained from the variation of intensity of light scattering due to Brownian motion of particles. Particle size was determined on 1 ml of each triplicate in clear glass cells by dynamic light scattering measurements, using a Zetasizer Nano ZS (Malvern Instruments SARL, Orsay Cedex, France). Each sample was automatically screened 3 times. The obtained size distribution was presented by percentage of intensity and must conform to reference (D0) profiles. A variation in size of less than 3 nm of the main
peak’s hydrodynamic radius was considered as being acceptable. In parallel, the apparition of a peak different from bevacizumab main peak for which intensity percentage was superior to 10% was considered as being unacceptable.
2.2.1.5 Size exclusion chromatography (SEC)
Size exclusion chromatography allows the evaluation of monoclonal antibody aggregation or fragmentation.The chromatographic separation was performed by liquid chromatography (LC), using a LC-2010-A HT with integrated controller, pump, autosampler, oven and UV-VIS dectector (Shimadzu Corporation, Marne la Vallée, France). Two LC separation columns TSK - GEL® G3000SWXL columns (7.8 mm x 30 cm x 5 µm, TOSOH Bioscience), purchased from Interchim (Montluçon, France) were used, mounted in series. A sample volume of 100 µl was injected into the system and then eluted using an isocratic flow (Na2SO40.1 M Na2HPO40.1
M and 0.05% m/w NaN3 in water, buffered at pH 7) at a flowrate of 0.6 mL/min, at a set
temperature of 25 ° C. The detection wavelength was set up at 280 nm. Obtained SEC chromatograms must conform to reference (D0) SEC chromatogram (monomer ≥ 97%).
2.2.2 Chemical stability analyses
2.2.2.1 pH and osmolality
pH measurements were made using a SevenMultiTM pH-meter with an InLabTM Micro Pro glass electrode (Mettler-Toledo, Viroflay, France). Osmolality was measured for each solution using an osmometer Model 2020 Osmometer® (Advanced instruments Inc, Radiometer, SAS, Neuilly Plaisance).
pH measurements were considered to be acceptable if they did not vary by more than 1 pH unit from initial measure. Osmolality measurements are to be interpreted with regards to the potential modification of other parameters and for the purpose of this study were considered to be acceptable if they did not vary by more than 10 mosmol/kg from D0 values. 2.2.2.2 Cation exchange chromatography (CEX)
Cation exchange chromatography is used to separate different isoforms of bevacizumab.The chromatographic separation was performed by liquid chromatography (LC), using a LC-2010-AHT with integrated controller, pump, autosampler, oven and UV-VIS dectector (Shimadzu Corporation, Marne la Vallée, France). All analyses were performed on a TSKgel CM-STAT column (4.6 mm x 100 mm x 7 µm, TOSOH Bioscience), purchased from Interchim (Montluçon, France). Buffer A was prepared with 20 mM MES, and buffer B was prepared with 20 mM MES, 0.5 M NaCl. For each buffer the pH was adjusted to 6.5 using 1N NaOH solution. The injected sample volume was of 100 µL and elution parameters were the following: flow rate of 1 mL/min using a gradient composed of 98% of phase A and 2% of phase B reaching 85% phase A and 15% phase B in 30 minutes, then 10 minutes of equilibrium was observed between each analysis. Analysis temperature was set at 35°C. The detection wavelength was set up at 280 nm.
Obtained CEX chromatograms must conform to reference (D0) CEX chromatogram. The
distribution of each ionic variant was expressed in percentage of total area under curve (AUC). Any variation under 3% was considered to be acceptable.
2.2.3 Structural analyses
2.2.3.1 Peptide mapping
Peptide mapping allows the study of bevacizumab’s primary structure. 500 µL of the solution (250 µL for the 2 mg/mL solutions), were denatured with GnHCl (final concentration 6M) in 0,119 M Tris HCl buffer at pH=8.5 and reduced with 2 mM DTT. Denaturation and reduction were performed together for 60 min at 37°C. Samples were then alkylated by 50 mM iodoacetic acid for 15 min at room temperature protected from light. Tris HCl buffer was removed by using a spin filter 10 kDa molecular weight cut-off (Millipore, Molsheim, France). After 20 min centrifugation at 4000 rpm, supernatant was completed up to 3.5 mL with 100 mM ammonium carbonate buffer (pH = 7.6). Spin filters were centrifugated again 20 min at 4000 rpm. The digestion step was performed with an acetylated trypsin ratio 1:20 (Trypsin / bevacizumab, weight/weight) for 14 h overnight at 37°C. Before chromatographic analysis, samples were recovered from digestion step and completed to 400 µL with 0.1% TFA in water. The reaction was quenched by storing samples at 5°C inside the refrigerated autosampler, and 20µL of each sample were injected into the column.
The chromatographic separation was performed by liquid chromatography (LC), using a LC-2030C with integrated controller, pump, autosampler, oven and UV-VIS dectector (Shimadzu Corporation, Marne la Vallée, France). The separation was performed on a C18 Nucleosil column (250 mm x 3 mm, 5 µm, Macherey Nagel, France). Mobile phase was composed of 0.1% TFA in water (phase A) and 0.09% TFA in acetonitrile (phase B). Elution started with a gradient 95% phase A and 5% phase B which was increased up to 60% phase A and 40% phase B in 140 min. The flowrate was set to 1 ml/min and column oven temperature at 40°C. The detection wavelength was set up at 215 nm. A postrun treatment was done by subtracting the chromatogram of the trypsin solution.
Obtained peptide mapping chromatograms must conform to reference (D0) chromatogram.
Minor and unreproducible variations in the peptide mapping profile (eg. slight retention time variations, intensity variations) were considered to be acceptable. Major reproducible differences, like the appearance or disappearance of a peak, were considered to be unacceptable.
2.2.3.2 Second derivative Fourier Transform Infrared Spectroscopy (FTIR)
The secondary structure of bevacizumab was monitored by second derivative FTIR in amide I region (1600 – 1700 cm-1) using an Avatar 320 (Nicolet, Thermo Electron, Courtaboeuf Cedex, France) equipped with a transmission cell with 25 mm BaF2 windows. All acquisitions
were treated with Omnic software. For FTIR analysis, samples of each concentration were concentrated up to 40 mg/mL using a spin filter 10kDa molecular weight cut-off (Millipore, Molsheim, France).
Obtained FT-IR spectra must conform to reference (D0) profiles. A shift in maxima’s and
minima’s wavenumbers inferior to 2 cm-1 was considered to be acceptable.
2.2.3.3 Second derivative UV spectroscopy
Tertiary structure was studied by second derivative UV spectroscopy. All spectrums were acquired on a Spectrophotometer UV/VIS/NIR Jasco V-670 (Jasco France, Bouguenais, France), using 1 cm pathlength quartz cuvettes and the measurement wavelength range was set between 250 and 320 nm. All acquisition data were treated with Spectra manager II software.
Obtained second derivative ultraviolet spectra must conform to reference (D0) spectra. A
shift in maxima’s and minima’s wavelengths inferior to 2 nm was considered to be acceptable.
2.2.3.4 Total protein quantification
Protein content per vial was estimated by measuring absorbance at 280 nm (21) of bevacizumab solutions. All data were acquired on a spectrophotometer UV/VIS/NIR Jasco V-670 (Jasco France, Bouguenais, France), using 1 cm pathlength quartz cuvettes. Protein content was calculated using the Beer-Lambert law.
Protein content was considered to be acceptable when between 95% and 105% of theoretical concentration.
2.3 Analyses performed on the catheters
2.3.1 Mechanical studies
The mechanical characteristics of catheters was determined using a tensile test (MTS 20M) and a hardness durometer. The tensile test was carried out on the tubular medical devices by taking into account the geometry of the samples. The mechanical properties of the catheters were assessed form the stress-strain curves. The Young’s modulus, the stress and strain at break have been evaluated, each value being the result of a minimum of 3 measurements performed each time on each triplicate.
The shore A hardness value determination was performed with an analog testing instrument after a dwell times of 3 seconds.
2.3.2 Surface characterization
The physicochemical properties of a surface may influence interfacial reactions, and its characterization is important in providing information on the chemical structure or through parameters such as the hydrophilic/hydrophobic ratio. Among the number of techniques developed to study surfaces, two common surface characterization techniques for polymers were used: the contact angle measurements and the attenuated total reflectance Fourier transform infrared spectroscopy ATR-FTIR) completed by scanning electron microscopy (SEM).
Contact angle measurements were performed on the catheters to characterize the hydrophilicity/ hydrophobicity behavior of the surfaces before and after infusion of Bevacizumab. The sessile drop method was used: a small drop of deionized water (4µL) was laid down on the surface of the catheters and analyzed with a contact angle measuring system (Krüss Drop Shape Analyzer DSA 14) involving angle measurements in a normal plane. During image analysis, the water contact angle between the baseline of the drop and the tangent at the drop boundary was calculated with the DSA software.
ATR-FTIR measurements were carried out on the surface of catheters using a Nicolet 6700 spectrometer equipped with an ATR device (diamond crystal). Spectra were obtained in the 4000-400 cm-1 region, using 30 scans and 4cm-1 resolution. Before each measurement, a blank spectrum was obtained to eliminate the effect of humidity and carbon dioxide in air.
The surfaces were characterized by SEM using a Zeiss Supra 55 VP (Carl Zeiss SMT, Nanterre, France) scanning electron microscope (SEM) after gold sputtering with secondary emission and SE detector. The accelerating voltage and the working distance were respectively of 1 kV and between 5.5 to 6.5 mm (image dependent). For each studied sample multiple images at magnifications ranging from 1000 to 50000 were taken, representing at least 3 different zones.
2.4 Data analysis – acceptability criteria
The study was conducted following methodological guidelines issued by the International Conference on Harmonisation for stability studies (ICH guidelines for stability (22,23) and specifications for Biotechnological/Biological products (24)), Bardin et al., 2011 (25), the European Pharmacopeia (26) and recommendations issued by the French Society of Clinical Pharmacy (SFPC) and the Evaluation and Research Group on Protection in Controlled Atmosphere (GERPAC) (27) And the French Society and European Society of Oncology Pharmacy (28). NHS recommendations (29) were also taken into account.
3.
Results
3.1 Bevacizumab solutions
3.1.1 Visual inspection
Solutions in the infusion bags were limpid and colorless. During the study, visual aspect remained unchanged at both sampling site (after the infusion set and after the catheter). 3.1.2 Turbidity
Turbidity was assessed by calculating the aggregation index (AI). At T0, AI was respectively 0.50% ± 0.13% and 0.42% ± 0.10 % for the PU and silicone condition (mean ± standard deviation). No variation of more than 0.45% was observed during the study, thus remaining within acceptability criteria.
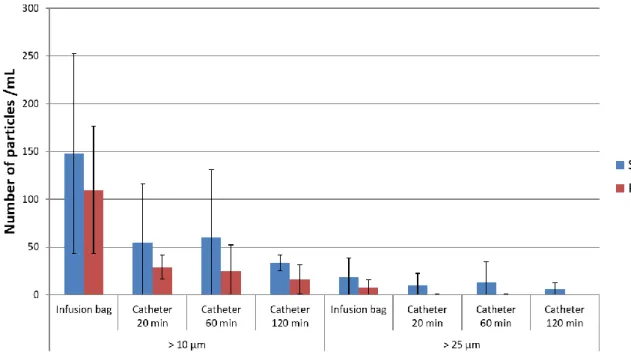
3.1.3 Subvisible particles counting
Counting of subvisible particles superior to 10 µm and 25 µm is presented in Figure 2. A global but not significant decrease overtime was observed for both types of catheters (silicone and polyurethane).
Figure 2 : Number of particles >10µm and >25µm for each material and analytical time (mean ± SD, n=3) 3.1.4 DLS
Nanoparticles size was estimated by DLS. At D0, mean hydrodynamic diameter was of 11.6 ± 2.6 nm, and no variation of more than 0.29 nm was observed during any of the studies, thus remaining within acceptability criteria.
3.1.5 SEC
A separation of different bevacizumab species was performed by SEC (Figure 3). Five products were highlighted, including 3 different high molecular weight products (HMWP) respectively at elution times (e.t) of 16.1 min, 20.6 min and 22.4 min, monomeric form at e.t of 27.4 min and fragments at e.t of 32.9 min. At the initial state, the AUC of the monomeric form represented 97.77% ± 0.34% of total AUC, fragmented form was 0.09% ± 0.08% and HMWP were respectively of 0.29 ± 0.24%, 0.15% ± 0.02 % and 1.69 ± 0.08% (Table 1). Monomer percentage of total AUC did not vary by more than 0.21%. Throughout the study, the monomer quantification met acceptability criteria.
Figure 3 : SEC profile of 0.4 mg/mL bevacizumab solutions after infusion through a polyurethane catheter of an implantable port at each studied time.
Table 1 : Percentage of total AUC of each bevacizumab size variants separated by SEC after infusion through polyurethane (PU) or silicone catheter of an implantable port (mean ± SD, n = 3. Except for infusion bags samples for which n = 6). Material Time (min) HMWP 1 (% of total AUC) HMWP 2 (% of total AUC) HMWP 3 (% of total AUC) Monomer (% of total AUC) Fragment (% of total AUC) Infusion bags 0 0.29 ± 0.24 0.15 ± 0.02 1.69 ± 0.08 97.77 ± 0.34 0.09 ± 0.08 Silicone 20 0.30 ± 0.21 0.15 ± 0.01 1.76 ± 0.18 97.71 ± 0.35 0.08 ± 0.07 Silicone 60 0.16 ± 0.10 0.15 ± 0.03 1.84 ± 0.19 97.79 ± 0.22 0.06 ± 0.07 Silicone 120 0.20 ± 0.12 0.12 ± 0.06 1.63 ± 0.12 97.98 ± 0.12 0.06 ± 0.02 PU 20 0.21 ± 0.01 0.15 ± 0.02 1.94 ± 0.25 97.64 ± 0.32 0.07 ± 0.06 PU 60 0.21 ± 0.06 0.14 ± 0.01 1.86 ± 0.20 97.72 ± 0.25 0.06 ± 0.03 PU 120 0.17 ± 0.05 0.14 ± 0.03 1.77 ± 0.17 97.88 ± 0.16 0.05 ± 0.01 3.1.6 pH/Osmolality
At T0 (bevacizumab solutions in the infusion bags) pH was of 6.26 ± 0.06 and osmolality of 285.25 ± 1.15 mosmol/kg (mean ± SD, n = 6). During the study, for all conditions pH and osmolality remained within acceptability criteria limits, as no variation of more than 0.1 pH unit and 2.0 mosmol/kg was observed.
3.1.7 CEX
At the initial state, 5 variants were detected in the bevacizumab solution. Peak percentages (Table 2) of total AUC at T0 was of 4.04% ± 0.83%, 9.89% ± 0.81%, 9.48% ± 1.20%, 72.96% ±
2.55% and 3.63% ± 0.98% for respectively peaks 1 to 5 (n = 3, mean ± SD). Throughout the study and for both conditions, percentage of total AUC of each peaks never varied by more than ± 1.36% and thus remained within acceptability criteria.
As an example, charge variants separation by CEX of bevacizumab solution infused through the apparatus with a polyurethane catheter sample is presented in Figure 4.
Figure 4 : CEX profile of 0.4 mg/mL bevacizumab solutions after infusion through the polyurethane catheter of an implantable port at each studied time.
Table 2 : Percentage of total AUC of each bevacizumab size variants separated by CEX chromatography after infusion through polyurethane (PU) or silicone catheter of an implantable port (mean ± SD, n=3. Except for infusion bags samples for which n=6). Material Time (min) Peak 1 (% of total AUC) Peak 2 (% of total AUC) Peak 3 (% of total AUC) Peak 4 (% of total AUC) Peak 5 (% of total AUC) Infusion bags 0 4.04 ± 0.83 9.89 ± 0.81 9.48 ± 1.20 72.96 ± 2.55 3.63 ± 0.98 Silicone 20 4.32 ± 0.40 10.09 ± 0.33 9.82 ± 1.05 72.22 ± 1.39 3.55 ± 0.28 Silicone 60 4.31 ± 0.19 10.55 ± 0.53 9.47 ± 0.98 71.88 ± 0.43 3.79 ± 0.22 Silicone 120 4.11 ± 0.40 9.57 ± 0.33 9.57 ± 0.33 71.60 ± 0.82 3.78 ± 0.51 PU 20 4.03 ± 0.72 9.80 ± 0.49 9.60 ± 0.15 73.02 ± 1.00 3.55 ± 0.68 PU 60 3.70 ± 0.53 10.23 ± 0.26 9.48 ± 1.02 72.91 ± 1.48 3.68 ± 0.42 PU 120 3.76 ± 0.55 10.18 ± 0.91 10.18 ± 0.91 72.37 ± 1.96 3.34 ± 0.76
3.1.8 Peptide mapping
The peptide map of bevacizumab samples from every analytical time was acquired and compared to the T0 reference peptide map. No significant variation was highlighted for any condition. As an example, the comparison of the peptide map of bevacizumab solution after 120 min through a PU and silicone catheter is shown in Figure 5 and is consistent with data obtained for the other time points (after 10 min and 60 min infusion through the catheter). The peptide map highlighted no significant variations.
Figure 5 : Comparison between the peptide map of 4 mg/mL bevacizumab solutions after infusion through a polyurethane (PU) catheter at T0 (black) and T120min (blue) and silicone catheter at T0 (brown) and T120min (pink). 3.1.9 Second derivative Infrared Spectroscopy
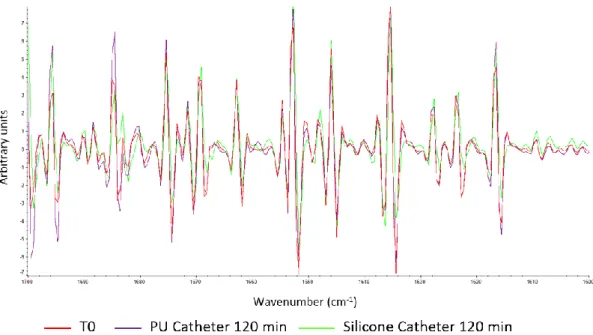
Second derivative FTIR spectra of bevacizumab solutions after a 120 min infusion through PU and silicone catheter are compared to the spectra in the initial state in Figure 6. Maxima and minima of each peak was studied at every analytical time and compared to the initial state reference, none of them is shifted by more than 1 cm-1.
Figure 6 : Comparison between second derivative FTIR spectra (1600 and 1700 cm-1) of 4 mg/mL bevacizumab solutions before infusion (red) and after a 120 min infusion through the polyurethane (PU) catheter (purple) and silicone catheter (green) of an implantable port.
3.1.10 Second derivative UV spectroscopy
Second derivative UV spectra of bevacizumab solutions after a 120 min infusion through PU and silicone catheter are compared to the spectra in the initial state in Figure 7. Maxima and minima of each peak was studied at every analytical time and compared to the initial state reference, none of them shifted by more than 0.4 nm.
Figure 7 : Comparison between second derivative UV spectra (1600 and 1700 cm-1) of 0.4 mg/mL bevacizumab solutions before infusion (red) and after a 120 min infusion through the polyurethane (PU) catheter (blue) and silicone catheter (brown) of an implantable port.
3.1.11 Total protein content
Quantitation of total protein content was performed by measuring absorbance at 280 nm at each analytical time for both conditions. Figure 8 shows the percentage of variation (n = 3; mean ± SD) of the bevacizumab solution after infusion through PU and silicone catheter from solution in the infusion bag before infusion (T0). The observed variation always remain within the 95-105% range.
Total protein content was also assessed in samples withdrawn between the infuser and the implantable port, but no significant variation from T0 was highlighted (data not shown).
Figure 8 : Total protein quantification (n=3, mean± SD) by UV spectroscopy at 280 nm of bevacizumab after infusion through an implantable port equipped with a Polyurethane (PU) catheter (blue) and a silicone catheter (red).
3.2 Polyurethane and silicone catheters
3.2.1 Mechanical properties
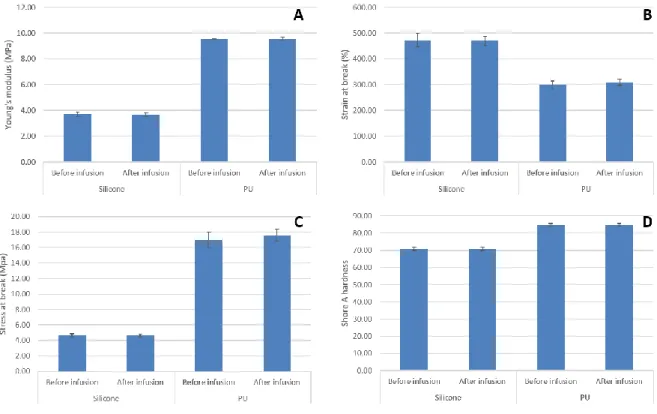
As presented in Figure 9, the mechanical properties of both catheters were not affected by a Bevacizumab infusion or a 0.9% NaCl infusion (supplementary data, figure A). The Young’s modulus (Figure 9-A) of the silicone and PU catheters exhibited means values of about 3.6 and 9.5 MPa respectively. Logically, the strain (Figure 9-B) and stress (Figure 9-C) at break-point of both samples are noticeably different. The three mechanical properties assessed by the tensile test indicate a stiffer and less ductile behavior of the PU medical device compared to the silicone one.
In accordance with the tensile test results, the shore A hardness (Figure 9-D) value measured on the PU medical device is greater than the one obtained for the silicone catheter, a difference of about 20% was noted (85 vs 71 Shore A).
Figure 9 : Mechanical properties (A = Young’s modulus; B = strain at break; C = stress at break; D = Shore A hardness) of polyurethane (PU) and silicone catheters before and after infusion of Bevacizumab (Mean ± 95% confidence interval, n = 3).
3.2.2 Surface characterization
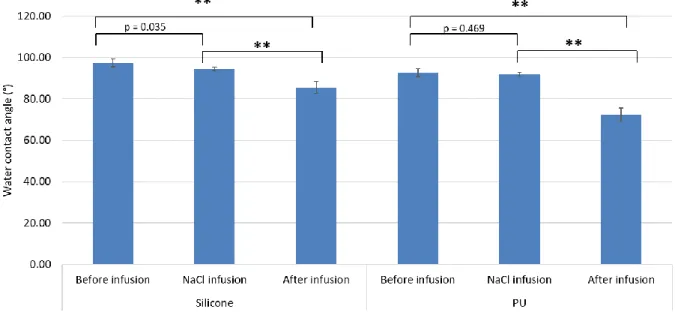
Wettability results presented in Figure 10 show a water contact angle of respectively 94.2° and 97.1° on PU and silicone devices before infusion. No difference in water contact angle was noticed after infusion of a 0.9% NaCl solutions. But, the Bevacizumab infused catheters exhibits lower water contact angle values compared to the control ones. After infusion, a decrease of contact angle was observed for both PU and silicone catheter. However, a statistically significant decrease was more pronounced for PU catheter than for silicone catheter (20° and 12° respectively; t-test, p = 0.041).
Figure 10 : Water contact angle on PU and silicone catheter surfaces before and after infusion of a 0.9% NaCl solution or Bevacizumab solution (mean ± 95% confidence interval, n = 3). T-test between sample before and after infusion (** : p<0.01).
ATR-FTIR spectra presented in Figure 11 and Figure 12 suggest that the surface structure of the medical devices was not altered by infusion of bevacizumab. The spectra collected for the control or the bevacizumab infused catheters are close to identical.
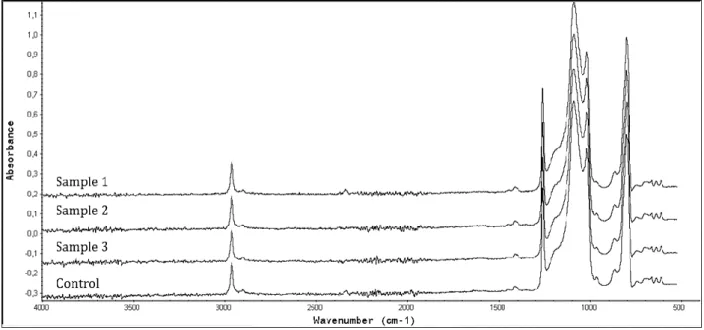
Figure 11 : ATR-FTIR spectra of silicone catheter surface before (control) and after a 2 hours infusion of Bevacizumab (sample 1 to 3).
Figure 12 : ATR-FTIR spectra of PU catheter surface before (control) and after a 2 hours infusion of Bevacizumab (sample 1 to 3).
The FTIR analyses revealed that the investigated PU catheter consists of aromatic polyurethane chains (hard segments) and polycarbonate chains (soft segments). They also suggest that the silicone catheter is mainly based on poly(dimethyl-siloxane).
The FTIR spectroscopy identified barium sulfate (BaSO4) in both catheters (bands located at
1187, 1123, 1078, 987, 638 and 611 cm-1).
An analysis of the inner surface structure of PU and silicone catheter was performed by SEM. Comparison of the surface state before and after infusion for both conditions is shown in Figure 13. The images provided are representative of the surfaces visualized. No modification was observed with silicone samples, but PU samples present a more pleated aspect after the infusion with the bevacizumab solution (Figure 13-F) while it remained unchanged with the NaCl control solution (Figure 13-E).
Figure 13 : SEM images x5000 of a reference silicone catheter (A), a silicone catheter after 0.9% sodium chloride infusion for 120 min (B), a silicone catheter after 4 mg/mL bevacizumab infusion for 120 min (C), a reference PU catheter (D), a PU catheter after 0.9% sodium chloride infusion for 120 min (E) and a PU catheter after 4 mg/mL bevacizumab infusion for 120 min (F).
4.
Discussion
This work evaluated whether the infusion of a bevacizumab solution through an implantable port had an impact or not upon drug stability or caused an alteration of the infusion devices’ properties. After a single infusion, the physicochemical and structural stability of bevacizumab in solution remained unchanged. Material characterization showed expected differences between silicone and PU in terms of rigidity, but none of the material’s mechanical properties were modified by the infusion. However, surface state variations were highlighted by water contact angle measurements and SEM.
Bevacizumab is a mAb from the IgG1 subtype and is therefore representative of most the therapeutic mAbs currently available on the market. It was of interest to assess potential variation in this mAb stability with this type of setup as bevacizumab is likely to be infused via implantable ports and a variation or degradation in the administered dose could alter the efficacy of the therapy. Bevacizumab physicochemical stability was expected to a certain extent, as bags were reconstituted following the manufacturer instructions and were used right after reconstitution. Monoclonal antibodies are known to be stable at 25°C and up to 40°C for several days when in contact with various inert materials like glass vials. However, the impact of different tubing materials on mAb stability has not been well documented. Silicone oil used are known to cause aggregation with monoclonal antibodies, especially with bevacizumab, therefore particles formation was particularly monitored. Our study did not highlight any significant differences between polyurethane and silicone concerning subvisibles particles assessed by light obscuration, but a decrease of subvisibles particles overtime was noticed. Soluble aggregates from the reconstitution step might have been solubilized with time leading to this decrease. Therefore, due to the low volume of solution available for each sample, light obscuration analysis were performed at the technical limit of the machine leading to an important analytical variation between samples. However, this result was confirmed by the aggregation index measurement which remained unchanged along the study. For most monoclonal antibodies, it is recommended to infuse through an
infusion set equipped with a 0.22 µm online filter which is able to limit the amount of particles. DLS was used to assess the hydrodynamic diameter of bevacizumab molecules and no variation from the initial state was noticed at any time. This result is in agreement with the absence of HMWP or fragment observed with the SEC separation, indeed monomeric form remained constant throughout the study. All those analytical techniques indicated that bevacizumab remained physically stable during the infusion time.
Chemical stability was assessed by measuring pH, osmolality and CEX separation in liquid chromatography. CEX chromatography is used to study the different charge variants of bevacizumab. Proportions of each variant were estimated by expressing their respective percentage of total AUC. Throughout the study, variant proportions remained unchanged. Osmolality and pH were measured as they are critical parameters for intravenous injection, but ionic strength and pH variation can also be involved in protein aggregation mechanism (30,31).
To characterize the structural properties, primary, secondary and tertiary structures of bevacizumab were assessed respectively by peptide mapping, SD-FTIR and SD-UV. None of those analyses highlighted any change at any time of the study. This structural analysis was also consistent with the conclusions reached concerning physical and chemical stability, as physicochemical and structural modifications are often related during the degradation process of monoclonal antibodies.
The global amount of bevacizumab was assessed by measuring total protein content, and specific monomeric bevacizumab was quantified by measuring AUC of the monomeric form separated by SEC to provide a more specific information. None of those analytical techniques were able to highlight any variation from the initial concentration in the infusion bags. Sorption phenomena could have decreased the amount of bevacizumab available. Adsorption was the only suspected phenomenon given the steric hindrance of a monoclonal antibody, theoretically excluding absorption. One of the limiting factor when a molecule is adsorbed onto a material is the contact area which reaches a sort of saturation state. However, bevacizumab was infused at a concentration of 4 mg/mL, which is the recommended concentration in clinical use but is a quite high concentration. So even if bevacizumab had adsorbed onto the infusion set or catheter tube, the loss of bevacizumab could have been too small proportionally (when compared to the initial bevacizumab
quantity) to be significant. Based on those results, adsorption of bevacizumab onto PU and silicone catheter can be considered as clinically negligible for the tested conditions and apparatus, but cannot be excluded based only on bevacizumab quantification. The infusion of bevacizumab is safe and the right dose is administered to the patient. For comparison, the infusion bags for Blinatumomab (Blincyto®) administration must be previously prepared before drug dilution using a protective coating solution (polysorbate 80) in order to avoid unacceptable protein adsorption (32). Indeed, as blinatumomab must be administered at a concentration of 0.160 µg/mL, even a slight protein loss due to adsorption would induce a proportionally significant decrease in concentrations, possibly leading to clinical inefficacity.
SEM provided information about the catheter surface state. After a single bevacizumab infusion of 120 min, PU catheters presented a pleated aspect while silicone catheters remained unchanged. This could be explained by topographic surface modifications of the PU surface, perhaps linked to the migration of certain components. Extractibles and leachables are known molecules that could be released in 0.9% NaCl solutions after infusion (33) and this migration could be an alternative explanation to the surface state modification that was observed with the PU catheter. Even though the change in PU surface aspect was not related in any change in mAb stability, a recent study (34) has shown that PU catheters were more prone to thrombotic and infectious complications than silicone catheters. This observation could be compatible with our finding, as the pleated aspect could lead to an increase in surface contact area that could increase the ability of bacteria to fix onto the catheters and thus could facilitate the bacterial proliferation.
The surface pleated aspect of the PU catheter may also possibly be a consequence of a mechanical stress involved by BaSO4 release. Barium sulfate is usually added to the catheter
materials as radio-opaque additive, which is required for any medical products that can be potentially incorporated into patient (35). Other authors reported that the presence of barium sulfate is responsible for cracks and notches observed on the PU catheter surface after incubating periods with chemiotherapy agents (35). They concluded that the BaSO4
particles probably break out the polymer matrix of the incubated PU catheter, dependent from the environment they are flushed away. Verbeke et al. (36) also described that the irregularities observed on PU catheter surface results from the release of BaSO4 and linked
In the absence of any apparent physico-chemical degradation of the investigated PU catheter consecutive to bevacizumab infusion, it cannot be excluded that its surface pleated aspect may be cause by mechanical triggered (BaSO4 release).
Mechanical characteristics were assessed by tensile testing (strain and stress at break) and shore A hardness measurements. Analyses highlighted, as expected, that silicone was more ductile while PU was stiffer but no variation was noticed between catheters before and after infusion.
Wettability results indicated that the surfaces of both catheters before infusion are slightly hydrophobic. Results reported that the bevacizumab infused catheters presented lower water contact angle values compared to the control ones. In both cases, this change in water angle suggests an evolution from a slight hydrophobic behavior to a more hydrophilic character of the catheter surface after infusion of bevacizumab; the effect being more pronounced for PU. Surface state is one of the major point related to the biocompatibility of a medical device. A modification of the hydrophilic or hydrophobic character of a medical device surface could be related to changes in its biocompatibility and even cause adverse effects overtime. A recent study by Tortolano et al. highlighted that during polymer aging some PMMA based ocular lenses could release additives leading to a modification in hydrophilicity of the implants surface and a potential cornea opacification (37). They also highlighted changes in the adhesion of a protein (fibronectin) related to a change in biocompatibility. Other recent studies have shown that the exsudation of antioxidant and ultraviolet light absorbers modified the surface topography, water contact angles and its chemical composition without having a significant impact on cytocompatibility, short-term inflammatory reaction and hemocompatibility while it influenced cell adhesion and possibly bacterial adhesion (38,39). Thus the change of the water contact angle reported in our study seems only to provide qualitative information indicative of a modification of the topography or the surface chemistry of the medical device’s inner surface (possibly linked to the migration of additives), without necessarily having an impact on the biocompatibility or the safety of the device.
Even though adsorption of bevacizumab onto PU and silicon catheters is clinically negligible, it cannot be excluded that such a minor effect may somehow affect the surface wettability, which might partly explain the wetting effect observed.
An additional approach, slightly connected to the reported SEM observations, would involve a possible leachable extraction from PU catheters, which may also be in agreement with the difference in water contact angle evolution reported for the two catheters (i.e. a more wetting effect involved for PU surface). However, such a hypothesis does not in itself explain the change of wettability observed for the silicones surfaces. An alternative explanation can be related to the possibility of BaSO4 release from the catheters, which may
impact its uppermost surface morphology and consequently the water contact angle.
The ATR-FTIR spectra gave an overview of the surface composition, all bands belonging to PU or Silicone whether at initial or final state. No sign of bevacizumab adsorption or of extractible/leachable was highlighted with this analytical technique, certainly due to the low sensibility of ATR-FTIR.
This study assessed differentially the interactions between bevacizumab and an implantable port equipped with PU or silicone catheter. The infusion of a 0.9% NaCl control solution highlighted that material’s surface alteration and difference in wettability were related to the bevacizumab or one of the medication excipient. However, all experiments were performed with unused medical devices. The advantage of our protocol is that is allowed the conditions to be standardized and to test the interaction of the bevacizumab solutions and material in itself, and not be influenced by potential material ageing. In clinical conditions, implantable ports can be used for up to 1 year with multiple drugs. Even if after a single bevacizumab infusion the PU or silicone of the catheter did not seem to be altered, slight modifications were observed and could have a more significant impact after repeated injections. In order to evaluate the clinical impact of long-term clinical use, additional experiments should be conducted, for example using cyclic testing in an identical experimental setup, or on explanted catheters, but to be relevant such a study would have to include many patients in order to take into account the greater sources of variability. Our preliminary results provide information about the initial state of the catheters and could act as a reference for such clinical studies. After a long time implantation, the role of additives like barium sulfate (BaSO4) has been shown, as BaSO4 particles were flushed away from
polymer matrix and supposed to be responsible of notch formation (35). An adsorption phenomenon during repeated infusion could lead to the formation of additional drug layers and a potential aggregation of the monoclonal antibody. Therefore, analytical techniques
employed to characterize the interface between catheters and bevacizumab were not able to highlight directly the sorption process and allowed us only to suggest it. Biological activity was not studied since the usage recommendations were respected. However, in the absence of any physical, chemical or structural modifications, it seems unlikely that the biological activity could have been modified.
5.
Conclusion
Physicochemical and structural properties of bevacizumab in saline solutions were not modified after a simulate infusion through an infusion set connected to a titanium implantable port with silicone or polyurethane catheter. Slight material modifications gave interesting information that suggested a possible sorption effect of bevacizumab upon the PU and silicone infusion tubes. However, overall this effect was very limited and of very unlikely clinical impact.
Competing interest
We have no competing interests
Author’s contribution
NT carried out the lab work, participated in data analysis and drafted the manuscript; PC carried out study design, participated in data analysis and drafted the manuscript; RC carried out material analysis and participated in data analysis, and drafted the manuscript; VS participated in study design making, coordinated the study and helped draft the manuscript. All authors gave final approval for publication
Acknowledgements
The author thank the French Society of Oncology Pharmacy (SFPO) and the French National Academy of Pharmacy for their support in this work.
Data accessibility
The data that supports the findings of this study will be made available by the corresponding author upon request.
Funding
French Society of Oncology Pharmacy (SFPO) and the French National Academy of Pharmacy funded the purchase of bevacizumab vials.
References
1. Chames P, Van Regenmortel M, Weiss E, Baty D. Therapeutic antibodies: successes, limitations and hopes for the future. Br J Pharmacol. 2009 May;157(2):220–33.
2. Wang W, Singh S, Zeng DL, King K, Nema S. Antibody structure, instability, and formulation. J Pharm Sci. 2007 Jan 1;96(1):1–26.
3. Paul M, Vieillard V, Jaccoulet E, Astier A. Long-term stability of diluted solutions of the monoclonal antibody rituximab. Int J Pharm. 2012 Oct 15;436(1–2):282–90.
4. Paul M, Vieillard V, Roumi E, Cauvin A, Despiau MC, Laurent M, et al. Long-term stability of bevacizumab repackaged in 1 mL polypropylene syringes for intravitreal administration. Ann Pharm Fr. 2012 May;70(3):139–54.
5. Signorello L, Pucciarelli S, Bonacucina G, Polzonetti V, Cespi M, Perinelli DR, et al. Quantification, Microbial Contamination, Physico-chemical Stability of Repackaged Bevacizumab Stored Under Different Conditions [Internet]. Current Pharmaceutical Biotechnology. 2014 [cited 2018 Jan 5]. Available from: http://www.eurekaselect.com/122841/article
6. Tokhadze N, Chennell P, Le Basle Y, Sautou V. Stability of infliximab solutions in different temperature and dilution conditions. J Pharm Biomed Anal. 2018 Feb 20;150:386–95.
7. Pinholt C, Hartvig RA, Medlicott NJ, Jorgensen L. The importance of interfaces in protein drug delivery – why is protein adsorption of interest in pharmaceutical formulations? Expert Opin Drug Deliv. 2011 Jul 1;8(7):949–64.
8. Fathallah AM, Chiang M, Mishra A, Kumar S, Xue L, Russell Middaugh C, et al. The Effect of Small Oligomeric Protein Aggregates on the Immunogenicity of Intravenous and Subcutaneous Administered Antibodies. J Pharm Sci. 2015 Nov 1;104(11):3691–702. 9. Bush DB, Knotts TA. Communication: Antibody stability and behavior on surfaces. J
Chem Phys. 2015 Aug 11;143(6):061101.
10. Hoehne M, Samuel F, Dong A, Wurth C, Mahler H-C, Carpenter JF, et al. Adsorption of Monoclonal Antibodies to Glass Microparticles. J Pharm Sci. 2011 Jan 1;100(1):123–32. 11. Bee JS, Chiu D, Sawicki S, Stevenson JL, Chatterjee K, Freund E, et al. Monoclonal
antibody interactions with micro- and nanoparticles: Adsorption, aggregation, and accelerated stress studies. J Pharm Sci. 2009 Sep 1;98(9):3218–38.
12. Basu P, Sampathkumarkrishnan, Thirumangalathu R, Randolph TW, Carpenter JF. IgG1 Aggregation and Particle Formation Induced by Silicone–water Interfaces on Siliconized Borosilicate Glass Beads: A Model for Siliconized Primary Containers. J Pharm Sci. 2013 Mar 1;102(3):852–65.
13. Majumdar S, Ford BM, Mar KD, Sullivan VJ, Ulrich RG, D’souza AJM. Evaluation of the Effect of Syringe Surfaces on Protein Formulations. J Pharm Sci. 2011 Jul 1;100(7):2563– 73.
14. Hacker C, Verbeek M, Schneider H, Steimer W. Falsely elevated cyclosporin and tacrolimus concentrations over prolonged periods of time due to reversible adsorption to central venous catheters. Clin Chim Acta. 2014 Jun;433:62–8.
15. Thompson CD, Vital-Carona J, Faustino EVS. The Effect of Tubing Dwell Time on Insulin Adsorption During Intravenous Insulin Infusions. Diabetes Technol Ther. 2012 Jul 2;14(10):912–6.
16. Ley SC, Ammann J, Herder C, Dickhaus T, Hartmann M, Kindgen-Milles D. Insulin Adsorption to Catheter Materials Used for Intensive Insulin Therapy in Critically Ill Patients: Polyethylene Versus Polyurethane–Possible Cause of Variation in Glucose Control? Open Crit Care Med J. 2014;7:1–6.
17. Kazazi-Hyseni F, Beijnen JH, Schellens JHM. Bevacizumab. The Oncologist. 2010 Aug;15(8):819–25.
18. Ryman JT, Meibohm B. Pharmacokinetics of Monoclonal Antibodies. CPT Pharmacomet Syst Pharmacol. 2017 Sep;6(9):576–88.
19. Katayama DS, Nayar R, Chou DK, Campos J, Cooper J, Vander Velde DG, et al. Solution behavior of a novel type 1 interferon, interferon-τ. J Pharm Sci. 2005 Dec 1;94(12):2703–15.
20. Hawe A, Kasper JC, Friess W, Jiskoot W. Structural properties of monoclonal antibody aggregates induced by freeze–thawing and thermal stress. Eur J Pharm Sci. 2009 Sep 10;38(2):79–87.
21. European Pharmacopeia 8th edition. Total protein. 2008 Jan;Method 2.5.33.
22. International Council of Harmonization (ICH). Quality Guidelines : ICH. Guidelines for stability Q1A to Q1f [Internet]. [cited 2017 Jan 4]. Available from: http://www.ich.org/products/guidelines/%20quality/article/quality-guidelines.html 23. ICH Q5C : quality of biotechnological products : Stability testing of
biotechnological/biological products [Internet]. 1995 [cited 2017 Apr 4]. Available from: http://www.ich.org/products/guidelines/quality/quality-single/article/stability-testing-of-biotechnologicalbiological-products.html
24. International Council of Harmonization (ICH). Quality Guidelines : ICH. Guidelines Q6B : Specifications : Test procedures and Acceptance Criteria for Biotechnological.Biological
Products. [Internet]. [cited 2017 Jan 4]. Available from: http://www.ich.org/products/guidelines/%20quality/article/quality-guidelines.html 25. Bardin C, Astier A, Vulto A, Sewell G, Vigneron J, Trittler R, et al. Guidelines for the
practical stability studies of anticancer drugs: A European consensus conference. Ann Pharm Fr. 2011 Jul;69(4):221–31.
26. European Pharmacopeia. 8.8. 2013.
27. French Society of Clinical Pharmacy (SFPC), Evaluation and Research Group on Protection in Controlled Atmospher (GERPAC). Methodological guidelines for stability studies of pharmaceutical preparations [Internet]. 2013. Available from: http://www.gerpac.eu/IMG/pdf/guide_stabilite_anglais.pdf
28. Vigneron J, Astier A, Trittler R, Hecq JD, Daouphars M, Larsson I, et al. SFPO and ESOP recommendations for the practical stability of anticancer drugs: An update. Ann Pharm Fr. 2013 Nov;71(6):376–89.
29. Santillo M, Aiyalu S, Austin P. A Standard Protocol for Deriving and Assessment of Stability Part 2 – mAbstalk.com [Internet]. 2015 [cited 2017 Mar 21]. Available from: http://mabstalk.com/a-standard-protocol-for-deriving-and-assessment-of-stability-part-2/
30. Wang W, Nema S, Teagarden D. Protein aggregation—Pathways and influencing factors. Int J Pharm. 2010 May 10;390(2):89–99.
31. Chi EY, Krishnan S, Randolph TW, Carpenter JF. Physical Stability of Proteins in Aqueous Solution: Mechanism and Driving Forces in Nonnative Protein Aggregation. Pharm Res. 2003 Sep 1;20(9):1325–36.
32. Summary of products characteristics : BLINCYTO [Internet]. [cited 2018 Jun 29].
Available from:
http://www.ema.europa.eu/ema/index.jsp?curl=pages/medicines/human/medicines/0 03731/human_med_001921.jsp&mid=WC0b01ac058001d124
33. Chang JY, Xiao NJ, Zhu M, Zhang J, Hoff E, Russell SJ, et al. Leachables from Saline-Containing IV Bags Can Alter Therapeutic Protein Properties. Pharm Res. 2010 Nov 1;27(11):2402–13.
34. Wildgruber M, Lueg C, Borgmeyer S, Karimov I, Braun U, Kiechle M, et al. Polyurethane versus silicone catheters for central venous port devices implanted at the forearm. Eur J Cancer. 2016 May 1;59:113–24.
35. Braun U, Lorenz E, Weimann C, Sturm H, Karimov I, Ettl J, et al. Mechanic and surface properties of central-venous port catheters after removal: A comparison of polyurethane and silicon rubber materials. J Mech Behav Biomed Mater. 2016 Dec 1;64:281–91.
36. Verbeke F, Haug U, Dhondt A, Beck W, Schnell A, Dietrich R, et al. The role of polymer surface degradation and barium sulphate release in the pathogenesis of catheter-related infection. Nephrol Dial Transplant. 2010 Apr 1;25(4):1207–13.
37. Tortolano L, Saunier J, Hammami S, Manerlax K, Matmati H, Do B, et al. Restructuration kinetics of amphiphilic intraocular lenses during aging. Colloids Surf B Biointerfaces. 2018 Jan 1;161:420–32.
38. Saunier J, Herry J-M, Marlière C, Renault M, Bellon-Fontaine M-N, Yagoubi N. Modification of the bacterial adhesion of Staphylococcus aureus by antioxidant blooming on polyurethane films. Mater Sci Eng C. 2015 Nov 1;56:522–31.
39. Nouman M, Jubeli E, Saunier J, Yagoubi N. Exudation of additives to the surface of medical devices: impact on biocompatibility in the case of polyurethane used in implantable catheters. J Biomed Mater Res A. 2016;104(12):2954–67.