LCA Methodologoy with Case Study
Speciality Chemicals
Production of Fine and Speciality Chemicals:
Procedure for the Estimation of LCIs
Georg Geisler 1", T h o m a s B. Hofstetter 2 and Konrad Hungerbiihler 1
1 Swiss Federal Institute of Technology, Safety and Environmental Technology Group, ETH H6nggerberg, CH-8093 Ziirich, Switzerland 2 Swiss Federal Institute of Environmental Science and Technology (EAWAG), Department of Water Resources and Drinking Water,
CH-8600 Diibendorf, Switzerland
* Corresponding author ([email protected])
DOh htto://dx.doi.orcdl 0 . 1 0 6 5 / I c a 2 0 0 3 . 1 0 . 1 3 9
Abstract
Goal, Scope, Background. To improve the environmental per- formance of chemical products or services, especially via com- parisons of chemical products, LCA is a suitable evaluation method. However, no procedure to obtain comprehensive LCI- data on the production of fine and speciality chemicals is avail- able to date, and information on such production processes is scarce. Thus, a procedure was developed for the estimation of LCIs of chemical production process-steps, which relies on only a small amount of input data.
Methods. A generic input-output scheme of chemical production process-steps was set up, and equations to calculate inputs and outputs were established. For most parameters in the resulting esti- mation procedure, default values were derived from on-site data on chemical production processes and from heuristics. Uncertain- ties in the estimated default values were reflected as best-case and worst-case scenarios. The procedure was applied to a case study comparing the production of two active ingredients used for crop protection. Verification and a sensitivity analysis were carried out.
Results and Discussion. It was found that the impacts from the
mass and energy flows estimated by the procedure represent a significant share of the impacts assessed in the case study. In a verification, LCI-data from existing processes yielded results within the range of the estimated best-case and worst-case sce- narios. Note that verification data could not be obtained for all process steps. From the verification results, it was inferred that mass and energy flows of existing processes for the production of fine and speciality chemicals correspond more frequently to the estimated best-case than to the worst-case scenario. In the sensitivity analysis, solvent demand was found to be the most crucial parameter in the environmental performance of the chemical production processes assessed.
Conclusion. Mass and energy flows in LCIs of production proc- esses for fine and speciality chemicals should not be neglected, even if only little information on a process is available. The estimation procedure described here helps to overcome lacking information in a transparent, consistent way.
Recommendations and Outlook. Additional verifications and a more detailed estimation of the default parameters are desirable to learn more about the accuracy of the estimation procedure. The procedure should also be applied to case studies to gain insight into the usefulness of the estimation results in different decision-making contexts.
Keywords: Chemical production process; estimation; fine chemi- cals; life cycle inventory analysis (LCI); product comparison; speciality chemicals
Introduction
To improve the overall environmental performance of chemi- cal products and services, an environmental assessment of chemical substances with a life cycle perspective is useful. LCA is a suitable assessment method for this purpose. How- ever, there is a lack of LCI-data on the production of chemi- cals. While some LCI-databases provide data on the pro- duction of basic chemicals, plastics and detergents [1-4], hardly any data are available for fine and speciality chemi- cals. This lack of data is especially pressing for ecological product comparisons among active substances, e.g. for crop protection, or among such speciality chemicals as dyestuffs. The production of modern chemical products generally fol- lows a multistep synthesis with dozens of products from sev- eral suppliers involved. Mass and energy flows gathered in existing LCIs of chemical production processes comprise inputs of substrates, auxiliary materials, solvents, utilities including energy carriers, cooling water, and inert gas, as well as outputs of wastes, energy, valuable side or coupled products, and emissions to air and water. J6dicke et al. [5] found catalyst production to contribute significantly to the environmental impacts, while impacts from catalyst use were not assessed in other studies [6,7]. Infrastructure is com- monly neglected as well [1,2,5]. Due to the confidentiality of mass and energy balances, it is often impossible to ac- quire data for chemical production processes directly from chemical producers. If on-site data for the production of fine and speciality chemicals can be obtained, uncertainty is still high for the following reasons: (1) To achieve minimum procurement costs, chemical producers frequently change the supplier of a substrate. This leads to variabilities in the LCI because different suppliers may use different processes for chemical production or may achieve different process efficiencies. (2) Fine and speciality chemicals are normally manufactured campaign-wise in multipurpouse batch plants, where tens of different products are produced at different times in one building. Material and energy flows in these plants are measured only on a building level. Accordingly, the allocation of the flows to a specific product is often highly uncertain [8]. (3) Up to half of the energy demands in batch production are infrastructure-dependent and thus site-spe- cific [8,9]. This again leads to uncertainties due to the lack of site-dependent data. The uncertainties mentioned above do not apply for basic chemicals, because basic chemicals are produced continuously in mono-product plants. For the
IntJ LCA 9 (2) 101 - 113 (2004)
9 e c o m e d publishers, D-86899 Landsberg, Germany and Ft. Worth/TX 9 Tokyo 9 Mumbai 9 Seout 9 Melbourne 9 Paris
Speciality Chemicals
LCA Methodology with Case Study
production of basic chemicals, LCIs may be derived from the literature. However, information on production processes of fine and speciality chemicals is scarce. These processes are normally not even published in patents, as total secrecy is con- sidered the safest manner of know-how protection. In the most important public data source remaining, Ullmann's encyclo- pedia of industrial chemistry [10], reaction stoichiometry is in most cases accompanied by only a few comments on process operations, while energy or solvent demands as well as gen- eration of wastes and emissions are not discussed.
Existing frameworks for the modelling of inventory data use a range of methods from rules of thumb to process simu- lation. Bretz and Frankhauser [11] take into account all flows mentioned above. They use process databases and expert knowledge and estimate default mass and energy flows as- sociated with end-of-pipe services, combustion of energy carriers, and standard operations in chemical industry. For processes with no information available at all, only the mass flows of starting materials according to reaction stoichiom- etry are taken into account. Unfortunately, this comprehen- sive methodology is not generally applicable to LCA-stud- ies, as it relies on confidential data for most process databases and default values. Furthermore, estimations rely rather on expertise than on transparent rules. Jimenez-Gonzales et al. [7] proposed a method to model inventories based on proc- ess flowsheets, thermodynamical calculations for energy balancing, and rules of thumb. Auxiliary materials are not discussed. Authors evaluating single production processes or end-of-pipe technologies in chemical industry frequently resort to process simulation to estimate material and energy flows [6,12,13]. Emission estimation based on specific unit operations and process flowsheets was used for LCA by Shonnard and Hiew [12]. All of the above-mentioned meth- ods are highly process-specific and require comprehensive process descriptions as input. Such information may be found in literature for the production of basic chemicals, but is generally not available concerning fine and speciality chemi- cals. Therefore, no applicable method is available to model LCIs of fine and speciality chemical production.
In this study, we developed a procedure for the estimation of comprehensive LCIs of fine and speciality chemicals' produc- tion. In order to be operational, the procedure relies on the information obtainable from literature, i.e. the reaction equa- tions and only few, important process characteristics. To be com- prehensive, it yields approximations for the relevant mass and energy flows involved in the production processes. These flows include inputs of substrates, auxiliary materials, solvents, utili- ties including energy carriers, cooling water; and inert gas, as well as outputs of wastes, energy, side or coupled products, and emissions to ak. Default estimates of all parameters, mass and energy flows are suggested to compensate for missing informa- tion. The uncertaInties of these estimations are assessed in a best-case and a worst-case scenario for each production proc- ess. N o most probable value is given, because there is no basis for such an interpolation at the current state of research. The procedure set up enables the use of LCA in the environmental assessment of chemical products. Especially, it allows product comparisons of chemicals with mulfistep synthesis on a coher- ent basis. In this article, the structure and parameterisation of such an estimation procedure is described. The procedures' ap-
plicability is illustrated by a case study comparing the produc- tion of two active ingredients used for crop protection.
1 Structure of the Estimation Procedure
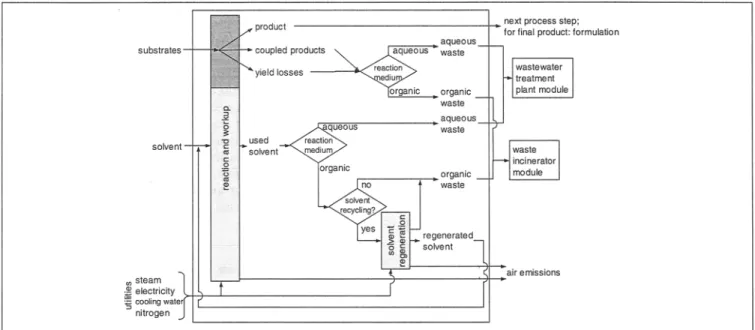
In order to estimate LCIs of processes for fine and speciality chemicals' production, a generic input-output scheme for single process steps in such LCIs was developed. Methods to calculate the input and output masses per kg of product output from such process steps were established. Input parameters were di- vided into those that can be obtained from literature and those that need to be provided by default estimates, taking into ac- count the lack of process-specific data (see Introduction). The system boundary for the LCI of a generic chemical pro- duction process-step was established following Heinzle et al. [14], adapted for the aims of this work. The resulting input-output scheme (Fig. 1) shows two separate groups of unit operations within the system boundary, as well as basic process characteristics influencing the inputs and outputs. In the reaction and w o r k u p unit operations, the substrates are converted partially to products, coupled and side prod- ucts, while a fraction of the substrates remains due to in- complete conversion. The product is recovered and purified and leaves the generic production process step ready for use in the next process step. For the final product, further op- erations are necessary, such as formulation. These are not considered in this procedure. The sum of the output masses of side products and unreacted substrates is taken into ac- count as yield losses. These yield losses as well as coupled products are considered as waste, because their recovery is scarcely economically feasible in the campaign-wise and batch-wise production of fine and speciality chemicals. Re- garding the scarce number of cases where allocation between multiple valuable products may be necessary, we propose allocating on the basis of mass flows or stoichiometry, as discussed by Boustead [1]. Coupled products and yield losses may be dissolved in organic or aqueous phases depending on the solvents and w o r k u p operations used in the process step. In this estimation procedure, coupled products and yield losses are assumed to leave the process step with the solvent used in the reaction. In the case of an aqueous reaction me- dium, water is used as a solvent and no solvent recycling is assumed. Water and the dissolved coupled products and yield losses are assumed to be disposed of in the wastewater treat- ment plant. In chemical industry, only wastewater streams loaded with contaminants of low toxicity and sufficient bio- degradability are sent directly to the wastewater treatment plant [15]. If wastewater does not fulfil these conditions, it is treated by processes assuring the complete destruction of contaminants, such as waste incineration. Hence, emissions from wastewater treatment are sufficiently inventoried with sum parameters such as Total Organic Carbon (TOC) and Total Nitrogen (Ntot). Calculation of pollutant loads of wastewater, expressed in these sum parameters, is necessary to assess the environmental impacts of the treatment of aque- ous wastes in a wastewater treatment plant module. To cal- culate such loads for the unspecified yield losses, the sum formulas of the substrates can be used for extrapolation of the elementary composition. Hischier et al. [16] give further guidelines for the calculation of wastewater pollutant loads.
LCA Methodology with Case Study
Speciality Chemicals
Fig. 1: Input-output scheme for the LCI of a generic process step for the production of fine and speciality chemicals. Groups of unit operations are indicated with light grey shading, the region of mass balance determined by stoichiometry and yield with dark grey shading
In the case of an organic reaction medium, organic solvents are used, and these solvents may be regenerated. All regen- erated solvent is assumed to be recycled to the same process step. Wastes from solvent regeneration comprise waste sol- vent, coupled products and yield losses, and they are dis- posed of in the waste incineration unit.
The LCI of any chemical product comprises a sequence of reactions used to synthesise the final product. In the estima- tion procedure lined out here, each reaction is assumed to be carried out in its o w n process step as long as no other information is available from the literature. This is a simpli- fication. In reality, consecutive reactions may be carried out in the same process step, depending on the implementation
of a reaction sequence in the chemical industry. In such cases, utility inputs for w o r k u p may decrease because the product does not need to be isolated. In highly efficient processes, the same solvent may be used for consecutive process steps. These increases of efficiency may lead to an overestimation of the environmental impacts of process steps by the estima- tion procedure described here (see also Section 3).
The following equations enable the calculation of all input and output masses shown in Fig. 1 per kg of product out- put. Inputs and outputs of substrates, product, coupled prod- ucts and yield losses are calculated from the stoichiometric mass balance of the reaction and an overall yield of the proc- ess step. Symbols and indices are listed in Table 1.
Table 1: Symbols and indices used in the equations S y m b o l m n V M X ksolvent frecycle femission Ntot TOC I n d e x i J Product Substrate Coupled Yield loss Fresh solvent Total solvent Waste solvent Total waste Emission Description Mass Number of moles Stoichiometric coefficient Molar mass Yield
Number of solvents used in the process step
Solvent recycle factor (mass fraction of total solvent mass that is recycled)
Emission factor (fraction of any substances' mass in the process step that is emitted to air) Total Nitrogen content of aquatic phases
Total Organic Carbon content of aquatic phases
::Unit
Description,
...
Substance i Solvent j
Reaction product, output of the process step
Starting materials are used according to stoichiometry and yield Coupled products are formed according to stoichiometry and yield Substrates not converted, as well as side products, both unspecified Fresh input of a single solvent to the process step
Total amount of a single solvent in the process step
Output of used solvent from the process step to the waste treatment Total waste output from the process step
Air emissions originating directly from the process step
kg kmol kg/kmol kgN/kgproduct kgc/kgproduct Int J LCA 9 (2) 2004
103
Speciality Chemicals
LCA Methodology with Case Study
Stoichiometric coefficients are chosen so that v-~oauct = 1 and the number of moles of product generatedVis set to 1 kmol. The number of moles (ni) for any substrate or cou- pled product is then obtained from
rl i = V i 9 rlproduc t (1)
where v i is the stoichiometric coefficient of substrate or cou- pled product. The input masses of all substrates, normalised on the product output, are calculated as:
msubstrate,i _ nsubstrate,i" Msubstrate,i
mproduci nproduc t 9 Mproduc t 9 X
(2)
w h e r e msubstrate, i is the input mass of substrate i in kg, M is the molar mass of substrate or product in kg/kmole and X is the overall yield of the reaction and workup (dimensionless). In the same group of unit operations, products are recov- ered and purified and any waste pre-treatment is carried out. The product is then ready for further use. The normal- ised output mass of coupled products ismcoupted,i ncoupled,i " Mcoupled,i
mproduc i - nproduct 9 Mproduc t
(3)
The normalised output mass of yield losses comprises the mass of substrates not converted and the mass of side prod- ucts formed in the reaction:
myield loss 1
D
mproduct mproduct
" ( ~'T/ msubstrate,, -- mproduct -- ~L'i mcoupled,i )
(4)
Solvent demand is independent of reaction stoichiometry. Concerning organic solvents, high solvent recycling rates are normally realised for economic reasons. Hence, the demand of fresh solvent per product output depends strongly on the recycling rate and less on desired concentrations of substrates or products in the solvent. For instance, quality requirements can cause low or even zero recycling rates. The fresh input of a single solvent per p r o d u c t output is calculated as:
mfresh solvent,j
mproduct -- mtotal solvent,j "
(1
- frecycle) (.5) where n~o~l solvent,j, is the total mass of the single solvent j in the process step, in kg/kgprodu~, and fre~ycle is the fraction of total solvent mass that is recycled (solvent recycle factor, dimensionless). More than one solvent may be used in a proc- ess step, and this is taken into account by defining the number of solvents used in the process step (k~olve,t) in Section 2. Air emissions from batch production are dominantly influ- enced by the effectiveness of the installed emission abate- ment equipment. Standard installations are absorbers forwater-soluble emissions and condensers for organic emis- sions, mostly VOC [17]. If this equipment is not efficient enough or the emission of highly toxic substances is expected, waste gas incineration may be used. In this estimation pro- cedure, emission factors calculated as fraction of the mass of each substance in the process step are applied. Substance properties like vapour pressure are not taken into account, because it is assumed that emitted masses depend mostly on the effectiveness of emission abatement installations. The option of waste gas incineration is not modelled in this esti- mation procedure. The emission mass per kg of product o u t p u t (memission ,i) of any substance in the reaction and workup unit operations, as well as in the solvent regenera- tion, is calculated as
memission,i
= mi,process " femission ( 6 ) where mi, process is the mass of substance i in the process step, which corresponds to the input mass for substrates, to the total mass in the process for solvents (mtota I solvent) and to the output mass for products or coupled products;remission
is the emission factor (dimensionless)9 Emission masses of yield losses (see Eq. 4) are neglected because they are small com- pared to emission masses of substrates, products and cou- pled products. For substances which obviously pose no harm to the environment (e.g. water) or which have a very low vapour pressure (e.g. salts), zero emission to air is assumed 9 For substances that display high reactivity with air or water (e.g. anhydrides), the product of this reaction should be con- sidered as emitted substance.The mass of waste solvent generated (mw~st e solvent, j) is equal to the mass of fresh solvent input. The total mass of waste output per mass of product produced is calculated as
mtotal waste 1
m
m product rn prod uct
9 ( ~ i mcoup led,`+ 1 ~ " m waste solvent,j4" myield
loss)
(7)- ~ memission,i- ,52 memission,j
where index i denotes coupled products and index j solvents. Utilities include steam, electricity, cooling water, and nitro- gen. In theory, thermodynamic calculation of heating and cooling demands for reaction and workup is possible via enthalpy [7]. However, in processes for the production of fine and speciality chemicals, up to 60% of the total energy demand is independent of p r o d u c t output [8,9]. This share of the energy demand depends rather on the level of utilisa- tion of production site infrastructure. Thermodynamic cal- culations would therefore underestimate energy demands. Instead, default utility demands per kg of product output or per kg of used solvent regenerated are used here.
The following input data needs to be known to apply the equations above for estimation of the LCI of a process step: stoichiometric coefficients and molar masses of all sub- stances, as well as the reaction medium (aqueous or organic).
L C A M e t h o d o l o g y with C a s e S t u d y S p e c i a l i t y C h e m i c a l s
As is shown below, knowledge on two more process charac- teristics is necessary: the reaction phase (gas or liquid) and the occurrence of m a j o r side products. This information can be o b t a i n e d f r o m g e n e r a l c h e m i c a l process literature [10,18,19], specific encyclopedias [20] and synthesis litera- ture [21]. For the remaining u n k n o w n input data, the esti- mation of default values is described in Section 3. These data include: overall yield, n u m b e r of solvents and total mass of each single solvent used in the process step, solvent recycle factor, emission factor, inputs of steam, electricity, water, a n d nitrogen in reaction and w o r k u p as well as in solvent regeneration, and finally the type of organic solvent used, in case of an organic reaction medium. If additional informa- tion on a production process step can be obtained from lit- erature (e.g. yields, solvent types used), this information should be used instead of the estimated default values.
2 Default Values for Parameters in the Estimation Procedure
Default values were established for all u n k n o w n input data in Eq. 1-7. The uncertainty of the estimated default values was reflected in a best-case and a worst-case scenario. To this end, m i n i m u m and m a x i m u m values for a given param- eter were identified f r o m the on-site data. Minimum and m a x i m u m values were then assigned to the best-case or the worst-case according to the effects on the environmental performance of the process step. Heuristics were used, espe- cially where only little on-site data was available. Default values were chosen such that the results of the best-case and worst-case scenario enclosed 9 0 % of the possible values, according to the a u t h o r s ' judgement. All default values were discussed with experts f r o m the chemical industry.
Three sources of on-site data were available from which the default p a r a m e t e r values were derived. Firstly, on-site data were available on the last t w o process steps in the produc- tion of active substance A
[22],
which is a crop protection agent. This substance w a s also used as a LCA case study (see Section 3). Source[22]
comprises mass flows of prod- uct, substrates, reactants, auxiliary chemicals, catalysts, sol- vents, and wastes, as well as utility demands. Secondly, his- torical d a t a f r o m the p i l o t p l a n t p r o d u c t i o n of active substance A [23] were used to reflect less optimised proc- esses. In the latter source, only mass balances are docu- mented. Thirdly, utility d e m a n d s were available from multi- purpose batch p r o d u c t i o n processes of a Swiss chemical producer, for the time f r o m 1998 to 2001, on a monthly basis [24]. These data h a d been measured on a production- building level and not specifically for any product. Of the three buildings for which data were available, one features aqueous-phase reactions and the two others organic-phase processes, each for a large range of fine and speciality chemi- cals (around 20 p r o d u c t s per building). Data from source [24] were normalised on the total p r o d u c t output mass. For all sources, m o n t h l y averages were calculated.D a t a from source
[22]
depict t w o relatively complex proc- ess steps, involving m a n y unit operations and featuring a low yield. It is therefore reasonable to regard these process steps as a worst-case of environmental performance regard-ing fine and speciality chemical production. Likewise, data f r o m source [23] represent a worst-case, because pilot proc- esses are not fully optimised routinely. D a t a from source [24] are representative for one of the largest sites for fine and speciality chemical production in Switzerland, which is also of a relevant size considering the European level. Table 2 shows the best-case and worst-case default values that were established for all parameters in Eq. 1-7, using the on-site data described above and heuristics. For the esti- m a t i o n of the overall yield of a process step (Eq. 2), it is taken into account whether the reaction assessed generates m a j o r side products. The occurrence of side products low- ers the yield of a process step. Thus, for process steps with k n o w n m a j o r side products, lower default yields were cho- sen t h a n for cases where no major side product is known. Default values for the yield in the worst-case scenario were taken f r o m references [22,23]. Best-case yields were estab- lished by the authors' knowledge in collaboration with ex- perts f r o m the chemical industry.
Often, the type of organic solvent used in a process m a y not be found in the literature. Rather than neglecting this input, a theoretical solvent was defined. The production-LCI of the theoretical solvent consists of an LCI of e q u i m o l a r a m o u n t s of toluene, acetone [1], and dichloromethane [25]. These solvents resemble the substance classes of aromatic, oxygenated, and chlorinated hydrocarbons, which are three i m p o r t a n t solvent groups. Processes were classified as aque- ous and organic processes according to the reaction medium. It was taken into account that organic solvents m a y also be used in aqueous processes (e.g. for extractions). Regarding processes in organic phases, potential inputs of process water were neglected, because the water input as solvent is small against the amount of cooling water used. To derive the mass of fresh solvent input and waste solvent output (Eq. 5 and 7), the n u m b e r of solvents used in the process step (ksolvent), the total mass of a single solvent in the process step (ITltota I solvent,j) and the solvent recycle factor (frecycte) were estimated (see Table 2). The n u m b e r of solvents used in a process step is determined considering the reaction phase (gaseous or liq- uid) and the reaction medium (organic or aqueous) of the process step. In process steps with a gas-phase reaction, no solvent is used for the reaction, but a solvent m a y be used for w o r k u p (e.g. stripping). In this case, a solvent-free proc- ess step was assumed in the best-case, while the use of one solvent for w o r k u p was considered in the worst-case sce- nario. In processes with a liquid-phase reaction, solvent-free process steps are known, but were not considered because they are scarce and thus assumed outside the 90% of possi- ble values that are supposed to be enclosed by a best-case and worst-case scenario. For the best-case scenario in liq- uid-phase reactions, the use of one solvent for the reaction was assumed, without further solvent use for workup. Con- cerning the worst-case, a second solvent was assumed to be used in w o r k u p (e.g. for extraction). For process steps with aqueous reaction medium, an additional input of organic solvent w a s estimated for w o r k u p in the worst-case. The total solvent mass in the process step for any type of solvent (aqueous or organic) was derived f r o m typical concentra- tions reported in [22,23] and f r o m an estimation factor for
Speciality Chemicals
LCA Methodology with Case Study
T a b l e 2: Estimated best-case and worst-case default values of the yield (Eq. 2), the solvent recycling factor (Eq. 5), other solvent parameters (Eq. 5), the emission factor (Eq. 6), and utility inputs
P a r a m e t e r
Yield (X)
R e a c t i o n p h a s e
J
R e a c t i o n m e d i u m Solvent type P a r a m e t e r s u b g r o u p
No major side product Major side product
D e f a u l t v a ! u e s : B e s t - c u e 0.97 0.87 W o r s t - c a s e 0.87 0.77
Solvent recycle factor 0.95 0 I -
(frecyc{e)
number of solvents used in a process step (kso~,ent)
Any Organic Aqueous Aqueous Any Aqueous O ~ a n i c Aqueous Aqueous Total mass of a single
solvent j in a process step (mtotal solvent.j)
Any Organic Water Organic Organic Water Organic Water Organic Emission factor (remission)
Steam Electricity Cooling water Na Steam Electricity Cooling water N2
Utility inputs for reaction and workup
Utility inputs for solvent regeneration Gas phase Liquid phase 0 0 0.2 2 0 1 x 10 -7 1.2 0.7 70 0.06 1.5 0.2 80 0.01 Gas phase Liquid phase 0.001 7.7 5.0 730 0.4 n.a. a n.a. a n.a. a n.a. a i U n i t : kgso~ent/ kgproduct kgwater/ kgproduct kg~o,vent/ kgproduct kgwater/ kgproduct kgso,,ent/ kgproduct kg/kgprodu~ M J/kgproduct kg/kgprodu~ Nm3/kgproduct kg/kgused solvent M J/ kguseO sol,ent kg/kgused so~,e.t Nm3/ kgused solvent a n.a. - not applicable because no solvent regeneration assumed
solvent d e m a n d used in process development in the chemi- cal industry [26]. Solvent regeneration is assumed to take place in the best-case scenario only, and thus a g o o d regen- eration yield of
95%,
which occurs in [22], was estimated. Emission factors (Eq. 6) were derived c o m p a r i n g such fac- tors relevant for chemical production processes as listed in the EU-Technical Guidance D o c u m e n t (EU-TGD [27]; Ta- ble A1.1, which is valid for Industrial Category 2, Main Category l c , Use Category not 33, p r o d u c t i o n processes) and emission factors calculated f r o m measured air emission mass flows f r o m source [22]. The m a x i m u m emission fac- tor f r o m the on-site data was used here as a worst-case value. This factor is one order of magnitude below that of the EU- T G D . This is reasonable, because the EU-TGD aims at worst- case estimates for Risk Assessment, which should be higher than the realistic worst-case estimates aimed at in this esti- m a t i o n procedure. The best-case emission factor was cho- sen t w o orders of magnitude smaller t h a n the m i n i m u memission factor in the EU-TGD, to take into account the worst-case nature of the latter source.
Utility demands for the reaction and w o r k u p unit operations were derived from [22-24] with minimum and m a x i m u m value representing best-case and worst-case scenario, respectively. Utility demands for solvent regeneration were derived from references [22,28]. Because solvent regeneration is assumed only in the best-case scenario, average values were used. Demands for catalysts and auxiliary materials were not esti- mated in this procedure, due to lack of data. T h e possible significance of these mass flows is discussed in Section 5.
3 Methods of Analysis of the Estimation Procedure
The applicability of the estimation procedure was shown with a LCA case study. The contribution of the estimation proce- dure to the total LCI of the case study was evaluated. Finally, the LCIA results of the case study were partially verified.
LCA Methodology with Case Study
Speciality Chemicals
All evaluations were carried out on the level of LCIA. The h u m a n toxicity potential of the CML-baseline method [29] was used to assess emissions potentially toxic to humans. Primary energy d e m a n d [3] was assessed because it reflects the consumption of fossil fuels, which is the most important resource c o n s u m p t i o n in the case study. Because the pur- pose of the assessment in this paper was to evaluate the esti- mation procedure and not to compare products, we focused on these t w o i m p a c t categories. In a preliminary analysis not shown here, other impact categories were not found to add any relevant i n f o r m a t i o n to the analysis of the estima- tion procedure: ecotoxicity impacts according to the CML- baseline m e t h o d were dominated by metal emissions f r o m background processes, global warming potential, acidifica- tion potential and eutrophication potential were dominated by emissions f r o m the consumption of fossil fuels. A char- acterisation factor for the h u m a n toxicity potential of emis- sions of the theoretical solvent to air was obtained by calcu- lating the geometric mean of the characterisation factors of all solvents characterised in the human toxicity potential. The geometric m e a n was applied because it is c o m m o n l y used to describe sets of non-negative values [30].
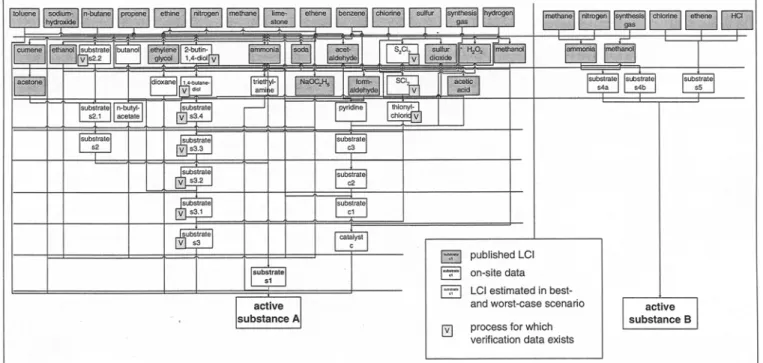
Two active ingredients for crop protection with the same use pattern were compared, entitled A and B. The functional unit was the p r o d u c t i o n of 1 kg each of active substance A and B 1. This functional unit reflects best the production- LCI of the case study, which is the goal of the estimation procedure presented above. In Fig. 2, all chemical produc- tion processes in the LCIs of the two active substances are displayed. One b o x represents one process step as shown in
1 This functional unit is relevant only for the analysis of the LCI-estimation procedure lined out above. Regarding the environmental performance of the active ingredients, the functional unit should at least consider the applied dose, which is about ten times lower for active substance A.
Fig. 1. LCI-data sources are indicated for each process step. Neither on-site nor published LCI-data were available for 22 and four process steps in the life cycle of active substance A and B, respectively. In these cases, the estimation proce- dure described above was applied to complete the overall LCI of the case study. The necessary input for the estima- tion procedure (stoichiometry and process characteristics) was obtained from Ullmann's encyclopedia [10] and f r o m interviews with industry experts. Information on solvent types and yields were found for three and nine processes, respectively. This information was used instead of the esti- mation procedures' defaults. For background processes in the LCI of the case study, the following data sources were used: LCI data on electricity production in Switzerland and Europe (UCPTE), as well as on transport, were taken f r o m Frischknecht et al. [3]. As a default, UCPTE-electricity mix was used. For basic chemical production, inventories data from APME [1] were used. Internal data from our w o r k g r o u p were used alternatively as well as the IVAM 1.01 database included in the Simapro 4.0 software [4], where no data from APME were available. For these alternative sources, background processes of energy and transport were replaced by data f r o m Frischknecht et al. [3]. Average transport re- quirements of 200 k m rail- and 600 km road-transport were estimated for chemical transport after every third process step. The LCIs used for the wastewater treatment plant and the incinerator for organic waste are based on data f r o m existing installations at a chemical production site in Swit- zerland [31]. LCI-data for the foreground processes in the p r o d u c t i o n of active s u b s t a n c e A were o b t a i n e d f r o m Syngenta Crop Protection [22].
For a partial verification of the estimated LCI of active sub- stance A, on-site data on eleven process steps were obtained from several chemical producers (see process steps m a r k e d with a 'V' in Fig. 2). These constitute a distinct set of on-site
Fig. 2: Production life cycle of active substances A and B. Each box represents one process step, and LCI-data sources used are indicated by shading (see box)
Speciality Chemicals
LCA Methodology with Case Study
data that were not used in the estimation of the default val- ues in Section 3. Verification datasets include on-site data for four process steps in the production of substrate s3 [32- 34] (see Fig. 2). Source [34] features data from a standard operation procedure in pilot scale, which are less representa- tive in terms of technical correlation with the actual process than any of the other on-site data used. Further, seven datasets from a process database were used [35]. As these data were acquired in the 1990ies, they may not reflect latest techno- logical developments. All data sources used for the verifica- tion contain yields, mass flows of substrates, reactants, sol- vents and auxiliary materials. Utility demands are documented in all sources but source [34]. Explicit waste flows are in- cluded only in the datasets from sources [32-34]. N o n e of the data sources comprises emission mass flows. To carry out the partial verification of the LCI estimated for active substance A, values in the initially estimated LCIs of proc- ess steps were replaced by values from the on-site data sources described above. The resulting LCI for active substance A has a higher data quality than the initial LCI due to a lower number of mass and energy flows being estimated by the estimation procedure. The on-site data used for verification did not include all mass and energy flows required. There- fore, missing data were again estimated using the default values described in Section 2. Further, on-site data were avail- able only for 11 of the 22 process steps with initially esti- mated LCIs in the production of active substance A. Thus, the verification is only partial.
To analyse whether the process steps with estimated LCIs make a relevant contribution to the impacts of the production of 1 kg
of active substance A, LCI-modules were sorted into the groups on-site LCIs, basic chemical LCIs, estimated LCIs and trans- port LCIs (Table 3). The fraction of the impact of each LCI group in the production of I kg of active substance A was cal- culated. Further insight into the relevance of specific param- eters of the estimation procedure was gained by calculating the parameters' sensitivities following Morgan and Henrion [30]. Changes in the LCIA-scores due to changes in single input pa- rameters were monitored. LCIA-scores and input values were normalised on their respective base-case values. A single decremental change of 10% was applied for this analysis.
4 Results and Discussion
The LCIs of the production of active substances A and B were calculated with the LCIs for 26 process steps estimated by the procedure lined out above. For the process steps with estimated LCIs, process characteristics as well as the esti- mated inputs and outputs are available in the supporting information 1. The estimated LCI for the production of I kg of substrate s2 (see Fig. 2) is shown as an illustrative exam- ple in Table 4. This is a gate-to-gate LCI for the process step to produce substrate s2. The process step features a liquid phase reaction in organic medium with no major side prod- ucts. As Table 4 shows, solvent input is distinctly higher for
1 Can be requested from the author ([email protected]) or accessed via the following DOI <http://dx.doi.ore/10.1065/Ica2003. 10.139.1>
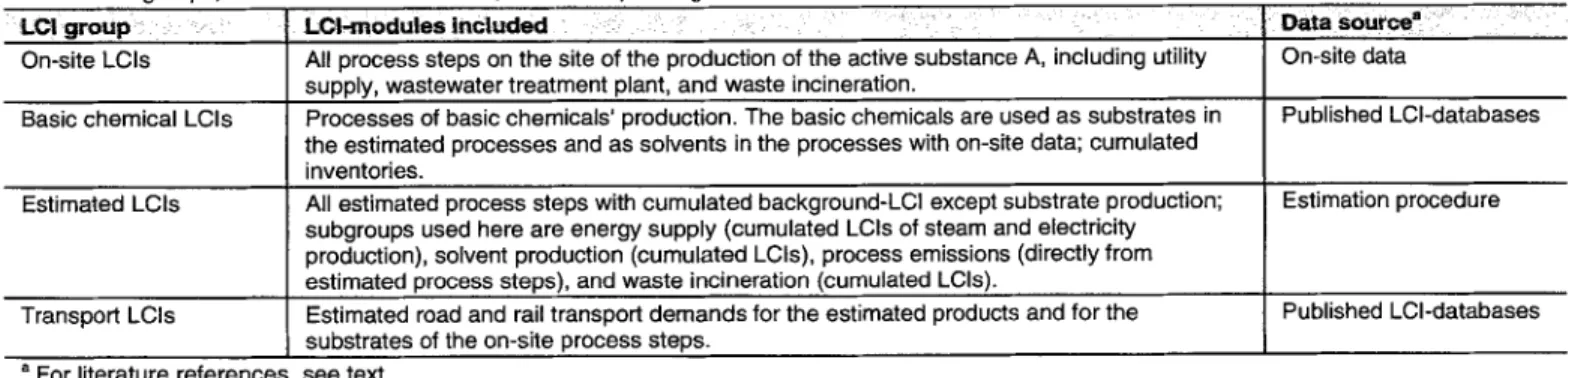
Table 3: LCI groups, the LCI-modules included, and corresponding data sources
L C I g r o u p : :: , LCl-modulesincluded " : ~ : i :.= i : Data source" ....
On-site LCIs All process steps on the site of the production of the active substance A, including utility On-site data supply, wastewater treatment plant, and waste incineration.
Basic chemical LCIs Processes of basic chemicals' production. The basic chemicals are used as substrates in Published LCI-databases the estimated processes and as solvents in the processes with on-site data; cumulated
inventories.
Estimated LCIs All estimated process steps with cumulated background-LCI except substrate production; Estimation procedure subgroups used here are energy supply (cumulated LCIs of steam and electricity
production), solvent production (cumulated LCIs), process emissions (directly from estimated process steps), and waste incineration (cumulated LCIs).
Transport LCIs Published LCI-databases
a For literature references
Estimated road and rail transport demands for the estimated products and for the substrates of the on-site process steps.
see text.
Table 4: Estimated gate-to-gate LCI for the process step to produce 1 kg of substrate s2 (see Fig. 2) - inputs of substrates (Eq. 2), input of fresh solvent (Eq. 5), air emissions (Eq. 6), utility inputs, (see Table 2), and output of organic wastes (Eq. 7)
Flow group Scenario Substrate s2,1 Sodium-ethoxylate Product (substrate s2) Couplod product I ~ e ~ S~ Substrate and solvent inputs Air emissions Utility inputs and waste output Best-case Wor~- case Best-case Worst-case Best-case Worst-case 0.70 0.78 7.0E-08 7.8E-04 Steam kg/kgproduct 5.5 7.7 0.61 0.68 Not emitted Not emitted Electricity MJ/kgproduct 1.3 5.0 n.a. a n.a. a 1.0E-07 0.001 Water (solvent and cooling)
kg/kgpmdu~ 298 730 n.a. a n.a. a 1.7E-08 1.7E-04 Nitrogen m3/kgproduct 0.09 0.4 0.15 8 5.9E-7 8.0E-3 Organic wastes to incineration kg/kgproauct 0.46 8.5 a n.a. - not applicable.
LCA Methodology with Case Study
Speciality Chemicals
the worst-case than for the best-case, mainly because the solvent recycle factor was assumed to be zero in the worst- case scenario (see Table 2). The mass of organic phases sent to waste incineration comprises waste solvent, yield losses and the coupled product (Eq. 7), and is thus also distinctly higher in the worst-case. Steam generation of only 0.9 MJ/ kgwaste solvent is credited in the incineration of organic wastes, because the incinerator module resembles an installation where aqueous and organic wastes are combusted together. Incinerators that are used only for the incineration of or- ganic wastes generate more steam, e.g. 17
MJ/kgwastesolvent
[28]. When an incinerator only for organic wastes is used, it is assumed here that aqueous wastes otherwise incinerated would have to be treated in equally energy-intensive instal- lations, such as wet oxidation. Because such wastewater treatment options are not modelled here, using the incinera- tor module with little energy credits prevents an underesti- mation of the environmental impacts. Demands of substrates (Table 4) are higher in the worst-case than in the best-case, because the default yield is lower in the worst-case. Emis- sions increase from best-case to worst-case scenario mainly due to the increasing emission factor (Eq. 6).To demonstrate the use of the estimation procedure in prod- uct comparisons, the LCIA results for the production of 1 kg of active substance A were compared with those of active sub- stance B. Results are displayed as ranges, with best-case and worst-case estimates as lowest and highest value, respectively (Fig. 3). The production of 1 kg of active substance A clearly shows higher impacts than B in both LCIA-categories assessed. The quotient of worst-case and best-case impact scores for each active substance ranges between values of 4 to 7. All further analyses are carried out considering active substance A only, because the goal is to describe the role of the estima- tion procedure within one substances' life cycle.
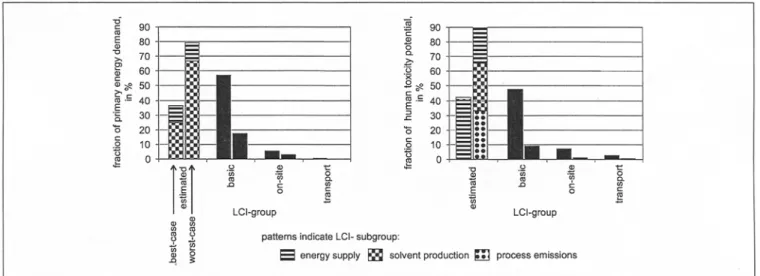
To evaluate the contribution of the LCI group 'estimated LCIs' (see Table 3) to the total impact of the production of active substance A, the contributions of each LCI group listed in Table 3 to the LCIA result were calculated (Fig. 4). Re-
Fig. 3: Comparison of the production of 1 kg each of active substance A and B, in the impact categories primary energy demand and human toxic- ity potential
garding the best-case scenario in both impact categories, the estimated LCIs share 35-45 % of the total impact score, giv- ing the second highest contribution. The LCIs of the pro- duction of basic chemicals ('basic chemical LCIs', see Ta- ble 3) contribute most to the total impact. In the worst-case scenario in both impact categories, the estimated LCIs con- tribute 8 0 - 9 0 % to the total impact score. Hence, the con- tribution of the estimated LCIs to the total impact is high for both human toxicity potential and primary energy de- mand. The LCIs of on-site data and transport each contrib- ute below 10% of the total impacts, in both scenarios and impact categories.
Focusing on contributions of the subgroups of the estimated LCIs (see Table 3), differences between the two impact cat- egories become obvious. LCIs of solvent production cause the highest primary energy demand, followed by the LCIs of energy supply processes, concerning both scenarios. As noted above, only little steam is generated in the waste in- cinerator. Hence, credits for steam production are insignifi- cant, even in the worst-case scenario where all solvent is assumed to be incinerated. Toxic emissions to air contribute most to the h u m a n toxicity potential. With regard to the best-case scenario, emissions from energy-supply processes dominate the human toxicity impact score. In the worst- case scenario, as the emission factor and solvent demand in
Fig. 4: Contributions of the LCI groups and subgroups (see Table 3) to the human toxicity potential and the primary energy demand, regarding the production of I kg of active substance A. Best-case scores (left columns) and worst-case scores (right columns) add up to 100 %, respectively. Note that in terms of the absolute values only the impacts from the LCI group 'estimated LCIs' change between best-case and worst-case scenario
Speciality Chemicals
LCA Methodology with Case Study
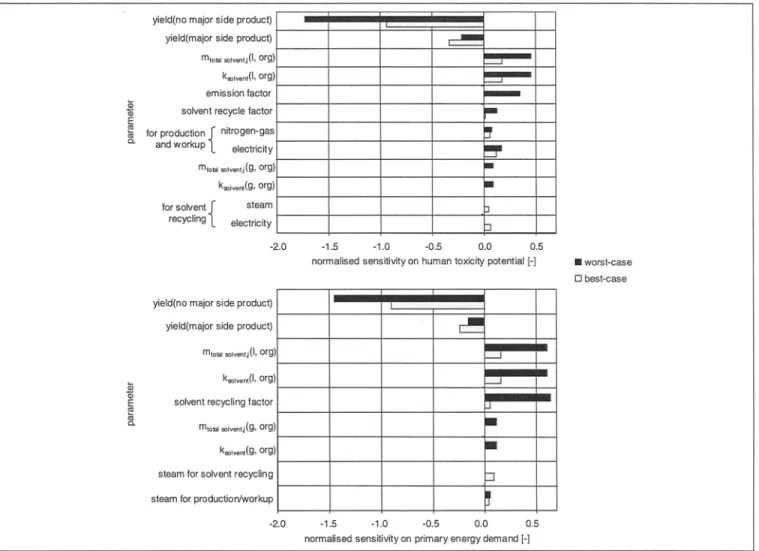
Fig. 5: Sensitivities of the default parameter values on human toxicity impact scores and primary energy demand in the best-case and the worst-case scenario. Only parameters with sensitivity > 0.05 are shown. Names for solvent parameters are given in the format: parameter (reaction phase, solvent type). For reaction phase, g = gas-phase, I = liquid-phase; for solvent type, org = any organic solvent (see also Table 2)
the estimation procedure increase, the corresponding LCI subgroups become equally important as the energy supply processes. The difference between best-case and worst-case results in the primary energy demand is due to the increas- ing demand of fresh solvent in the worst-case scenario. Con- cerning the h u m a n toxicity potential, increasing fresh sol- vent demands, solvent emissions and energy demands cause the difference between best-case and worst-case results. Contributions of LCI groups and subgroups are not shown here concerning the life cycle of active substance B, because similar contributions are observed as for active substance A. This is attributable to the relation of the numbers of esti- mated to published process-step LCIs being similar in the production life cycles of both active substances.
To analyse further, which parameters of the estimation pro- cedure exhibit important influences on the LCIA results, the sensitivity of each parameter was calculated (Fig. 5). Gener- ally, yields have negative sensitivities, as a higher yield leads to lower mass and energy flows due to lower substrate de- mands. All other parameters are directly linked to utility demands or emissions and thus produce positive sensitivi- ties. The ranking of parameters according to the sensitivi-
ties is almost identical in both scenarios and impact catego- ries. The yield features by far the highest sensitivity. It should be noted that the sensitivities to some extent depend on in- dividual characteristics of processes occurring in the life cy- cle of the case study. The different sensitivities of the yield depending on the classification of processes as 'major side product' or 'no major side product' can be attributed to this fact. Parameters describing the demand for organic solvents in liquid-phase process steps show the second highest sensi- tivity. These parameters are the number of solvents (ksolven t (1, org)) and the total mass of each single solvent in the proc- ess step (m~ota I solvent, j(l, org)). Relating to the primary energy demand, the solvent recycle factor shows the third highest sen- sitivity. Concerning the human toxicity potential, due to the toxicity of air emissions, the emission factor displays the third highest sensitivity. In the best-case, this emission factor is very low. Hence, its sensitivity is insignificant. Utilities used in the process steps display little influence on the results in any cat- egory or scenario. Solvent regeneration is assumed only in the best-case scenario, and thus utilities for solvent regeneration show some sensitivity only in this scenario. Parameters esti- mating water demand for cooling or as a solvent have insig- nificant sensitivities below 0.05.
LCA Methodology with Case Study
Speciality Chemicals
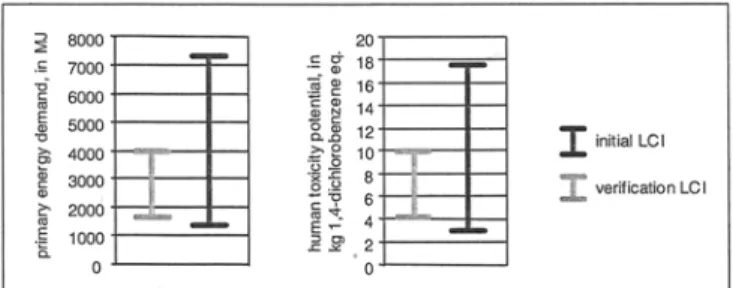
A partial verification of the LCIs estimated in the produc- tion of active substance A was carried out. To this end, the LCIs of 11 of 22 process steps in the production of active substance A (see Fig. 2, process steps marked with a 'V'), which were initially estimated with the procedure lined out in this article, were replaced by LCIs derived from on-site data (see Section 2). The LCI obtained is further called veri- fication LCI. In Fig. 6, the LCIA results from this verifica- tion LCI are compared to those from the initial LCI (see Fig. 3). The distance between best-case and worst-case re- sults in both impact categories is smaller regarding the re- suits from the verification LCI, because, in that dataset, a number of formerly estimated mass and energy flows were replaced by point values from the on-site data used for veri- fication. Relating to the best-case scenario in both impact categories, the initial LCI results in a lower primary energy demand and h u m a n toxicity potential than the verified LCI. This complies with the intention in the development of the two scenarios: LCIs estimated in the best-case scenario should reflect processes with environmental performances above the average, while the worst-case estimations should resemble process steps with high environmental impacts. Concerning the worst-case scenario, impact scores of the initial LCI in both impact categories are roughly double as high as those of the verification LCI, due to three factors: (1) In four cases, two consecutive reactions, which were assumed to be car- ried out in two separate process steps in the initial LCI, were found to be carried out together in one single process step in the verification LCI. In these cases, the intermediate prod- uct was not fully isolated, and, thus, utility and solvent de- mands for w o r k u p were reduced. (2) Many process steps display lower solvent or utility demands than estimated by the worst-case default values. In three process steps that ini- tially were judged to use organic solvents, no solvent is used at all in the verification LCI. (3) Higher yields lead to lower substrate demands from background process steps, thus re- ducing all impacts from these process steps. Altogether, LCIs estimated in the worst-case scenario resemble process steps with considerably lower ecological efficiencies than the ex- isting process steps that the verification LCI is based on. It is thus suggested that chemical production processes that show mass and energy flows resembling the worst-case estimates occur less frequently than chemical production processes whose mass and energy flows correspond to the estimated best-case LCIs. While no further evidence can be given yet for this interpretation, it is supported by two arguments.
Fig. 6: Comparison of impact scores from the initial LCI and the verifica- tion LCI of active substance A. Best-case and worst-case result are given as high and low value, respectively, of ranges of possible values
Firstly, all worst-case default values were derived from on- site data, implying that processes with corresponding mass and energy flows exist and the values are not unrealistic. Secondly, process optimisation is an important objective in chemical industry. Therefore, only process steps where en- vironmental efficiency competes with other targets like prod- uct quality display mass and energy flows as reflected in the worst-case LCI estimates. The partial verification is a first step towards the derivation of default values for a 'most probable' scenario. However, it is judged that at the current stage of research, too little information is available for such an interpolation.
Several sources of uncertainty are considered out of the scope of this work and are discussed qualitatively in the follow- ing. The sequence of reactions used to synthesise the final product as acquired from the literature is considered a user input. If several alternative reaction sequences exist, they should all be assessed. Experts should be consulted to verify the reaction sequences established. Further uncertainties stem from the concept of the theoretical solvent, namely from the production LCI of the theoretical solvent and the charac- terisation factor in the human toxicity potential. Few LCIs of solvent production were found in literature, and thus vari- ations in the production of different solvents could not be assessed in detail in this work. The characterisation factor for emissions of the theoretical solvent to air in the h u m a n toxicity potential is calculated as an average value of several typical solvent types (see Section 2), which carries a param- eter uncertainty. Whenever uncertainty propagation is car- ried out in case studies, this uncertainty should be included. The use of auxiliary materials and catalysts as well as the possible overstoichiometrical dosage of substrates are not assessed in the estimation procedure. Auxiliary materials are mostly acids and bases. Stoichiometric inputs of acids and bases are taken into account. However, for processes includ- ing pH-changes (e.g. for extraction), additional inputs of acids or bases are necessary. Demands of individual acids and bases in terms of mass flows were found to be 3 0 - 5 0 % higher in the estimated best-case LCI than in the verifica- tion LCI of active substance A. In the estimated worst-case LCI, acid and base demands were 3 0 - 8 0 % higher than in the verification LCI. However, the contribution of the pro- duction of all acid and base inputs to the total environmen- tal impacts in the verification LCI was only around 1%. Thus, neglecting non-stoichiometric inputs of acids and bases appears to be of minor importance. Still, specific processes exist, where non-stoichiometric acid and base inputs may contribute significantly to an LCA, e.g. sulfonation reac- tions using sulfuric acid as solvent. In such reactions, sulfuric acid needs to be neutralised with N a O H , producing gyp- sum. Alternatively, an energy-intensive regeneration of the acid is necessary [10]. Acid and base input should be inven- toried individually for such reactions.
Overstoichiometrical dosage of substrates is used to force the thermodynamical equilibrium of reactions with second or higher order kinetics towards the products and to increase the reaction rate. An overdosage of about 5 w t % of the cheapest substrate involved may be applied. The remaining
S p e c i a l i t y C h e m i c a l s L C A M e t h o d o l o g y w i t h C a s e S t u d y
unreacted substrate is commonly treated as waste. The result- ing additional waste mass is low compared to solvent waste and can thus be neglected. Neglecting the additional substrate input, however, m a y lead to an underestimation of the LCIA results. Inputs of catalysts and mass and energy flows due to catalyst recycling or disposal are also not assessed in the esti- mation procedure, following [6,7]. In another study, the pro- duction of a heterogeneous catalyst containing a precious metal was found to be significant [5], and this was due to a high catalyst concentration in the reaction medium. In the analysis of the LCI of active substance A, the homogeneous, organic catalyst employed in the last process step was found to con- tribute around 1% to the total impacts. The underestimation of impacts due to the neglected mass and energy flows con- nected with catalyst use is thus assumed to be low. Still, the consumption of precious metals for catalysts may contribute significantly to impacts of abiotic depletion. Precious metal use is not assessed in our estimation procedure, due to lack of data. Lastly, m a n y chemical intermediates can be pro- cured f r o m c o m m o d i t y suppliers. These suppliers m a y pro- duce in countries with lower environmental m a n a g e m e n t standards and incentives than Switzerland. The environmen- tal p e r f o r m a n c e of chemical production processes of such suppliers m a y be worse t h a n reflected in the on-site data from Swiss p r o d u c t i o n sites, which the default p a r a m e t e r values of this study are based on. For instance, a lower level of emission a b a t e m e n t in countries with less strict regula- tion than Switzerland m a y lead to higher air emissions. However, efforts of the chemical industry to reach high stand- ards in environmental issues are ongoing worldwide, e.g. according to the Responsible Care initiative [36].
5 C o n c l u s i o n s
A procedure for the estimation of LCIs for process steps in the production of fine and speciality chemicals was devel- oped and applied to a case study comparing two active in- gredients for crop protection. The impact of the process steps, whose LCIs were estimated with the procedure p r o p o s e d here, was significant c o m p a r e d to the total impact of the case study. Hence, the estimation procedure adds i m p o r t a n t information to the environmental assessment of fine and speciality chemicals. As an input to estimate LCIs of process steps in chemical production, only a m i n i m u m of informa- tion is required: the reaction stoichiometry and some basic characteristics of the process steps. These low data require- ments are a prerequisite to enable the comparative environ- mental assessment of fine and speciality chemicals by LCA, because of the low data availability that governs a n y at- tempt at creating LCIs for the production of these chemi- cals. Default estimates of m o s t parameters in the estimation procedure were p r o v i d e d to compensate for missing infor- mation. The uncertainty of these estimations was reflected by providing results in a best-case and a worst-case scenario. Evaluating the partial verification of the estimation results of the case study, it was suggested that the LCIs estimated in the worst-case scenario m a y correspond to a small n u m b e r of existing process steps in chemical production only. It w a s
indicated that the majority of existing process steps is likely to feature mass and energy flows corresponding rather to the best-case t h a n the worst-case scenario.
6 R e c o m m e n d a t i o n s a n d O u t l o o k
More accurately estimated LCIs could be achieved by a more detailed estimation of the default parameters, especially for the solvent demands and solvent types used. Additional verifi- cations would be desirable to learn more about the accuracy of the estimation procedure. In LCAs of the use of chemical products, other parameters besides the production-LCI influ- ence the results, e.g. such as those concerning the functional unit. Thus, the estimation procedure should be applied to more case studies to gain insight into the usefulness of the estima- tion results in different decision-making contexts.
Acknowledgements. We gratefully acknowledge the support sup- plied by Syngenta Crop Protection as well as the most valuable com- mitment of Paul Radimerski and Jan Kulka of this company. We thank CIBA Speciality Chemicals and SF-Chem for the support with data. Further, we gratefully acknowledge the reviewing of the manuscript by Stefanie Hellweg, Marco Eissen, Alexander Primas and two anony- mous reviewers.
References
[1] Boustead I (1999): Eco-Profiles of Plastics and Related Inter-
mediates. Association of Plastics Manufacturers in Europe (APME), Brussels
[2] Stalmans M, Berenbold H, Berna JL, Cavalli L er al. (1995): European Life-Cycle Inventory for Detergent Surfactants Pro- duction. Tenside Surf Det 32, 84-109
[3] Frischknecht RE, Bollens U, Bosshart S, Clot M et al (1996): Okoinventare yon Energiesystemen (LCIs of Energy Systems). Swiss Federal Office of Energy, Bern, 3rd ed.
[4] Simapro 4.0 (2001): Pr~ consultants B.V., Amersfoort, The Netherlands
[5] J6dicke G, Zenklusen O, Weidenhaupt A, Hungerbihhler K (1999): Developing environmentally sound processes in the chemical industry: a case study on pharmaceutical intermedi- ates. J Cleaner Prod 7, 159-166
[6] Kniel GE, Delmarco K, Petrie JG (1996): Life cycle a s s e s s -
m e n t applied to process design: Environmental and economic
analysis and optimization of a nitric acid plant. Env Prog 15, 221-228
[7] Jimenez-Gonzalez C, Kim S, Overcash MR (2000): Method- ology for developing gate-to-gate life cycle inventory infor- mation. Int J LCA 5, 153-159
[8] Blickenstorfer C (1999): Analyse des Energieverbrauchs eines Mehrprodukte - Batch - Betriebes: Fallbeispiel Reaktivfarb- stoffproduktion. (Analysis of Energy Use in Multipurpouse - Batch - Production: Case-Study on the Production of Reac- tive Dyestuffs). Dissertation, Swiss Federal Institute of Tech- nology, Laboratory of Technical Chemistry, Ziirich
[9] Grant CD (2001): Energy Management in Chemical Indus- try. In: Ullmann's Encyclopedia of Industrial Chemistry. New York. John Wiley & Sons, 6th ed.
[10] Ullmann's Encyclopedia of Industrial Chemistry (2001):John Wiley & Sons, New York, 6th e d .
[11] Bretz R, Frankhauser P (1996): Screening LCA for a large number of products. Int J LCA 1, 139-146
[12] Shonnard DR, Hiew DS (2000): Comparative environmental assessments of VOC recovery and recycle design alternatives for a gaseous waste stream. Environ Sci Technol 34, 5222-5228 [13] Bretz R, Frankhauser P (1997): Life-cycle assessment of chemi-
cal production processes: A tool for ecological optimization. Chimia 51,213-217
[14] Heinzle E, Weirich D, Brogli D, Hoffmann VH et al. (1998): Ecological and economic objective functions for screening in
LCA Methodology with Case Study
Speciality Chemicals
integrated development of fine chemical processes. 1. Flex- ible and expandable framework using indices. Ind Eng Chem Res 37, 3395-3407
[15] Simond O (2001): Personal Communication. CIMO S.A. [16] Hischier R, Baitz M, Bretz R, Frischknecht R et al. (2003):
SETAC LCA Working Group Data Availability and Data Qual- ity, Subgroup 3: Recommended List of Exchanges (in print) [17] Colomb G (2001): Emission Abatement at the Chemical Plant
in Monthey. CIMO SA, Monthey, Switzerland (confidential) [18] Kirk RE, Othmer DE (eds.) (1991): Encyclopedia of Chemi-
cal Technology. John Wiley & Sons, New York
[19] Weissermel K, Arpe H-J (1998): Industrial Organic Chemis- try. Wiley-VCH, Weinheim
[20] Tomlin CDS (ed.) (1997): The Pesticide Manual. British Crop Protection Council, 11th ed.
[21] Beilstein CrossFire plus Reactions (2000). MDL Information Systems GmbH, Frankfurt, 5th ed.
[22] Production Data for an Active Ingredient for Crop Protection and its Precursor (2001): Syngenta Crop Protection SA, Basel, Switzerland (confidential)
[23] Standard Operation Procedure in Pilot Scale for the Produc- tion of an Active Ingredient for Crop Protection (1990): Syngenta Crop Protection SA, Basel, Switzerland (confidential) [24] Utility Demands of Three Multipurpose-Batch Production Buildings, from the Years 1998-2001 (2001): CIBA Special- ity Chemicals SA, Basel, Switzerland (confidential)
[25] Frischknecht R (1999): Umweltrelevanz natfirlicher K~ltemit- tel; Okobilanzen von W~irmepumpen und K/ilteanlagen, An- hang zum Schlussbericht. (Relevance of Natural Cooling Agents; LCIs of Heat Pumps and Cooling Installations). Swiss Federal Office of Energy, Bern, Switzerland
[26] Coers KJ (2002): Personal Communication. Syngenta Crop Protection, Basel, Switzerland
[27] Technical Guidance Document in Support of Commission Di- rective 93/67/EEC on Risk Assessment for New Notified Sub-
stances and Commission Regulation (EC) No.1488/94 on Risk Assessment for Existing Substances (1996): European Com- mission, Luxembourg
[28] Hofstetter TB, Capello C, Hungerbiihler K (2003): Environ- mentally Preferable Treatment Options for Industrial Waste Solvent Management: A Case Study of a Toluene-Containing Waste Solvent. Transactions of the Institution of Chemical Engineers, Part B 81,189-202
[29] Guin6e JB, Gorr6e M, Heijungs R, Huppes G e t al. (2001): CML-Guide to Life Cycle Assessment. Centre of Environmen- tal Studies, Leiden University (CML), Leiden
[30] MorganMG, HenrionM(1990):Uncertainty. CambridgeUni- versity Press, Cambridge
[31] Data on Utility Inputs into and Emissions from the Chemi- cal Waste Incinerator and the Wastewater Treatment Plant at the Monthey Production Site (2000): CIMO SA, Monthey, Switzerland
[32] Cost Sheets on Production Processes for Fine and Speciality Chemicals (2002): Syngenta Crop Protection, Basel, Switzer- land (confidential)
[33] Cost Sheets on Production Processes for Fine and Speciality Chemicals (2002): SF-Chem, Basel, Switzerland (confidential) [34] Standard Operation Procedure for the Pilot Production of a Speciality Chemical (1987): Syngenta Crop Protection, Basel, Switzerland (confidential)
[35] Database of Mass and Energy Balances of Chemical Produc- tion Processes (1996): Syngenta Crop Protection, Basel, Swit- zerland (confidential)
[36] Busson J (1998): Position Paper on Responsible Care. Inter- national Council of Chemical Associations (ICCA). http:// www.icca-chem.or~
Received: January 6th, 2003 Accepted: October 9th, 2003
OnlineFirst: October 24th, 2003
Ref. [11]: Int J LCA 1 (3) 139-146 (1996)
Screening LCA for Large Numbers of Products: Estimation Tools to Fill Data Groups
Rolf Bretz*, Peter Frankhauser* Corresponding author
CIBA's Textile Dyes and Chemicals divisions use screening LCAs for their 1700 sales products to improve portfolio management and ecological process development. Material flow, energy, and waste data for in-house manufacturing processes are extracted from our company databases into our LCA system ECOSYS. For meaningful comparisons of whole life cycles, we must include LCA estimates for over 4000 raw materials from other suppliers. Even crude esti- mates are preferable to the frequently practised omission of unknown process steps since they allow worst-case or sensitivity analyses. Sources for mass flows are (decreasing order of reliability): process literature (SRI-PEP Yearbook, UIImann, Kirk-Othmer, patents), yields of analogous processes, theoretical stiochiometry. Energy demands come from literature, or from a set of standard operation estimates developed by our process engineers. Wastes/emissions, if not pub-
lished, are derived from yields and elemental balances, estimated emissions of energy carriers (BUWAL-132), and typical end-of-pipe measures in CIBA. These data sets are kept as 'added-burden mod- ules', which are transformed to step-pacific burden estimates by a 'propagation' program, before the overall burdens of the whole proc- ess tree are cumulated. This program checks every process for ac- tually measured burdens, before applying the attached ABM esti- mates to fill the gaps. Centralization of estimates as ABM with inherent burdens facilitates maintenance and adaptation. At present, well over 250 important intermediates were estimated and used in our product trees; many more follow rapidly.
This article is an example of how industry is using LCA to address environmental issues.