Publisher’s version / Version de l'éditeur:
Macromolecules, 24, 11, pp. 3098-3110, 1991-05-01
READ THESE TERMS AND CONDITIONS CAREFULLY BEFORE USING THIS WEBSITE.
https://nrc-publications.canada.ca/eng/copyright
Vous avez des questions? Nous pouvons vous aider. Pour communiquer directement avec un auteur, consultez la première page de la revue dans laquelle son article a été publié afin de trouver ses coordonnées. Si vous n’arrivez pas à les repérer, communiquez avec nous à PublicationsArchive-ArchivesPublications@nrc-cnrc.gc.ca.
Questions? Contact the NRC Publications Archive team at
PublicationsArchive-ArchivesPublications@nrc-cnrc.gc.ca. If you wish to email the authors directly, please see the first page of the publication for their contact information.
NRC Publications Archive
Archives des publications du CNRC
This publication could be one of several versions: author’s original, accepted manuscript or the publisher’s version. / La version de cette publication peut être l’une des suivantes : la version prépublication de l’auteur, la version acceptée du manuscrit ou la version de l’éditeur.
For the publisher’s version, please access the DOI link below./ Pour consulter la version de l’éditeur, utilisez le lien DOI ci-dessous.
https://doi.org/10.1021/ma00011a012
Access and use of this website and the material on it are subject to the Terms and Conditions set forth at
A new approach to modeling the cure kinetics of epoxy/amine
thermosetting resins. 2. Application to a typical system based on
bis[4-(diglycidylamino)phenyl]methane and bis(4-aminophenyl) sulfone
Cole, K. C.; Hechler, J. J.; Noel, D.
https://publications-cnrc.canada.ca/fra/droits
L’accès à ce site Web et l’utilisation de son contenu sont assujettis aux conditions présentées dans le site LISEZ CES CONDITIONS ATTENTIVEMENT AVANT D’UTILISER CE SITE WEB.
NRC Publications Record / Notice d'Archives des publications de CNRC:
https://nrc-publications.canada.ca/eng/view/object/?id=7b54d765-52b1-4e33-bd84-e08028aec153 https://publications-cnrc.canada.ca/fra/voir/objet/?id=7b54d765-52b1-4e33-bd84-e08028aec1531991, 24, 3098-3110
A New Approach
to
Modeling the
Cure
Kinetics
of
Epoxy Amine
Thermosetting
Resins.
2.Application
to
aTypical
System
Based
on
Bis
[4-(diglycidylamino)phenyl]
methane and
Bis(4-aminophenyl)
Sulfone
K.
C. Cole,*J.-J. Hechler, and D. NoelIndustrial MaterialsResearchInstitute, NationalResearch Council ofCanada,
75boulevarddeMortagne, Boucherville,Québec, CanadaJ4B6Y4 ReceivedJuly31,1990;RevisedManuscriptReceivedNovember9, 1990
ABSTRACT: Differentialscanningcalorimetry in dynamicandisothermalmodeswasusedto study thecure
kinetics ofthecommercial epoxy system Narmco5208, whosemain componentsare
bis[4-(diglycidylamino)-phenyljmethaneand bis(4-aminophenyl) sulfone. Thedatawere analyzedintermsofa new mechanistic approach describedinthe preceding paper. The treatment explicitlytakesintoaccountboththe
epoxide-aminereactions andthe subsequentetherification reaction. The kineticscan becompletelydescribedin
terms ofthreerateconstants, whichobeytheArrhenius relationship. Excellentagreementwiththe experimental
dataisobtainedif theetherificationreactionisassumedtobefirstorderwithrespecttothe concentrations
ofepoxide groups,hydroxylgroups, and thetertiaryamine groups formedintheepoxide-aminereaction.
Thismodel appliesover the wholerangeofconversion uptothepointwherethe resinvitrifiesandthe reaction
becomesdiffusion-controlled. Theeffectofthediffusion controlisdescribed very well byan approachbased onsimple equations proposedintheliterature. Altogether,the model allows accurateprediction ofthe degree
ofconversionover thewhole rangeofcure andover the temperaturerange160-200 °C,whichcovers the usual curing conditions. Although the rate constants derived are specific to Narmco 5208, the modelitself is
generally applicabletootherepoxy aminesystems.
Introduction
Background.
Mathematical modelingoftheformingprocess in composite materials can lead to significant
savingswithrespectto the amountofexperimental work
involvedin determining the optimumprocessing condi-tionsforaparticularpart.1 For thermoset matricessuch
as epoxy resins, probably the most important aspect of
the model is an accuratedescription ofthe polymeriza-tionreactionkinetics. Becauseofthe complexity ofthe chemistry involved, existingmodelsare usually
semiem-piricalapproximations, which workwithvaryingdegrees ofsuccess. The work tobedescribed hereinwas under-takenwiththe aimofdevelopinganaccuratekineticmodel
forthe commercialproductNarmcoRigidite 5208.
Be-cause the existingmodelsthatwere tried were found to worklesswell thandesired,a new mechanistic approach
was developedas described inthe precedingpaper.2 In
thispaper,wedescribeits application totheNarmco5208
system and demonstrate that it provides an excellent
description ofthe curing kinetics.
Narmco 5208. Narmco Rigidite 5208, produced by BASF Narmco Division, is reported to consist ofthree
components.3 The mainone isan epoxy resin basedon
tetraglycidyldiaminodiphenylmethane(TGDDM);a
well-known commercial product of this type is Ciba-Geigy’s AralditeMY 720. Thesecondcomponentistheprimary
amine curingagentdiaminodiphenylsulfone (DDS),also
availablefrom Ciba-Geigy as Hardener HT 976. These two monomers also form the basis of several other commercial products. The third componentofNarmco
5208is an epoxy resinbasedon a bisphenol A Novolac;
sucha productissoldbyCelaneseunder thename
Epi-Rez SU-8.
PreviousWork. Thegeneralnatureoftheepoxy amine
reactionandsome well-known equationsusedtodescribe
the kineticshave been discussedin part1 ofthisseries.2
*Author towhom correspondence shouldbeaddressed.
Barton4hasreviewedmuchoftheliterature. Therehave beennumerous studiesofmixturesof TGDDMandDDS
andofcommercial systemscontainingtheseproducts.5*21
These have involved differentapproaches to describing
the kinetics,withvaryingdegreesofsuccess. Insome cases, agoodfit to experimental datawas obtainedinthe early
stagesofthereaction,butdeviationswere observedinthe later stages. In other cases, reasonably good overall
agreementwas obtainedbutonlybytakinga
phenome-nological approach in which empirical parameters are introduced and varied to
fit
the data.It
appears to bewell establishedthattheetherificationreactionis signif-icantandcannotbeignored.4 Onequestionthathasnot
beensatisfactorilyresolved,however,isthatoftherelative reactivitiesoftheprimaryaminegroups
initially
presentandthesecondaryaminegroupsformedinthe reaction.
While it is frequently stated that the secondary amine
groupsare muchslowertoreact,theevidencefor thisis
not entirely convincing. Gupta and co-workers8 used
differentialscanningcalorimetry(DSC),Fourier transform infraredspectroscopy(FT-IR),andelectron spinresonance (ESR) to study mixtures involvingTGDDM,DDS, and
thesecondaryamineDMDDS
(bis[4-(methylamino)phe-nyl]sulfone). They concludedthatin the earlystagesof
cure themain reactionisbetweenprimaryamineand
ep-oxide(PA-E), thatthereactionbetween secondary amine
and epoxide (SA-E) is negligible, and that the cure is
completedbythehydroxyl-epoxide(OH-E)reaction.The rate constant forthelatterwas estimated tobean order
ofmagnitude smaller than thePA-E rate constant, and the enthalpy ofreactionabout eight timesless. However,
Barton17 has provided conflicting data showing that
TGDDM-DDSmixtureswithamine/epoxide ratios
rang-ing from0.61to1.14haveaconstant enthalpyofreaction
ofabout110
kJ/mol
ofepoxide. Thissuggeststhatbothprimaryand secondary amine groups react completely
withepoxideand that residual epoxideis consumed by
the OH-Ereaction, all these reactions having
approxi-mately equal exothermicity. The calorimetric data of
0024-9297/91/2224-3098$02.50/0 Published 1991 by the American Chemical Society Downloaded via NATL RESEARCH COUNCIL CANADA on September 11, 2018 at 20:39:54 (UTC). See https://pubs.acs.org/sharingguidelines for options on how to legitimately share published articles.
Macromolecules, Vol. 24,No. 11, 1991 Modeling the Cure Epoxy
Gupta et al. mayalso be interpreted in this way.
Fur-thermore,theirresults concerning theratioofthesulfone
peaksat1150and1105 cm"1intheIRspectrum mayalso
besubject to other interpretations. Morganandothers9"11
have alsostudied themechanismofTGDDM-DDScuring
by means ofFT-IR spectroscopy. Their dataindicated
thatthe epoxidehomopolymerization reactionissome 200
timesslowerthan thePA-Ereaction. TheSA-Ereaction
was assumedtobeaboutten timesslower,on thebasisof
dataobtained byBell22 forthe reactionof DGEBA
(di-glycidyl etherofbisphenol A)with MDA (methylenedi-aniline). Similarly,theOH-Ereactionwas also assumed
tobetentimes slower,on thebasisoftheabove-mentioned
work ofGupta etal.7-8 While theseassumptions appear
to be in agreement with their results, this does not
constituteproof that theyare valid,sincethe data may notbesufficientlysensitive. Infact,some of theirdata11
suggestthattheSA-Ereactionisrather significant, and
therecentworkby Zukas etal.12indicatesthattheprimary
and secondary amine groups have approximatelyequal
reactivity. Thisimportantquestionwillonlyberesolved
by further experimental work, preferably involving a techniquethatcan directly quantifythedifferenttypes
ofaminegroups.
Publisheddata for Narmco5208are ratherlimited.
Ciz-mecioglu and Gupta6studiedthe kinetics by dynamicDSC
and analyzed the results in terms ofa single nth-order
reaction. This isan oversimplification,since
it
hasbeenclearly establishedthatthe epoxy-amine reaction is
au-tocatalyticandthat etherificationcan alsobeimportant.
Recently,Chiao21hasanalyzedtheTGDDM-DDSdata
of Mijovic et al.15 in terms of a mechanistic model incorporating an epoxide-hydroxyl reaction in addition to the epoxide-amine reactions. The kineticequations were not solvedanalytically,so anumericalsolutionwas
usedto
fit
thedata,andgoodagreementwas obtained.No assumptionwas madeconcerning the relative reactivityofthe secondary andprimaryaminegroups. However,in
orderto
limit
thenumberofparameterstobefittedtoareasonable number, the ratiosofthe rate constants for
catalysisbyhydroxylgroupsformed in the reactionand
forcatalysis byimpurities
initially
presentwere fixed atvaluesobtained by analyzing earlierdata23forthereaction
between phenyl glycidyl ether and diethylamine or
n-butylamine. The apparent activationenergiesobtained
forthePA-E,SA-E,andOH-Ereactionswere respectively
55.1, 71.6,and 97.2kJ/mol.
Experimental
SectionMaterials. In addition tothe composite Narmco5208,some
mixturesoftheindividualcomponents knowntobepresentin this system were studied. Samples of Araldite MY 720 and
HardenerHT976were obtainedfromCiba-Geigy andEpi-Rez SU-8 from Celanese. The epoxide content ofthe resins was
determinedby reacting the resinwithexcess hydrochloricacid
in acetone/water solutionandthentitratingtheexcessacidwith
sodiumhydroxide. Theequivalentweights obtainedwere 130.2
(
= 2.1%)forMY 720and227.3(
= 0.4%)forSU-8. Theseare ingoodagreementwiththetypicalvaluesreportedby the
manufacturersforthesematerials(117-134forMY720,215for
SU-8). FortheHardener HT976,whichisnear 100% pure, the
equivalentweightwas calculated tobe62.1. Thisis basedonthe assumptionthateachofthefourN-H bonds presentcan react
withan epoxidegroup.
Theprepregstudiedwas Narmco Rigidite5208/WC3000-42
fromNarmcoMaterialsInc. It consistsofwoven carbon-fiber reinforcementimpregnatedwithNarmco5208resintoanominal
resincontentof42 %by weight. Therecommendedcure schedule
involvesa 1-hdwellat135°Cfollowed bya2-hcure at177°C. Thevolatilescontent, measured by weighing samples before and
afterheatingat177°Cfor20min,wasfoundtobe 1.90±0.03 %, basedon totalprepreg weight.
Theprepregasreceivedispartlypolymerized,or “B-staged". Aspointed outby Roberts,1foraccurate modelingofthecure it isessentialtocharacterize theinitialchemical stateoftheresin,
i.e.,itscomposition andinitialdegreeofadvancement (polym-erization). Thiswas donebyreverse-phaseliquid
chromatog-raphy.24 Different mixtures of MY720,SU-8, andHT976were
preparedinacetonesolutionandtheacetonewas removedunder
vacuum withoutheating. Sampleswere then polymerized to two
differentdegreesofadvancement by heating at120°Cfor30and
80min. AnalysisbyRPLCgave chromatogramsin whichthe
areas ofthefollowing fourpeaks couldbemeasured: TGDDM
(main component of MY 720), DDS (HT 976), DGEBA = diglycidyletherofbisphenolA(major componentofSU-8), and theinitialreactionproductbetweenTGDDMandDDS. These
quantitieswere then related to themixture composition and
degreeofadvancement. On analyzing the Narmco5208resin and comparing its chromatogram to that of the calibration mixtures, itscompositionwas estimatedtobe65.9% by weight
MY720,13.2% SU-8, and20.9% HT976,andtheinitialdegree
of polymerizationa0in theprepregasreceivedwas 0.038. This
composition correspondstoan initialamine-to-epoxideratioB
equal to0.60, basedon the epoxideequivalentweightsreported above.
Somebinaryandternary mixtures of MY720,SU-8, andHT
976were alsostudied byDSC. Thesewere preparedby dissolving precisely weighedquantities ofthematerialsinacetone,pouring
thesolutionintoashallowaluminumdish, and evaporatingthe
acetoneundervacuum withoutheating.
Thermal Analysis. Theprepregcure was studiedbyboth
dynamicand isothermalDSC4 on a Setaram Model CDP111
calorimeter. Dynamicruns were doneonbothpreparedmixtures
and prepreg. Approximately50mgofsamplewas placedinan
open platinum crucible that was suspended vertically in the
calorimeter. An empty cruciblewas usedasthereference. The
samplewas heatedinanitrogenatmosphereatafixedrateof
5 °C/minfromroom temperature toaround300 °C,atwhich pointsome decompositionisobserved. Inthecase ofprepreg
samples, the exactweight ofresin presentafterthe DSCrun was
determinedbythermogravimetricanalysis(TGA)on aSetaram B70thermobalance equippedwithagraphite resistance furnace.
The samplewas heatedinan oxygen atmosphereat10°C/min
fromroom temperature to9006C.26
IsothermalDSCruns were doneon prepregonly,at temper-atures rangingfrom160to210°C. Forthese experimentsthe
samplesizewasaround100 mgand unsealedaluminumcrucibles
were used. Inorderto minimizethetime required for
equili-bration after the sampleis introducedinto thecalorimeter, a
warmingoven was addedto preheatbothsample and reference
for about 10min at125°C before introductionintothemain
oven. RPLCanalysisindicatedthatlessthan0.5% ofthe
ep-oxidegroupsreact during this treatment. Thereference consisted
ofacruciblecontainingfullypolymerized prepreg, and sample andreferenceweightsaswellasthe corresponding crucible weights were matchedascloselyaspossible. The calorimetersignal (heat
flux=
dQ/dt)was measuredforabout6-7h, exceptat210°C where1.5-2hwassufficient. Aftereachisothermal run,adynamic
run was performedon thesame sample to complete the
polym-erizationanddeterminetheresidual heatofcuring. Threeruns were doneateachtemperature.
Thedigitizeddatawere acquiredbyaHewlett-Packard
HP-85computer and subsequentlytransferred toaVAX11/750or an Apple Macintosh for further treatment.
In isothermal DSC, there is a briefperiod oftemperature
equilibration afterthe sampleisintroducedintotheinstrument.
Inorder to estimate thetime requiredby thecalorimeter togive ameaningfulsignal,afew sampleswere run twice, thefirstrun
givingtheraw polymerizationcurve,thesecondgivingthe
cor-respondingexperimentalbaseline, whichisthenusedtocorrect the raw curve.4 It was foundthat theshapes ofthe raw and
corrected curves are identical after about 2 minandare only
slightly different before the point where the signal becomes
exothermic. Since thetime requiredtoobtaintheexperimental
baselinecan bequitehigh (up to 6-7 h), theextrapolationmethod
Cole Macromolecules, Vol. 24, 11, 1991
Table I
DynamicDSCData for theMixtures InvolvingMY 720,HT 976,and SU-8
mixture MY720, % HT976, % SU-8,%
amine-to-epoxideratio 7W,eC Mí,aJ/g
AH,kJ/mol ofepoxide 1 77.97 22.03 0 0.59 252 643.7(5.4) 107.5 2 77.02 22.98 0 0.63 250 637.9 (3.9) 107.8 3 73.17 26.83 0 0.77 234 605.2(5.9) 107.7 4 68.99 31.01 0 0.94 220 563.3(3.7) 106.3 5 67.58 32.42 0 1.01 218 556.3(4.5) 107.2 6 77.78 13.17 9.05 0.33 267 657.5 (4.8) 103.2 7 68.92 22.05 9.03 0.62 250 595.7(4.1) 104.7 8 59.49 31.54 8.97 1.02 217 533.3(4.6) 107.4 9 68.80 13.13 18.08 0.35 268 623.5 (3.0) 102.6 10 59.73 22.27 18.00 0.67 248 565.6(7.8) 105.2 • Valuesinparentheses
correspond tostandard deviationsbasedon threedeterminations.
obtainedbyhorizontal extrapolationusing the last tenpoints of thecurve, and thepointwhereitintersectswiththe onsetofthe
reaction exothermwastaken tobethe starting time ofthereaction
(t = 0). Thetotalheatsof polymerizationobtained bythe two
methodsofbaselinecorrectionwere identicalwithinlessthan
1%. Consequently, the extrapolation methodwas chosen for
correctionof alltheexperimentalcurves. These experiments showedthatthepoints obtainedwithinthefirst 2 minofthe
polymerizationrun aresubjecttosome error, andtheir ordinate values(dQ/dt)are lowerthanthe real values.
Results and Discussion
Mixtures. Dynamic
DSC. Inorder to relatetheep-oxide conversion to the heat evolution in the DSC
experiment,
it
is necessarytoassume thattheheatreleasedon reactionofan epoxidegroupisthesame regardlessof
thetype ofepoxyor thenatureofthereaction. To confirm
thishypothesis,severalmixturesofMY720,
HT
976,andSU-8 were analyzed by dynamic DSC. The results are
given inTable I. The mixturescover a rangeof compo-sitionsandamine-to-epoxide ratios. Attemptstoanalyze
some binary mixtures ofSU-8 and
HT
976wereunsuc-cessful. First, it is
difficult
to remove all the acetonewithoutheating the mixture. Second,it isbelievedthat
thehigherfunctionality ofSU-8leadsto rapidvitrification,
whichcauses the reaction tostopwellbeforecompletion. Figure 1 shows the DSC curves for three different mixturesofMY720andHT 976withvarying
amine-to-epoxideratios. The effecton the nature ofthe reaction
is evident. Mixture 5 (Figure la) is a stoichiometric
mixture in which the number of epoxide rings is just sufficienttoreactwith allthe
N-H
bonds present: hencetheamine-epoxidereactionisbelievedtobethedominant one. TheDSCcurve showsastrong exothermicpeakwith
amaximum at218°C. In mixture3 (Figure
lb),
thereisa30%excess ofepoxidegroupswithrespect to amine, and
theseare believedto polymerize by etherification. This
occurs atasomewhat highertemperatureandsubstantially
broadens the DSC exotherm peak; the maximum now
occurs at234°C. In mixture2(Figurelc),thereisa60%
excess of epoxide groups. The etherification reaction
becomeseven more importantand shifts the peak
max-imumto 250 °C.
The other mixturesgavesimilarcurves,andtheresults
are summarized inTable I. The temperature at which the peak maximum occurs is highly dependent on the overall amine-to-epoxide ratio but is not significantly
affected by the replacementof part of the MY 720 by
SU-8. AplotofTm..versus the amine-epoxideratiogives agoodlinear relationship(squaredcorrelationcoefficient
0.982). The enthalpies of polymerizationforthedifferent
mixtureswere determined by computer integrationofthe
exothermpeak usingalinearbaseline. The results,based
on threetofour determinations foreachmixture,are listed
Figure1. DynamicDSCcurves formixturesof MY720andHT 976withamine-to-epoxide ratiosof (a) 1.01,(b) 0.77, and (c) 0.63;heating rate5°C/min.
in thetable. Thevaluesvarywiththe mixture,but if they
are converted to kilojoules per equivalent of epoxide
present,aconstantvalueofabout107
kJ/mol
isobtained.This is in excellentagreementwith the results reported
byBarton.17 The factthatthesame resultisobtainedfor
mixture 5,wheremostofthe epoxide groupsreactwith
amine, and mixture 2,where at leastone-third react by
etherification, indicatesthatthe enthalpies forthesetwo reactions are very similar. Likewise, comparison of mixtures1and10suggeststhattheenthalpy for theSU-8
is not muchdifferentfrom that for the MY 720. Both
mixtureshavesimilaramine-to-epoxide ratios,but mixture 1containsno SU-8,whilein mixture10,14% ofthe epoxy
groupscome fromSU-8. The two mixtureswithverylow
amine-to-epoxide ratios(0.33and0.35)giveslightlylower
enthalpiesofreaction. Thiscouldbedueto incomplete
Macromolecules, Vol. 24,No. 11, 1991 Modeling the Cure Epoxy
Prepreg.
Dynamic
DSC. FivespecimensofNarmco 5208prepregwere analyzedbydynamicDSCandTGAasdescribedinthe ExperimentalSection. TheDSC curve
isverysimilarto Figure
lc,
withamaximum around 250°C. Theaverageweightlossduring theDSCexperiment
was 2.1 ± 0.5%, which is close to the value of 1.9%
determinedfor the volatiles content. Thisindicatesthat
the amountofdegradationthat occurs isnegligibleand
thattheweightloss ismainlyduetononreactivevolatiles
suchaswaterand acetone,whichare known tobepresent
inthe prepreg. Foreach specimen, the weightofresin
remainingaftertheDSC experimentwas determinedby
TGAandthiswas taken to bethetrue weightofresinin
the prepreg, exclusive ofvolatiles. The energy released on polymerizationwas determinedbyintegratingthe DSC
peak andwas thendivided bythisweight togivethe
en-thalpy of polymerization AH. The average of the five valueswas 620.4J/g, withastandarddeviationof7.5J/g.
It
was pointed out inthe Experimental Sectionthat this resinispartlypolymerized,or B-staged,to the extentof0.038;inotherwords, 3.8% ofthe epoxide groups
initially
present in the system have already reacted. Thus, for completely unreacted Narmco5208,AHwouldbe620.4/ (1-0.038)or 645.1J/g. On thebasisoftheother results given inthe Experimental Section,the enthalpy per
ep-oxide group is calculated to be 114.3 kJ/mol. This is slightlyhigher thanthe valueof107-108kJ /mol reported
in Table
I
for prepared mixtures but within the range100-118
kJ/mol
typically observed for epoxide ringopening.26 The averagefibercontent ofthe prepregfor
thefivespecimensanalyzedwas 59.0 ± 0.9% by weight.
Prepreg.
Isothermal
DSC. Three experimentswere performed ateachofsixtemperatures ranging from 160to210°Cin10-degincrements. Atypicalcurve,showing
heatflow(dQ/dt)as afunction oftime at160°Cisgiven inFigure2a. Thiscurve hasbeencorrected bymeans of the extrapolation method describedinthe Experimental
Section. Integrationgivestheevolvedheatas afunction
oftime:
Q(t) =
J/dQ/dt
dt (1)Thetotalheatevolvedduringtheisothermal experiment
is given by thetotalarea under the isothermalcurve:
Qi=
J0ifdQ/dt dt (2)
where
tf
is the time corresponding to the end of theexperiment, when the rate of heat evolution becomes
negligible. Sincethe polymerizationmaynotbecomplete aftertheisothermalrun,
it
iscompleted in thesubsequentdynamicrun, as showninFigure2b. Integration ofthis curve gives the residual heat of polymerization Qr.
At
higher temperatures, the isothermal cure occurs much faster,ahigherdegreeofpolymerizationisachieved, and Qrislower.In order to analyze the kinetics, the curves must be
expressedin termsofa,thedegreeofpolymerization. To
dothis, theusualassumptionwas made,namely,thatthe
heatevolvedisdirectly proportionaltothenumberof
ep-oxidegroups reacted, regardless ofthe typeofreaction.
As discussed above,the results forthe various prepared
mixtures supportthis assumption.
Inmostanalysesofthekineticsofprepregsystems,it is assumedthatthe extent ofB-stagingisnegligible,that
is,thatthedegreeofpolymerization at the beginningof
the cure (ao) is equal to zero. In this work, the initial
degreeofcure, determined byliquidchromatographyto
Figure2. DSCcurves forNarmco5208prepreg: (a)isothermal
run at160°C; (b)dynamiccurve recordedafter isothermalrun, heating rate 5°C/min.
beequalto0.038,was takenintoaccountintheanalysis.
Thisleadsto the following equationsforderivinga and
da/dt
asfunctions oftime:“(í)
= ao+(¿+^)Q(í)
da _(
1~ ao\dQ
dt ~ \Q¡+Q,/dt
(3) (4)Withthese data
it
is possible to constructa curve ofda/dt
versus a foreachtemperature. Theseare thenusedto test thekineticmodel. Oftheseveralthousand points
ina given curve, 50-100were selected atequalintervals
for this analysis.
Analysis of
theData
by Meansof
SomeExisting
Models. Thefirst test applied to the data involved the simplifiedHorie equation:27
da/dt
={
+2 ){1- ) ß- )
(5)where the rateconstantsK\andK2correspondrespectively
to catalysis by groups
initially
presentin the resin andcatalysisbyhydroxylgroupsformedinthe reactionand
Bis the ratioof primary amine
N-H
bonds to epoxidegroupsinthe
initial
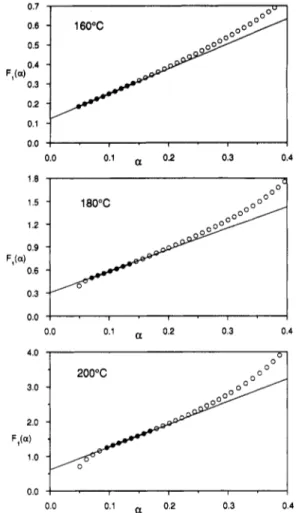
mixture. Figure3showsplotsofthe reducedrate function¥\{oi) = (1)-1(
-a)-1(da/dt)
versus a forthree differenttemperatures. This should
giveastraightlinewith intercept
K\
andslopeK2. ThevalueofBwas fixed at0.6,asdetermined byliquid chro-matography. Except for the
first
few points, linear behaviorisobserved uptoaabout0.2,withslight deviationbetween0.2and0.3and significant deviation beyondthis
point. The deviationobserved athigher temperatures for thefirstfewpointscan beexplainedby the factthatthese
occur withinthefirst2min oftheexperiment, before the
system has
fully
equilibrated. The deviation observedwhen a > 0.3 isattributed to thelackof validity ofthe modelin thisregion, wheretheetherificationreactionis
believed to become significant. Linear regression was performedby using the pointsshownbyfilledsymbolsin
the figure. The intercepts of these lines were used to determine the values of
da/dt
corresponding to a = 0.3102 Cole etal. Macromolecules, Vol. 24, 11, 1991
0.0 0.1 „ 0.2 0.3 0.4
Figure3. Plotsof Fi(a)- (1
-a)~l(B
-a)-1(da/dt)as afunction
ofa forthreedifferenttemperatures;unitss"1x 1000.
Anextension ofthis approach,usedby Springer etal. forthe commercial productHercules3501-6,®separates
the reaction intotwo distinctstages.
It
isassumedthat inthebeginning (a<0.3)onlytheepoxide-amine reactionneedbeconsidered, andeq 5 isused. Whenthe
epoxide-aminereactioniscomplete,the epoxide-hydroxyl reaction
takes over, and, sincethehydroxylconcentrationisnow constant, the reaction is assumed to be
first
order withrespecttoepoxideconcentration. Thusitcan bedescribed
by thefollowing equation:
da/dt
-K3(1
-a) (6)
In thiscase thereducedfunction
F^a)
= (1-a)-1(da/d£) should be constant and equal to K¡. To test this
hypothesis, the quantity Fi(a) was plotted againsta as
shownin Figure4. Interesting behaviorisobserved. Only
at the higher temperatureof200 °Ccould the approxi-mationbeconsideredtobevalid,and,even then, only up toacertain point. Generallyspeaking,thequantityFata)
risesto a maximum valueat arounda = 0.3,butinstead
ofremaining constantitgraduallydeclines
until
areachesabout0.7 or 0.8.
At
this pointthere is a rather abrupt dropandthe reaction rate falls to zero beforecompletion.This is believedto be due to vitrification ofthesystem
andtheonsetofdiffusion control. This willbediscussed
in more detail later.
It
is interesting to note that in Springer’s work,although thisapproachgaveareasonablygoodfitto the experimental data fora up toabout0.6,in order to achieve it it was necessary to assume negative
valuesforthe rate constant Kzl The problemliesinthe
factthatHercules 3501-6isacomplexmixturecontaining not onlyTGDDMandDBSbutalsotwootherepoxiesas wellas aborontrifluoridecatalyst. Asaresult, thecurve
Figure4. PlotsofFi(a) = (1
-a)-1(da/dt)as a function ofa
forthreedifferenttemperatures;unitss"1 x 1000.
of
da/dt
versus a does not clearly show the maximumtypical of an autocatalytic reaction, which eq 5 was
designedto represent.
An attempt was also made to
fit
the data with the semiempirical equationproposed byKamal:28da/dt
=(Kr+ K2am)(1
-a)n (7)
The fourunknownswere determinedsothatthecalculated
and experimental data matched with respect to the
followingfour values: (1) the
initial
value ofda/dt,
as determinedfrom the interceptsinFigure3; (2) amax,the locationofthemaximum valueofda/dt;
(3) (da/dt)™.».the maximumvalue;(4)thevalueof
da/dt
ata = 0.5.Theresultsare shownin Figure5.
At
160°C,an excellentfit
was obtained up to thepoint of vitrification.At
180and200°C,the
fit
wasgooduptoa= 0.5butpoorbeyondthat point. Furthermore, the values of m and n varied
significantly withtemperature,asindicatedinthe figure. Equation7 isthus lessthan ideal for this system.
Analysis
of the Databy
Means of the New Approach. The modeldevelopedintheprecedingpaper involvesa mote rigourous approach thanthosethathavejustbeenapplied. It isamechanistic approachinwhich the Horie modelisextendedtoincludetheetherification
reaction. The conversion of epoxide groups intoether groups isdescribed by thefollowingkineticexpression:
dE_ d[ether] _ „
“dt~
di
-fe^A3
(8)where E, [ether], H, andA3are the concentrationsof
ep-oxide, ether,hydroxyl,andtertiaryamine groups,
respec-tively. The exponents m and n (which should not be
Macromolecules, Vol. 24,No. 11, 1991
Figure5. Resultsobtainedon fittingexperimental data forda/ dtversus a witheq7.
Table II
Different Possibilities fortheEtherification Reaction Mechanism
case featerm m n z natureof reaction 1 EH 1 0 epoxide-hydroxyl, uncatalyzed 2 EH1 2 0 epoxide-hydroxyl,catalyzedby
hydroxyl
3 EHAS 1 1 1.5 epoxide-hydroxyl,catalyzedby
alltertiaryamine groups 4 EHAS 1 1 0 epoxide-hydroxyl,catalyzed
only bytertiaryamine groups
formed in reaction
5 E 0 0 homopolymerization,firstorder inepoxide
6 EA3 0 1 1.5 homopolymerization,catalyzed
by alltertiaryamine groups 7 EAs 0 1 0 homopolymerization,catalyzed
onlybytertiaryamine groups
formedin reaction
scenariosforthe reaction mechanismasshownin Table
II.
Thefirst
corresponds to the case of anepoxide-hydroxylreactionthatoccurs eitherwithoutcatalysisor
withcatalysisbygroups whoseconcentrationisconstant and therefore maybeincorporatedintothe rate constant
*3· The secondis similarexceptthata secondhydroxyl
groupacceleratesthe reaction, givingrisetoan EH?term rather than EH. The
third
and fourth scenarioscorre-spond to an epoxide-hydroxyl reaction catalyzed by
tertiaryaminegroups. In thiscase,adistinctionismade betweenthetertiaryamine groups
initially
present in thesystem (in this case, in the TGDDM resin) and those
produced by the epoxide-amine reaction. The coefficient
Zisdefined2as ZA^/BEq,whereA30andEqare theinitial concentrations of tertiaryamineand epoxide. Onthebasis
Modeling the Cure Epoxy
oftwoTAgroupsforeveryfourTGDDMepoxide groups
(butnone forSU-8) and B= 0.60,Zisestimatedtobe 1.5
forNarmco5208. Case3(withZ= 1.5)includesthesein
the calculation. Case 4(with Zsetto0) assumes thatonly thetertiaryamine groupsproducedinthe epoxide-amine
reactioncatalyze the epoxide-hydroxylreaction. Cases
5-7 correspond to etherificationwithouttheparticipation of hydroxyl groups, i.e., homopolymerization. This is
assumedto occur either bya simplefirst-orderreaction
withrespecttoepoxide(case5)or withtheparticipation
of tetiaryaminegroupsasjustdiscussed(cases6 and7).
The kineticsare describedinterms ofthefollowing two variables: 8 II (-* (9) 2Al+ A2
H
-H0 GO)/3~1
2A10 " 2A10where A\isthe concentrationof primary aminegroups,
Aa is the concentrationofsecondary aminegroups,and the subscript “0” designates the
initial
value of the concentration to whichit isattached. The variable a is the usual overall extentofconversionofepoxide groups.The variable ßisequalto thefraction of primaryamine
N-H
bonds that have reacted with epoxide groups toproduce linkagescontaininghydroxylgroups;thusitisa measure of the extent of the epoxide-amine reaction. Together these two variables cover the two reaction
pathways.
Thekineticequationscan besolved2togivethe following
two equations: =
ß
+ K*3bk [CJ
+ C2d2+ C3In(1+RT'fi
+ C4In(1 -ß)] (11)da/dt
=[ {
+2ß)(1
-ß)+3( +ß +ß2 (1-«)
(12)where
is the rate constant for the epoxide-amine
reactioncatalyzedbygroups
initially
present(including hydroxyl),K2 isthe rate constant forthesame reactioncatalyzedbyhydroxylgroupsformedinthe reaction,K3
isthe rate constant forthe etherificationreaction, Y =
Hq/BEo, and R =
K1/BK2. The coefficients Ci to C4
dependontheparticularvaluesofmandn andare given
in Table
II
oftheprecedingpaper.With
these equations,although
da/dt
cannotbeexpressedanalytically intermsofa, the relationship betweenthe two can be expressed
intermsofa setofcalculated points.
Regardless ofthe particular scenario, there are three
rate constants that must be determined to best fit the experimental datafor
da/dt
as afunctionofa. Because the dependent variableda/dt
cannotbe expressedas a simple function ofthe independent variable a,it
is notpossibletousestandard regression techniquestodetermine
theconstants. Instead,an iterativeprocedurewas used.
After
initial
estimatesforK\,
K2,and K3were chosen,foreachexperimental valueofa the corresponding valueof
j3wascalculatedby numerical solution
ofeqll.
Thevaluesofaandßwere thenusedineq12to calculate
da/di.
The coefficient Y (relatedtotheinitial
hydroxylcontent)wasassumedtobenegligible. The calculatedvaluesof
da/dt
were comparedwiththe experimentalvaluesandthe rate
constantswere adjusted until the calculated and exper-imentalcurves matched according to the following three criteria: (1) They shouldhave thesame value of
da/dt
3104 Coleetal. Macromolecules, 24,No. 11,1991
Figure6. (a,Top)Comparisonofexperimental valuesofda/dtwithcurves calculated accordingtocases1,5,and6ofTableII,for one experimentat180°C. (b,Bottom)Comparisonof experimentalvaluesofda/dtwithcurves calculated according tocases 2-4 and7 of TableII,forone experimentat 180°C.
were obtained by extrapolation,basedon the intercepts
ofthelines givenin Figure
3.(2)
The maximum calculated value ofda/dt
should be the same as the maximum experimentalvalue(butnotnecessarilyat thesame valueofa). (3)The twocurves shouldhavethesame valuesof
da/dt
ata = 0.5. Oncethe threerate constantsthat meet thesecriteriawere found, the overallquality ofthefitwas judged by graphically comparing the calculated andexperimentalsets ofdata.
Figure 6 shows the results for the seven different
scenariosappliedto one setofdata obtained at 180°C.
Threeofthecases,showninFigure6a, gaverather poor fits. These include a bimolecularepoxide-hydroxyl re-action(case 1),uncatalyzedhomopolymerization(case5),
and homopolymerizationcatalyzedbyall tertiaryamine
groups(case6). Oftheremainingcases,depicted in Figure
6b,threegaveagoodfit butone was
virtually
perfect.(Asalready mentioned, the deviation observed forthe first point or two is due to incomplete equilibration ofthe
calorimeter, and the deviationobservedat highvaluesof
a isduetovitrification ofthe resin.) The perfectfit
cor-respondsto case 4,wherethe reactionisfirst-order with
respect to epoxide groups,hydroxylgroups, andthe tertiary amine groups formedin thereaction(butnotthose present
in theTGDDM). Whether the slight differencebetween
this case and theother three in Figure6b is significant
(i.e.,whethercase 4correspondstothe true mechanism)
needs to be confirmed by further experimentation. A
possibleexplanationisgiveninthe nextsection. Because
the case 4mechanism gives the best agreement, it was
used to analyze the data and determine the three rate
constantsfor all18experiments (three ateachofthe six temperatures studied).
Asmentionedabove,the deviationobservedat higher valuesofa(seeFigure6b,case 4) isdue tothevitrification oftheresin. Theeffectsofthisvitrificationare even more evident in Figure 4, where the function F¡(a) shows a
Macromolecules, Vol. 24,No. 11, 1991 Modeling the Cure Epoxy
a
Figure7. “Diffusion factor"obtained bydividing experimental
valuesforda/dtbyvaluespredicted according to chemicalkinetic model. Symbols correspond to experimental points, lines to
regressionfit obtainedwitheq15.
andtheresincross-links, theglasstransitiontemperature
Tg ofthe system rises. When it approaches the curing
temperature, the resinpasses fromarubbery toa glassy
state,themobility ofthereactinggroupsishindered,and
the reaction is controlled by diffusion rather than by chemicalfactors. Various workershaveattempted
math-ematical treatments of thisphenomenon.29"35 Atypical approach31 isto express Tgin termsofa usingDi
Bene-detto’s equation and then to express the
diffusion-controlled rate constantintermsofT-Tgbya Williams-Landel-Ferry typeequation. Thus theoverallrelationship
is rather complex. Chern and Poehlein have recently
proposedasomewhatsimpler semiempiricalrelationship
basedon freevolumeconsiderations.30 When thedegree
ofcure reachesacertaincriticalvalueac,diffusioncontrol
takesover andthediffusion-controlled rate constant K¿
is given by
Ká=
Kcexp[-C(a
-ac)] (13)
whereKc istherateconstant fornon-diffusion-controlled
(chemical) kinetics and C is a constant. This equation
correspondstoaratherabruptonsetofdiffusion control ata = ac. In reality,theonsetissomewhatmore
gradual andthereisa regionwhere both chemicalanddiffusion
controlare significant. According to Rabinowitch,36the overalleffective rate constantKe can beexpressedin terms
ofK¿andKcas follows:
1—L+-L
Ke Kd kc
(U)
Combiningeqs13and14,we can definea“diffusionfactor”
/(a) as follows:
_1_
1+ exp[C(a-ac)] (15)
The effective reactionrateisequal to the chemical reaction
ratemultipliedbythisfactor, which followsan S-shaped curve. Forvaluesofa significantlylowerthanac,f(a) is approximatelyequal to1anddiffusion controlisnegligible.
Whena approachesac,f(a) beginstodecrease,reaching
0.5whena = ac.
Beyond thispoint
it
continuestodecrease,eventually approachingzero,sothatthereactionbecomes very slow andeffectivelystops. In thiswork, data for f(a) were obtained bydividingthe experimentalvaluesof da/
di
bythosepredictedon thebasisofthechemicalkineticmodel. Figure7showsthe resultsforone experiment at
eachtemperature. Thedropoffin rate due to theonset
ofdiffusion controlisobvious. An interestingphenomenon
isobserved athigher temperatures. At200°C, whena is
greater than0.6 the reaction rate increases slightly (by
about 10%)abovethatpredicted by the model,beforeit
dropsoffbecauseof diffusion control.
At
210°C,asimilar effectisobservedbut itismuchmore pronounced. Thisisbelievedtobeduetoanother reaction, not included in
themodel,whichbecomesimportantonly at higher
tem-peratures. Thesame phenomenonhasbeenreported by
Mijovicet al.15foran
MY
720/HT976mixturecuredat210 °C. On the basisof FT-IR results, Morgan et al.10
have suggestedthatat temperatures greater than200°C
two hydroxylgroups combinewithlossofwater to form an ethergroup,andthiscouldexplain theresults. Values
ofCand acineq 15 were determined by applying non-linearregressionto the dataforKe/Kcfortemperatures
between160and200°C. Exceptforthe slight deviation
at 200 °C just mentioned, very good agreement was obtained,as shownin Figure 7.
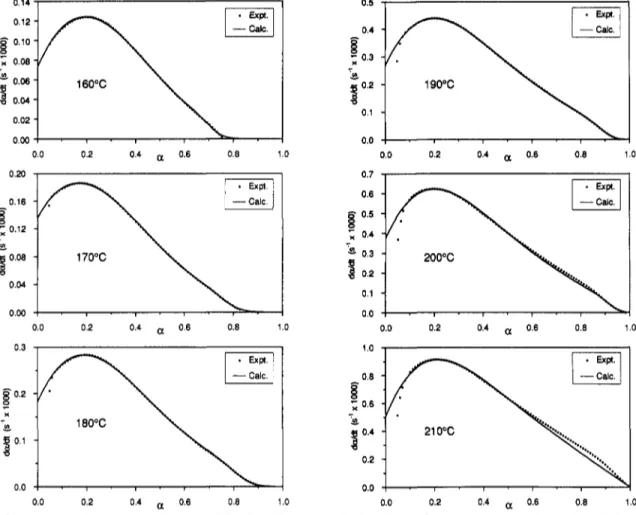
Figure8showsthe resultsforone experiment ateach
temperaturewhenthe experimentalvaluesof
da/dt
are compared tothosecalculated by the model(case4),withthediffusionfactor included. Exceptforthe deviations previously mentioned, the agreementis excellent. The
average constants obtained from the analysis are
sum-marizedinTable
III,
together withthe standard deviations.The corresponding Arrhenius plotsofInKversus 1/Tare
shownin Figure9. Individualdata points forthethree
experiments at eachtemperature are shown in order to
givean indicationofthescatter. Goodlinear correlations are observed,whichlead to theparametersgiveninTable
IV. The activation energies for the X-catalyzed and
hydroxyl-catalyzed epoxide-amine reactionsare 61.4and
72.5 kJ/mol, respectively, while that forthe
etherifica-tionreactionissignificantlyhigherat101.4kJ/mol. These valuesare verysimilartothoseobtained byChiao.21 The
variation ofthe quantitiesacand Cwithtemperatureis
shown in Figure 10. For ac, the relationship can be
consideredlinearwithin experimentalerror, and regression
givesthe following equation (squaredcorrelation
coeffi-cient0.987):
ac= 0.005376T-0.1350 (16) whereTisexpressedindegreesCelsius. Thusthediffusion factor defined ineq 15isalsoafunctionoftemperature. For the coefficientC,thereisconsiderablymore scatter,
andno discernible trend with temperatureis observed.
Theaverage valuefor the experiments from160to190°C
is 30.1 (standard deviation 5.1). Thevalues for200 °C
were not used in the averaging because of the slight
deviationobservedatthistemperature,attributedto the
hydroxyl-hydroxylcondensationreaction.
Summary oftheModel andGeneralDiscussion.
It
hasbeenshownthatan excellent
fit
tothe experimentalDSC dataforthe curingofNarmco5208inthe
temper-aturerange 160-200 °Cisobtained byusingamodel based on the following assumptions: (i) a reaction between
primaryamineand epoxide groups(PA-E) thatproduces secondary amine andhydroxylgroups andthatiscatalyzed bothbygroups
initially
present in theresin(rate constantKi)
and by the hydroxylgroups formed inthe reaction(rate
constant^);
(ii)asimilarreaction between secondaryamine and epoxide groups(SA-E),whoserateconstant is
one-halfofthat forthe previous reaction; (iii)areaction
between epoxide andhydroxylgroupsthatiscatalyzed by
the tertiaryamine groups formed in the SA-Ereaction (rateconstantKz);(iv)adiffusion control correction factor
for which a semiempirical equation is given and which
becomes important when the degree of conversion
ap-proachesacertaincriticalvalueac,whichisdependenton the temperature.
Cole et Macromolecules, Vol. 24,No. 11, 1991
0.14
0.0 0.2 0.4 0.6 0.8 1.0 0.20
0.0 0.2 0.4 0.6 0.8 1.0
Figure8. Comparisonofexperimental valuesofda/dtwith control, forsix temperatures.
0.0 0.2 0.4 0.6 0.8 1.0
calculated according to the proposed model,including diffusion Table III
AverageConstants(withStandardDeviationsin Parentheses)for theProposed Model*
temp, “C Ki,s'1 X1000 Ki,s"1X 1000 K3,s'1 X1000 «C C
160 0.134(0.011) 1.232(0.057) 0.062(0.008) 0.725 (0.012) 34.7(7.2) 170 0.238 (0.014) 1.682(0.056) 0.112(0.007) 0.779 (0.002) 26.7(1.2) 180 0.321(0.026) 2.750(0.053) 0.218 (0.023) 0.827(0.005) 27.0(2.0) 190 0.474 (0.025) 4.199(0.235) 0.444(0.070) 0.898 (0.016) 31.9(4.3) 200 0.602 (0.026) 6.288(0.231) 0.637(0.061) 0.934(0.020) 40.6 (9.0) 210 0.836 (0.004) 9.503(0.037) 1.130 (0.038) «Valuesin
parentheses correspond to standard deviationsbasedon threedeterminations.
Theprogressofthepolymerizationisdescribedin terms
oftwoparameters,a and ß. The
first
(a) is the overalldegreeofconversionasexpressedin terms ofthefraction
ofepoxidegroups reacted. Thesecond (ß) isthefraction
of amine
N-H
bonds that have reacted. These twoquantitiesarecloselyinterrelatedandtheirevolutionwith
time isgiven by the followingequations:
ß/dt
=[(K,
+)(
-ß)](1 -<x)f(a,T) (17)da/dt
=[B^
+2ß)(
1-ß)
+Kg/fKl
-a)f(a,T) (18)where thediffusioncontrol factorf(a,T) is givenby f{a,T) =
[1+ exp(30.1a + 4.06
-0.1617T)]"1 (19) with Texpressedindegrees Celsius. Equations17and18 correspondto case 4ofthe general model (m= =
1)with
Y= Z= 0. Equation19isobtained by combining
eqs15
and 16. If the reaction is carried out at constant tem-perature, therelationshipbetweena andßisdescribedby
eq 11. ThequantityBistheratio ofamineN-H bonds to epoxide rings, and fora typical lot ofNarmco 5208it isequalto0.60. Also,theinitial degreeofconversionao in Narmco5208isnotzero becauseofresinadvancement
duringthemanufacturingprocess(B-staging) and possibly
duringsubsequenthandling. Typicalvaluesforanewly
received batch are ao = 0.038 and ß = a0/B = 0.063.
Accuratevaluesmaybedeterminedforagivenbatch by physicochemicalanalysis.
The three rate constants obeythewell-known Arrhe-nius relationship
= A¡
exp(-E¡ú/RT) and may be
calculatedfrom the parameters giveninTableIV.
The amountofheat produced by 1gofNarmco5208
resinon goingfroma = 0toa = lis 645J. Thisis based
on the true resinweight,exclusiveofvolatile components (solventandmoisture).
Somediscussionisin orderconcerningtheassumptions
ofthe model. Assumption ii referred to above implies
thatthe secondary amine groups showthesame reactivity
withrespecttoepoxideastheprimaryamine groups.This importaint questionhasbeenextensively studied,andthe results have been summarized by various authors.4-26’37 While many ofthe experimental values that have been
reportedfor this ratioare closeto0.5,others are
signif-icantlylower, especially inthecase ofaromatic amines.
However,as was recently pointedoutbyCharlesworth,38
Macromolecules, Vol. 24,No. 11,1991
Figure9. Arrhenius plots for therate constants determined
from theanalysis.
150 160 170 180 190 200 210 Temperature (°C)
Figure 10. Dependenceof«„andthecoefficientC (eq 15)on
temperature, T.
Table IV
Arrhenius ParametersfortheProposedModel
rateconst,
a-1_InA_£,/£,
K£„
kJ/molK, 8.243 7389 61.4
K2 13.36 8719 72.5
K3 18.53 12221 101.4
solutionsinalcohol, anditisknownthatalcohols havea strongcatalytic effecton epoxideringopeningreactions.
Hence the situation in alcohol solution may be quite
differentfromthatinbulkmixtures involvingno solvent.
Infact, data obtained byCharlesworth37-38and by other workers39·40on bulkmixturesofepoxyresin and aromatic
Modeling the Cure Epoxy
Figure 11. Structure of thecross-linked polymer formedby
reaction betweenTGDDMandDDS.
amines suggest that the assumption ofequal reactivity
can bequite valid in such cases. In the specificcase of
TGDDMand DDS,asmentionedintheIntroduction,there
are conflictingresultsintheliteratureandthe question
willonly beresolved throughfurther work.
Assumptioniii impliesthattheetherificationreaction
proceeds through a ternarycomplex involving epoxide,
hydroxyl, andtertiaryaminegroups. Thisisnot
unrea-sonable, since bothhydroxyland tertiaryaminegroups
are knowntoacceleratetheetherificationreaction.41"44In
fact it is the same type of complex proposed for the hydroxyl-catalyzed epoxide-amine reaction, exceptthat
whentheaminegroupbearsahydrogen atom the reaction
followsadifferentpath.
It
is interesting,however, thatthebest
fit
to the experimental data isobtainedif
it
isassumedthatthetertiaryaminegroupsproducedinthe
reaction are more effective in catalyzing the etherifica-tionthanarethoseinitiallypresentintheTGDDM. Figure
11 shows the structure of the polymer formed by the
TGDDM-DDS reaction. The tertiary amine groups formedinthe reaction originate from the DDS and are attachedtoa phenylring withan SO¡group inthe para position. Thegroups
initially
present, however,are intheTGDDMand are attachedto a phenyl ring with a GHz groupinthe para position. Thestrong effectofsuchgroups
on kinetics,even though theymaybefarfrom thereactive
site,is well-known. Forexample, Tanakaet al.42found
thatthe rateofreactionofthe epoxy compound phenyl glycidyl ether with different substituents in the para positionvariedbyafactor of4. Thus
it
isnotunreasonableto postulatethatthe two typesof tertiaryaminegroups
showninFigure 11might havewidelydifferent
reactiv-ities, given thedifferentelectronicnatureoftheSO2and
GHz groups. If thisis thecase, though, it is
difficult
toarguethatthetertiaryamine groupsfrom theDDSshould
bemore active, becausethe electron-withdrawing nature
oftheSO2groupswouldbe expectedto makethemless
nucleophilic. A more plausible explanation may exist
based on steric arguments. The newly formed tertiary
amine groups are located in a position wherethey can bring about intramolecular catalysis ofreactionsofthe remainingepoxidering,asshownat thebottomofFigure
11. Dusek andMatéjkahave usedthisargument to explain
the apparentenhanced reactivity ofthesecond epoxide ringin N^V'-diglycidylamines.46·46 Theirdetailed study
of NJV'-diglycidylaniline showed that intramolecular
etherificationissignificantandoccurs faster than the in-termolecularreaction. Similarresultshave beenobtained byothers47and
it
hasbeen suggestedthatintramolecular reaction and ring formationare quite important in theTGDDM-DDSsystem.11 Theseargumentsprovidesome support forassumptioniii ofour model.
Although vitrification was found to have a profound effecton the kinetics,no effectswere observedthatmight
3108 Coleet al. Macromolecules, 24, 11, 1991
Figure12. Calculatedcurves forda/dtas afunctionofaat180
°C, showing the separatecontributionsfromthePA-E, SA-E,
andOH-Ereactions.
bedue to gelation, whichoccurs at lower valuesofa.
It
may be that because the epoxide-amine reaction ispredominantbeforegelationandetherification afterward, the corresponding rate constants reflect thestateofthe resin ateach stage. However,
it
ismore likelythat,ashasbeen suggested by others, diffusion control becomes
important only on
vitrification
and not on gelation.48·49It
is interesting to compare our results withthose of Chiao.21 Inbothcases,agoodfitwas obtained by varying threerate constants,oneofwhich corresponds to theether-ification reaction. However, the assumptionsmade are
different. In our case, we assume equal reactivity of
primaryand secondary amine groups;thismakesitpossible
topartlysolvethekineticequationsand developcertain analyticalexpressionsto model thecure. InChiao’scase, heassumes afixed value for theratiooftherateconstants
forhydroxyl-catalyzed and noncatalyzed amineaddition, on thebasisofresultsobtainedon adifferentepoxy amine
system. Thisisquestionablebecausethe “noncatalyzed”
reaction, at leastin thecase ofcommercial materials,is
generallyacknowledgedto involvecatalysisbyimpurities
present in theresin,andtheirtypeandconcentrationmay vary substantially fromone systemtoanother. Thus both treatmentsare subject tosome question,andthe factthat
agoodfit isobtainedinbothcases suggeststhattheDSC
dataare not greatly sensitive to either. Onlyfurtherwork
will
determine which approach is more valid for theTGDDM-DDS system.
Twofactorshave beenneglectedinour treatment, which mayhavesome influenceon theresults. Thefirst isthe
presence oftheminor epoxy resininNarmco 5208;
it
isknown tobesomewhatmore reactivethanthe majorresin.3
Thesecondisthepresencein the kinetics equationsofthe
coefficient Y,whichisrelatedto the concentrationof
hy-droxylgroups
initially
present in theresin. In thisworkitwas assumedtobenegligible,as no experimentalvalue
was available. It would be interesting to further refine themodel by doingastudyofthe binaryTGDDM-DDS
system in which the
initial
concentration of hydroxylgroups isdetermined and includedin themodel.
Calculated
Results.With
theproposed model,it
ispossible to perform calculations in order to better
un-derstand how the system behaves in different
circum-stances. Forexample,Figure12showsthe predictedcurve
for
da/dt
as afunction ofa forisothermal curingat 180°C, including the effects Of vitrification, which occurs aroundac = 0.83. Thecurve isdecomposedtoshowthe
contributions from the threedifferentreactionsinvolved,
namely,PA-E,SA-E,andOH-E. Thefigureclearlyshows
why the approximation mentioned earlier,in which the
30 60 90 120 150 180 210 240 Time (min) -b 0.8 -LU
Í
0.6 -$I
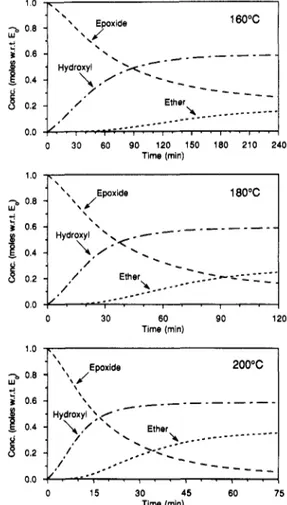
0.4 -J 0.2 -0.0 \ Epoxide\z
Hydroxyl x / / Ether/
>.-180°C 30 60 Time (min)Figure13. Calculated concentrationsofepoxide,hydroxyl,and ether groupsas afunctionoftimeforisothermalcuring at160, 180,and200°C.
reactionisseparatedintotwodistinctstages, isnot really
applicable. Thegeneralbehavioristhesame regardless
ofthetemperature. Fora = 0-0.2theOH-E contribution
isnegligible and theapproximationisvalid. Between0.2
and0.8,however,allthreereactionsare significant. From
0.2to0.6,the epoxide-aminereactionsare more important than the OH-E reaction.
At
a = 0.6thePA-E
reactionbecomesnegligibleandthe OH-Ereaction becomesthe
most important. Finally, at a around 0.8, the SA-E reactionbecomesnegligible. Only then couldeq 6serve as a goodapproximation, but
it
cannotbe usedbecausein the realsystemvitrificationoccurs near this pointand
the reactionbecomesdiffusion-controlled. Thus,inspite
ofthe significant difference inactivationenergyforthe amine and etherification reactions, the two cannot be
clearlyseparatedintime. Thisdescriptionofthecuring
process isingeneral agreementwiththefindingsofMorgan
and MonesforTGDDM-DDS,asillustratedin Figure10
ofref 11.
It is also possible to predictthe evolutionofthe cure
withtime, by applyingeqs17and 18 on an incremental
basis. The concentrationsofthedifferentspeciescan be
calculatedfroma andßbymeans oftheequations given in the preceding paper.2 Figures 13 and 14 show the predicted concentrations of the different species as a
function oftimefor isothermal curingat 160,180,and200
°C. In all threecases,thereis a“turning point”around a = 0.45. This occurs after71 min at 160°C,30min at
180°C,or 14min at 200°C. At this point, over 90% of
the primary amine groups have disappeared but ether
formationisjust starting tobecomeimportant. However,
theSA-E reaction, whichproducestertiaryamine groups,
Macromolecules, 24, 11, 1991
Time (min)
Figure14. Calculatedconcentrationsofprimaryamine (PA), secondary amine (SA), and tertiary amine (TA) groups as a
function of time for isothermal curing at160,180, and200°C.
effectoftemperatureisthat,beyond theturningpoint, at higher temperatures theconversion ofepoxideto ether
proceedsfaster and to a greater extent.
At
160°C, thecriticalvaluefor diffusion control(ac = 0.72) isreached
after218min.
At
this point,58% ofthe epoxide groups havereactedwithamine,14% have reactedwithhydroxyl,and 28% remain unreacted.
At
180 °C, ac (=0.83) isreached after 117 min, at which point 59% of epoxide
groups have reactedwithamine, 24% have reactedwith
hydroxyl, and17% are unreacted. Finally,at200°C,ac (=0.94) is reached after 73 min, where 59% ofepoxide
groups have reactedwithamine, 35% have reactedwith
hydroxyl,and6%are unreacted. Thus at thepointwhere
vitrification slows down the reaction significantly, the epoxide-amine reactionis
virtually
complete,regardless oftemperature, but theepoxide-hydroxyl reactionisonly partiallycomplete. Athigher temperatures, more ether linkagesare formed,asexpected. After vitrification,the cure proceedsatan ever-decreasingrate,sothatcomplete cure may notbeachieved. Aftertwice the time required toreachac,thedegreeofcure iscalculatedtobe78% at160°C, 89% at 180 °C,and 98% at 200 °C.
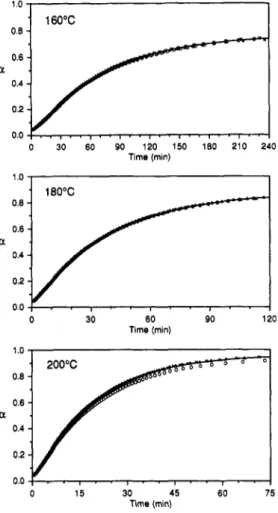
Finally,toillustratethe overallaccuracyofthemodel, Figure 15 shows the evolution ofa with time at three
differenttemperatures, comparingthebehavior predicted by the general model with the results for the three
individual DSC experiments.
Conclusion
Amechanistic modelhasbeen proposedfor the kinetics
ofpolymerizationofNarmco5208,whichconsistsmainly
oftheepoxy resinbis[4-(diglycidylamino)phenyl]methane
Modeling the Cure Epoxy
Figure IS. Evolutionofa with time at threedifferent
tem-peratures, as predicted by the general model (line) and as
measuredin three separate DSC experiments(O, X,
).
(TGDDM) and theaminehardener bis(4-aminophenyl)
sulfone (DDS). This model represents a significant
improvementover muchofthepreviouslypublished work
inthat
it
explicitlytakesintoaccountboththeepoxide-amine reactions and the subsequentetherificationreaction.
The kineticsare completelydescribed interms ofthree
rate constants,whichwere determined tofitthedata.The
best fit was obtained on the assumptionthatthe
ether-ificationreactionis catalyzedby thetertiaryamine groups
formed in the epoxide-amine reaction; further experi-mental workisrequiredtoconfirmthis. Therate constants obeythe Arrhenius relationship and values ofthe pre-exponential factor A and the activationenergyE& have
beendetermined. Theseare specific to the Narmco5208
system,butthegeneralapproach couldbeapplied toany
amine-curedsystem.
Apartfromthe three rate constants,no otherparameters were varied to
fit
thedata. The amine-to-epoxideratioBwas assignedavaluedetermined by independentmeans
(liquidchromatography) andwas not varied as in some previouswork.5 Furthermore, the kineticswere assumed
tobe
first
orderwithrespecttoall participatingspecies, andit
was notnecessarytointroduce nonintegerexponentsasin the widelyusedeq7. Although themodelisthusless
empirical than previousones, it givesan excellentfit to the experimental data for all values of the degree of conversionaup to thecritical pointwherethe resinvitrifies
andthe reactionbecomesdiffusion-controlled. Todescribe
the cure in this region, a diffusion factor has been
introducedon thebasisofacombinationoftwo equations
proposedby otherworkers.30-36 Withthe inclusionofthis factor, it ispossibleto calculatewithexcellent precision thedegreeofconversionover thewhole rangeofcure and