Publisher’s version / Version de l'éditeur:
Journal of Advanced Concrete Technology, 2, 1, pp. 113-120, 2004-02-01
READ THESE TERMS AND CONDITIONS CAREFULLY BEFORE USING THIS WEBSITE.
https://nrc-publications.canada.ca/eng/copyright
Vous avez des questions? Nous pouvons vous aider. Pour communiquer directement avec un auteur, consultez la
première page de la revue dans laquelle son article a été publié afin de trouver ses coordonnées. Si vous n’arrivez pas à les repérer, communiquez avec nous à [email protected].
Questions? Contact the NRC Publications Archive team at
[email protected]. If you wish to email the authors directly, please see the first page of the publication for their contact information.
NRC Publications Archive
Archives des publications du CNRC
This publication could be one of several versions: author’s original, accepted manuscript or the publisher’s version. / La version de cette publication peut être l’une des suivantes : la version prépublication de l’auteur, la version acceptée du manuscrit ou la version de l’éditeur.
Access and use of this website and the material on it are subject to the Terms and Conditions set forth at Effect of drying methods on microstructural changes in hardened cement paste: an a.c. impedance spectroscopy evaluation
Beaudoin, J. J.; Tamtsia, B. T.
https://publications-cnrc.canada.ca/fra/droits
L’accès à ce site Web et l’utilisation de son contenu sont assujettis aux conditions présentées dans le site LISEZ CES CONDITIONS ATTENTIVEMENT AVANT D’UTILISER CE SITE WEB.
NRC Publications Record / Notice d'Archives des publications de CNRC:
https://nrc-publications.canada.ca/eng/view/object/?id=0d6e3622-57c1-4290-9a1f-cf9c5b1a64e9 https://publications-cnrc.canada.ca/fra/voir/objet/?id=0d6e3622-57c1-4290-9a1f-cf9c5b1a64e9
Effect of drying methods on microstructural changes in hardened cement paste: an a.c. impedance
spectroscopy evaluation
Beaudoin, J.J.; Tamtsia, B.T.
NRCC-46911
A version of this document is published in / Une version de ce document se trouve dans : Journal of Advanced Concrete Technology, 2, (1), pp. 113-120, Feb, 2004
THE EFFECT OF DRYING METHODS ON MICROSTRUCTURAL
CHANGES IN HARDENED CEMENT PASTE: AN A.C. IMPEDANCE
SPECTROSCOPY EVALUATION
James J. Beaudoin1 and Basile T. Tamtsia1
1
Institute for Research in Construction, National Research Council of Canada Ottawa, Canada, K1A 0R6
ABSTRACT
The effect of three pre-drying treatments on time dependent deformation due to drying of cement paste conditioned at (96 ± 2) % relative humidity and temperature of 22 ± 2 °C was investigated using a.c. impedance techniques.
The treatments comprised methanol and isopropanol exchange (followed by vacuum heating at 37°C) and vacuum drying at 37°C alone. Re-saturation with synthetic pore fluid was performed prior to the drying experiment.
Real-time changes in microstructure were followed using impedance spectroscopy.
Cement paste specimens were in the form of “T-shaped” columns with a minimum thickness value (for the web and flanges) of less than 1.2 mm. The impedance spectra for the untreated (control) specimens and the specimens dried at 37°C indicated the presence of an intermediate arc. This is discussed in terms of interfacial phenomena associated with collapse of C-S-H structure on drying.
1. Introduction
Despite the extensive number of publications on deformation of cement paste due to drying no satisfactory theory for the time-dependent processes responsible for drying shrinkage has been universally accepted (Young 1974; Yumping and Jennings 1992). An excellent review of the mechanisms of drying shrinkage is provided by Neville (1970). There remains however, varied opinion concerning the role of water in the drying shrinkage process.
Recently electrical methods e.g. a.c. impedance spectroscopy have shown promise as tools for characterizing microstructural development in cement-based materials (Von Schwiedler 1907; Jonscher 1975; Alford and Double 1982; Dalgliesh et al. 1982; MacDonald 1987; Tashira and Shimamura 1987; McCarter et al. 1988; McCarter and Garvin 1989; Brantervik and Niklasson 1991; Christensen et al. 1992; Xu et al. 1993; Gu et al. 1993; McCarter and Curran 1994; Gu et al. 1994a, 1994b, 1995; Beaudoin et al. 1998; McCarter et al. 2001). The objective of the present study was to obtain real-time descriptions of microstructural change during shrinkage of cement paste through the coupling of time-dependent deformation and impedance measurements. In addition pre-treatment of cement paste with organic solvent was used given their valuable contribution for a creep and shrinkage investigation in providing a fundamental understanding of the role of C-S-H. These experiments based on various cement microstructures obtained from pre-drying treatments were designed to further understanding of drying shrinkage mechanisms in cement-based materials. The time-dependent deformation due to creep results are not discussed in the present paper.
2. Experimental Program and Methods
2.1 Specimen Preparation and Characteristics
The hydrated cement paste used for this experimental study was made with type 10 Portland cement mixed with de-aired distilled water at a w/c = 0.50. The Portland cement had the following composition in percent: SiO2 (20.72); Al2O3 (5.87); Fe2O3 (3.07); CaO (62.66); MgO (3.46); SO3 (2.18); free lime (0.24); K2O (0.94) and Na2O (0.36) or a total alkali content of 0.98 %. The Bogue composition was as follows: C3S (46.5); C2S (24.6); C3A (10.4) and C4AF (8.3). The fineness of the cement was 340 m2/kg. Vacuum mixing was carried out in hollow perspex cylinder 30 mm in diameter and 80 mm in length. Mixing of the paste was carried out using a magnetic stirrer placed inside the cylinder and the latter was placed between two large magnets (Sereda and Swenson 1967). This ensured homogeneity. The cylinders were slowly rotated while the paste hardened in order to avoid bleeding, resulting in a homogeneous product. Specimens were demoulded after 24 hours and stored in lime water at 22°C for up to two years.
The resistivity of the pore solution extracted from the saturated cement paste at the age of 2 years was about 35.2 Ω.m. The compressive strength at 28 days was 34.5 MPa. The samples were fabricated from paste cylinders in order to obtain a “T-shaped” specimen about 1 mm thick with a height of 25.4 mm and a flange width of 5.72 mm. A special jig was constructed to facilitate the cutting of the specimens with a precision saw. The shape of the specimens was chosen to facilitate other tests including creep measurements.
The drying of hydrated Portland cement paste was the subject of considerable debate in the 1960’s and 1970’s due to its relevance to the development of models for the structure of C-S-H (Feldman 1971). A primary issue was whether or not water was capable of re-entering the layered structure subsequent to drying. This had not only structural implications but also relevance to the validity of applying classical sorption theory to the cement paste – water system.
Control Samples
Samples were saturated surface dry and directly used for test without any further treatment. The following experiments were conducted with the control specimens.
• Shrinkage measurements from saturation to about (96 ± 2) % relative humidity and temperature of 22 ± 2 °C.
• Real time a.c. impedance spectra determination associated with the shrinkage test.
Pre-Drying Treatments
The initial pore solution conductivity was determined by extracting pore fluid from the cement paste using a hydraulic press and collecting it in a syringe. Measurements were taken using a conductivity probe. A synthetic pore solution was prepared using saturated lime water to which potassium chloride was added to obtain the same resistivity as that of the pore solution of the cement paste.
Treatment 1 (Drying at 37°C): Samples were initially saturated surface dried, vacuum dried at 37°C for 24 hours (Soft-drying) and then re-saturated under vacuum for 18 hours. Prior to the re-saturation process, the samples were vacuum dried at room temperature for 3 hours in a desiccator at 1 x 10⁻⁴ mm Hg.
Treatment 2 (Methanol Exchange): Water saturated samples were soaked in methanol for 48 hours, vacuum dried at 37°C for 24 hours (Soft-drying), then re-saturated under vacuum for 18 hours. Prior to the re-saturation process, the samples were vacuum dried at room temperature for 3 hours in a desiccator at 1 x 10⁻⁴ mm Hg.
Treatment 3 (Isopropanol Exchange): Water saturated samples were soaked in isopropanol for 48 hours, vacuum dried at 37°C for 24 hours (Soft-drying), then re-saturated under vacuum for 18 hours. Prior to the re-saturation process, the samples were vacuum dried at room temperature for 3 hours in a desiccator at 1 x 10⁻⁴ mm Hg.
The same experiments were conducted for all the pre-dried and re-saturated specimens (three treatments) as were carried out for the untreated control samples.
2.3 The Relevance of Solvent Exchange Techniques
Several studies of the microstructure of cement paste describe solvent exchange with methanol as a technique that “preserves” the wet-state structure of the material (Litvan 1976; Parrott 1983). For example, large decreases in surface area do not result subsequent to the removal of methanol. An implicit assumption in these studies is that the solvent does not interact with C-S-H. This may not be correct (Beaudoin 1987). The “preservation” capacity of the solvent exchange process is relevant to drying shrinkage investigations as the “in-situ” microstructure may be more closely approximated.
Complete drying does not occur in practice. The accompanying collapse of the C-S-H structure due to water removal is therefore more moderate.
The “preservation” of C-S-H structure on drying is also influenced by the rate of drying. Powers (1954) reported that even a slow drying of a cement paste to 79% RH increases its water permeability 70 times suggesting the effect would be even greater if drying to equilibrium at a lower humidity had occurred. Studies by Parrott (1981) on the effect of drying history upon the exchange of pore-water with methanol corroborates Powers observations and suggests that drying even to intermediate humidities causes a partial collapse in the smaller pores and a corresponding increase in the volume of the largest pores. This supports the assumption that the total porosity is relatively constant and that only the pore size distribution is altered.
2.4 Impedance Behavior of Cementitious Materials
Impedance spectra recorded over a wide range of frequencies (from 15MHz to 1Hz) have provided new information and insight on cement paste microstructure and hydration. An idealized impedance spectrum for a cement system is plotted in the real versus imaginary plane (Fig. 1a). A single arc in the high-frequency range with a small part of a second arc in a relatively low-frequency region is shown. It is suggested that the high-frequency arc (HFA) is attributed to the bulk paste impedance behavior and the second arc is due to the cement paste-electrode surface capacitance contribution (Gu et al. 1994a). The intercepts R1 (at the high-frequency end, at c. 7 MHz – 20 MHz) and R1 + R2 (at the minimum between the electrode arc and bulk arc, at frequency c. 100 kHz) are important parameters providing information related to cement paste microstructure. Interpretation
of an impedance spectrum (IS) usually involves modeling with an equivalent circuit (Fig. 1b) until the electrical response of the elemental microstructure of the cement paste is well simulated.
Cement-based materials generally contain a broad size distribution of conducting pores (Von Schwiedler 1907; Jonscher 1975). The network of these conducting pores continuously changes during the drying process (Alford and Double 1982; Dalgliesh et al. 1982; MacDonald 1987). This change can be detected in a.c. impedance spectra (Alford and Double 1982; Dalgliesh et al. 1982; MacDonald 1987; Tashira and Shimamura 1987; McCarter et al. 2001). In very dry materials the content of electrolyte is not large enough to cover the internal pore surfaces, Brantervik and Niklasson (1991). Hence the geometry of the conductive network is changed depending on broken links in the original network. Christensen et al. (1992) found the cement paste to be a complicated composite conductor because its microstructure and the conductivity of its pore fluid are interrelated and time-dependent. McCarter et al. (1989) state that only the free capillary water in mortar samples, oven dried at 70°C for 24 hours, is removed and the removal of adsorbed water would require a higher energy input to remove it from the gel surface. In such mortar samples the water adsorbed by capillary suction forces has been shown to have a significant influence on the electrical response.
Previous investigations (Xu et al. 1993; Gu et al. 1993; McCarter and Curran 1994) have indicated that impedance behavior of the hydrating Portland cement systems depends upon the ionic concentration of the pore solution and porosity. The high frequency arc diameter (or chord), R2, has been shown to be an inverse function of porosity, mean pore size and ionic concentration of the pore solution. In practice, an ideal semi-circle is
generally not observed in most materials. It is normally an inclined semi-circle with its center depressed below the real axis by a finite angle referred to as the depression angle. This behavior normally associated with a spread of relaxation times (McCarter et al. 1988) cannot be described by the classical Debye equation employing a single relaxation time (MacDonald and Johnson 1987; Gu et al. 1994b). A dispersive, frequency-dependent element or so-called constant phase element (CPE) (Cole and Cole 1941; Sluyters-Rehbach and Sluyters 1990; Scuderi et al. 1991) can be introduced in the circuit analysis to account for the shape of the depressed complex plot.
A.C. impedance studies have also demonstrated a pore coarsening effect on drying (Beaudoin et al. 1998). The impedance spectra for cement paste (w/c = 0.30) re-saturated with synthetic pore solution subsequent to cycles of wetting and drying undergo a systematic decrease in the size of the high frequency arc to lower resistance values (Fig. 2) suggesting an increase in the mean pore size. The pore coarsening effect was confirmed by mercury intrusion data.
The microstructural “preservation” effect (including pore coarsening phenomena) of the solvent exchange process is useful for studying the varying degrees of microstructural collapse in the drying shrinkage process. In addition the exchange process affords the opportunity of examining the “dry-state” (obtained through different procedures) and following re-saturation its effect on drying shrinkage.
2.5 Detail of Coupled A.C. Impedance – Shrinkage Measurement System
The a.c. impedance-shrinkage spectral responses were carried out by connecting the “T-shaped” specimens to a Solartron 1260 frequency response analyzer. Details are given
elsewhere (Tamtsia and Beaudoin 2000). The specimen shape was chosen to facilitate attainment of drying equilibrium in a reasonable time. In addition the shape was compatible with a specimen design for creep experiments conducted by the authors. The microstructural changes were continuously monitored in a controlled relative humidity environment as the time increased. Prior to the experiment, air in the controlled chamber was flushed out and replaced by nitrogen.
3. Results and Discussion
DTGA curves were obtained using a Dupont 951 Thermal Analyzer. The DTGA curves for the control specimens and those subjected to the three pre-treatments as described in section 2.2 are presented in Figure 3. DTGA curves for D-drying (vacuum dried at 105°C for 3 hours) and Soft-drying (vacuum dried at 37°C for 24 hours) samples are also presented in Figure 3 to provide an indication of the state of water in the specimen before the re-saturation. The appearance of two low temperature peaks (at about 50°C and 105°C) has been associated with the presence of bulk pore water and interlayer water (Feldman and Ramachandran 1971). The control sample exhibits two peaks at these temperatures. Two peaks can also be discerned for each of the pre-treated samples. They are much broader. The peak at the higher temperature appears to have shifted to a lower temperature i.e. about 75°C. The pre-treatment (heat or solvent exchange) appears to have perturbed the C-S-H structure. Removal of interlayer water appears to begin at a lower temperature. Peak if any observed in the 165-205°C range is generally attributed to ettringite or iron-substituted ettringite (Sha, O’Neill and Guo 1999).
It can also be observed that the hydrated cement paste sample that has been vacuum dried at 105°C for 3 hours (D-drying) will lose a larger amount of water than the sample that has been vacuum dried at 37°C for 24 hours (Soft-drying). The variation of mass change is similar for both drying methods up to 105°C. From 105°C to about 180°C the derivative change indicates that the D-drying may have a greater effect on the structure of C-S-H than Soft-drying. A comparison of the TGA results for the D-dry (vacuum dried at 105°C for 3 hours) specimen to those for the specimen vacuum dried at 37°C for 24 hours (Soft-drying) indicates that the latter contains 2.2% (based on ignited weight) more water than the former at 180°C. The curves for the saturated specimens (control and three pre-treatments) all display significant changes in the derivative values. The significance of these curves is discussed later.
The relevance of the different pre-treatments lies in the degree to which water is removed below the monolayer level and to its implication for volume change.
The drying shrinkage strain-time curves for the cement paste specimens (w/c = 0.50, stress-strength ratio = 0.30) at 96% RH are presented in Figure 4. The total shrinkage strain in the first 20 hours is lower for the saturated control specimens than for the specimens re-saturated after being dried by heating or solvent exchanged with methanol plus heating. Lowest shrinkage was obtained for the isopropanol exchanged specimens. The total strain at 120 hours is 150, 170, 275 and 300 µε for the isopropanol exchanged, control specimens, those dried at 37°C and those solvent exchanged with methanol respectively prior to re-saturation with pore solution. The increase in total shrinkage deformation of the dried (37°C) or methanol exchanged specimens may be partly due to the pore coarsening effect. However, substantial evidence has been presented that
indicates methanol perturbates (interacts with) the solid (Beaudoin 1987). Nevertheless the collapse of the C-S-H structure on drying prior to re-saturation may occur to a lesser extent for pastes that have undergone methanol exchange. This may be a reason for the higher strain values observed. Isopropanol exchange does not appear to “preserve” the structure. The shrinkage behavior of the re-saturated cement paste in the first five hours is similar for the control and all drying pre-treatments (Fig. 4).
Descriptions of drying shrinkage mechanisms often correspond to conceptions or models of the calcium silicate hydrate microstructure (Ramachandran et al. 1981). Powers (1968) has suggested that shrinkage of cement paste is caused by capillary meniscus effects and a diffusion of the adsorbed water to regions of lower vapor pressure. This view is based on the assumption that cement paste is a microporous ‘gel-like’ material. Movement of water is an intrinsic feature of the mechanism. Feldman (1972) has suggested that shrinkage involves the gradual crystallization or aging of the layered C-S-H leading to an increased amount of layering.
A characteristic of the water sorption isotherm for cement paste is that the desorption branch (in the high humidity region) is less steep than the adsorption branch as a result of the large secondary hysteresis (Brunauer et al. 1958; Feldman 1968, Baroghel-Bouny et al. 1999). The amount of water desorbed at 96% RH is only about six percent of the D-dried mass of the cement pastes. Most of the capillary pores continue to contain some bulk water. Those pores that empty would still have adsorbed films on their surfaces. Impedance spectra are readily obtained when equilibrium is attained at 96% RH as the system is still effectively percolated. The objective of choosing a test humidity of 96% RH was to provide a test environment for shrinkage measurements that focuses only on
capillary effects. Changes in the spectra are readily detected during the equilibrium process. It is well known that the menisci do not completely rupture until about 45% RH where there is a marked effect in the length change desorption isotherm due to elastic rebound (Ramachandran et al. 1981).
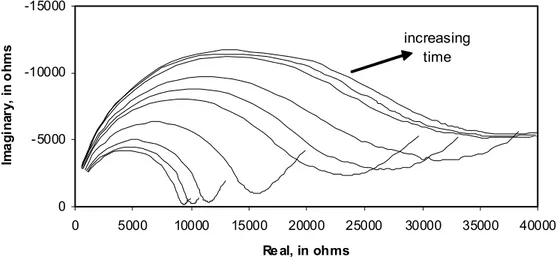
A.C. impedance spectra (real-time) were obtained at 96% RH for the cement paste specimens undergoing drying shrinkage for all the pre-treatment conditions. The magnitude of the high frequency resistance (HFR, R1) and the size of the high frequency arc diameter (HFA) in saturated specimens have been attributed to the properties of the pore solution, pore size and pore network (Xu et al. 1993; Gu et al. 1993; McCarter and Curran 1994). Only the information provided by the HFA will be presented and discussed in this paper. Figures 5-8 are Nyquist plots for the shrinkage-time response of all the specimens. The size of the high-frequency arc increases with time (up to 72 hours) for all pre-treatments. The growth of the high-frequency arc is also consistent with loss of moisture accompanying shrinkage. About six percent (by mass of D-dried paste) capillary water is lost at 96% RH.
The growth of the high-frequency arc diameter at 72 hours for all the specimens subjected to the four pre-treatments is in the following order: untreated > isopropanol exchanged > methanol exchanged > drying at 37°C. The shrinkage strain (Figure 4) was in the following order: methanol exchanged > drying at 37°C > untreated > isopropanol exchanged. These results are consistent with the relative pore coarsening effects (described earlier) due to the pre-drying treatments. This is reflected in an increase in the volume of capillary pores. The fact that the methanol exchanged specimens and those pre-dried at 37°C exhibited the smallest arcs and largest total strains suggests that pore
coarsening affects these samples to a greater extent. Pore coarsening and subsequent re-saturation reduces overall resistivity relative to the untreated specimen (Beaudoin et al. 1998). Recall that it is the capillary pore system only that remains partially saturated at 96% RH.
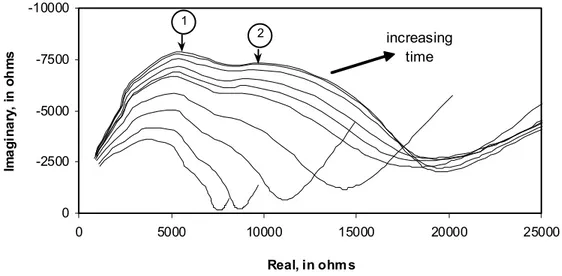
It has been suggested that grain boundary effects in polycrystalline materials can account for the presence of an intermediate arc in the impedance plane (MacDonald 1987). The equivalent circuit usually contains a separate circuit for the grain interior, the grain boundary and the electrode effects. MacDonald (1987) has also shown that the presence of intragranular and intergranular pores modifies the impedance plots of certain ceramics by altering the conductivities of these materials. Impedance spectroscopy has also been used to study grain boundary effects in nanoceramics (Mason et al. 2002). The interfaces between agglomerates of C-S-H sheets may, for argument, be considered analogous to grain boundaries. The impedance spectra, Figures 5 and 8 (untreated specimen and the dried (37°C) and re-saturated specimen) show features that indicate the possible presence of intermediate arcs. These are not evident in Figures 6 and 7 (specimens dried by solvent exchange). The degree of agglomeration (collapse of structure on drying) is more extensive in specimens that have not undergone removal of water by solvent exchange (Parrott 1983). It is suggested that the interfacial boundaries between C-S-H sheets (due to imperfect layering) are more numerous for the former (surface area is significantly lower) and that this is detected in the impedance spectra as described above. Solvent exchanged specimens undergo significantly less surface area reduction. The collapse of structure would be correspondingly much less pronounced.
4. Conclusions
1. A.C. impedance spectroscopy can detect real-time microstructural changes in cement paste subjected to a drying regime.
2. There is a systematic time-dependent growth in the size of the impedance high-frequency arc for hardened cement paste subjected to drying.
3. The relative size of the high-frequency arc in the cement paste due to specific pre-drying treatment is consistent with a pore coarsening effect.
4. There is a strong indication of the presence of an intermediate arc in the impedance spectra for untreated and dried (37°C) and re-saturated specimens subjected to a drying regime. The arc is attributed to formation of new interfacial regions between collapsing C-S-H surfaces.
5. There is no clear indication of an intermediate arc in the impedance spectra for the solvent exchanged specimens. This is consistent with a ‘preserved’ microstructure as evidenced by a limited reduction in surface area.
5. References
Von Schwiedler, E., 1907. Studien über die Anomalien im Verhaltem der Dielektrika, Ann. D. Physik, (27), 711-770.
Cole, K.S. and Cole, R.H., 1941. Dispersion and Absorption in Dielectrics I. Alternating
Current Characteristics, Journal of Chemical Physics, (9), 341-351.
Copeland, L.E. and Hayes, J.C., 1953. Determination of Non-evaporable Water in
Powers, T.C.; Copeland, L.E.; Hayes, J.C. and Mann, H.M., 1954. Permeability of
Portland Cement Paste, Journal of American Concrete Institute, 26, 285-296.
Brunauer, S.; Kantro, D.L. and Copeland, L.E., 1958. The Stoichiometry of the
Hydration of β-Dicalcium Silicate and Tricalcium Silicate at Room Temperature, Journal of American Chemical Society, (80), 761-767.
Sereda, P.J. and Swenson, E.G., 1967. Apparatus for Preparing Portland Cement Paste
of High Water Cement Ratio, Materials Research and Standards, 4 (7), p. 152.
Powers, T.C., 1968. Mechanisms of Shrinkage and Reversible Creep of Hardened
Cement Paste, Int. Conf. on Structure of Concrete, Cement and Concrete Assoc., London,
319-344.
Feldman, R.F.,1968. Sorption and Length-Change Scanning Isotherms of Methanol and
Water on Hydrated Portland Cement, Proceedings Fifth International Symposium on
Chemistry of Cement, Tokyo, 3 (Part 3), 53-66.
Neville, A.M., 1970. Creep of Concrete: Plain, Reinforced and Prestressed, chapters 10
and 11 (Mechanisms of Creep and Creep Hypotheses), North Holland Publishing
Company, Amsterdam, 258-309.
Feldman, R.F., 1971. Assessment of Experimental Evidence for Models of Hydrated
Portland Cement, High. Res. Record, (370), 8-24.
Feldman, R.F. and Ramachandran, V.S., 1971. Differentiation of Interlayer and
Adsorbed Water in Hydrated Portland Cement by Thermal Analysis, Cement and
Concrete Research, 1971, 1 (6), 607-620.
Feldman, R.F., 1972. Mechanism of Creep of Hardened Portland Cement Paste, Cement Concrete Research, 2 (5), 509-520.
Young, J.F., 1974. Assessment of the Influence of Microstructure on Time Dependent
Deformation of Hardened Cement Paste, First Australian Conference on Engineering
Materials, Sidney, 3-28.
Jonscher, A.K., 1975. Physical Basis of Dielectric Loss, Nature, 717 (253), and 566 (256).
Litvan, G.F., 1976. Variability of the Nitrogen Surface Area of Hydrated Cement Paste, Cement and Concrete Research, 6, 139-144.
Feldman, R.F., 1980. Application of the Helium Inflow Technique for Measuring Surface
Area and Hydraulic Radius of Hydrated Portland Cement, Cement and Concrete
Research, (10), 657-664.
Ramachandran, V.S.; Feldman, R.F. and Beaudoin, J.J., 1981. Concrete Science, Heyden & Son, London, p. 427.
Parrott, L.J., 1981. Effect of Drying History Upon the Exchange of Pore Water with
Methanol and Upon Subsequent Methanol Sorption Behavior in Hydrated Alite Paste,
Cement and Concrete Research, 11, 651-658.
Alford, N. Mc N. and Double, D.D., 1982. Adsorption at the Gas-Solid and Liquid-Solid
Interface, Studies in Surface Science and Catalysis 10, Ed. By J. Rouquerol and K.S.W.
Sing, Elsevier, Amsterdam, 259-266.
Dalgliesh, B.J.; Pratt, P.L. and Toulson; E., 1982. Fractographic Studies of
Microstructural Development in Hydrated Portland Cement, Journal of Materials
Science, (17), 2199.
Parrott, L.J., 1983. Thermogravimetric and Sorption Studies of Methanol Exchange in an
MacDonald, J.R., 1987. Impedance Spectroscopy, John Wiley, New York, pp. 346. Tashira, C. and Shimamura, H., 1987. Dependence of the Electrical Resistivity on
Evaporable Water Content in Hardened Cement Pastes, Materials Science Letter, (6),
1379.
MacDonald, J.R. and Johnson, W.B., 1987. Chapter One, Fundamentals of Impedance
Spectroscopy, in Impedance Spectroscopy, Edited by J. Ross MacDonald, John Wiley &
Sons, New York, p. 346.
Beaudoin, J.J., 1987. Validity of Using Methanol for Studying the Microstructure of
Cement Paste, Materials and Structures, 115 (20), 27-31.
McCarter, W.J.; Garvin, S. and Bouzid, N., 1988. Impedance Measurement on Cement Paste, Journal of Materials Science, 10 (7), 1056-1057.
McCarter, W.J. and Garvin, S., 1989. Dependence of Electrical Impedance of Cement
Based Materials on Their Moisture Condition, Journal of Physics. D. Applied Physics, 11
(22), 1773-1776.
Sluyters-Rehbach, M. and Sluyters, J.H., 1990. Electroanalytical Chemistry, 4, Edited by A.J. Bard, Marcel Dekker, New York, 1-125.
Brantervik, K. and Niklasson, G.A., 1991. Circuit Models for Cement Based Materials
Obtained from Impedance Spectroscopy, Cement Concrete Research, 21 (4), 496-508.
Scuderi, C.A.; Mason, T.O. and Jennings, H.M., 1991. Impedance Spectra of Hydrating
Cement Pastes, Journal of Materials Science, (26), 349-353.
Yumping, X. and Jennings, H.M., 1992. Relationships Between Microstructure and
Creep and Shrinkage of Cement Paste, Materials Science of Concrete III, The American
Christensen, B.J.; Mason, T.O. and Jennings, H.M., 1992. Experimental and Computer
Simulation Results for the Electrical Conductivity of Portland Cement Paste, Materials
Research Society Symposium Proceedings, (245), 259-264.
Xu, Z.; Gu, P.; Xie, P. and Beaudoin, J.J., 1993. Application of A.C. Impedance
Techniques in Studies of Porous Cementitious Materials (II). Relationship Between ACIS
Behavior and the Porous Microstructure, Cement and Concrete Research, 4 (25),
853-862.
Gu, P.; Xu, Z.; Xie, P. and Beaudoin, J.J., 1993. Application of A.C. Impedance
Techniques in Studies of Porous Cementitious Materials (I). Influence of Solid Phase and
Pore Solution on High Frequency Resistance, Cement and Concrete Research, 3 (23),
531-540.
Gu, P.; Xie, P.; Fu, Y. and Beaudoin, J.J., 1994a. A.C. Impedance Phenomena in
Hydrating Cement Systems: Origin of the High Frequency Arc, Cement Concrete
Research, 24 (2), 704-706.
McCarter, W.J. and Curran, P.N., 1994. The Electrical Response Characteristics of
Setting Cement Paste, Magazine of Concrete Research, 126 (36), 42-49.
Gu, P.; Xi, P.; Fu, Y. and Beaudoin, J.J., 1994b. A.C. Impedance Phenomena in
Hydrating Cement Systems: Frequency Dispersion Angle and Pore Size Distribution,
Cement and Concrete Research, 1 (24), 86-88.
Gu, P.; Xie, P.; Fu, Y. and Beaudoin, J.J., 1995. Microstructural Characterization of
Cementitious Materials: Conductivity and Impedance Methods, Materials Science of
Beaudoin, J.J.; Gu, P.; Tumidajski, P.J. and Perron, S., 1998. Microstructural Changes
on Drying and Rewetting of Hydrated Cement Paste – An A.C. Impedance Spectroscopy
Study, Proc. RILEM Conference: Concrete from Materials to Structure, Arles, France,
32-42.
Sha, W.; O’Neill, E.A. and Guo, Z., 1999. Differential scanning calorimetry study of
ordinary Portland cement, Cement and Concrete Research, 29, 1487-1489.
Baroghel-Bouny, V.; Mainguy, M.; Lassabatere, T. and Coussy, O., 1999.
Characterization and identification of equilibrium and transfer moisture properties for
ordinary and high-performance cementitious materials, Cement and Concrete Research,
29, 1225-1238.
Tamtsia, B.T. and Beaudoin, J.J., 2000. Basic Creep of Hardened Cement Paste – A
Re-examination of the Role of Water, Cement and Concrete Research, 2000, 30, 1465-1475.
McCarter, W.J.; Watson, D.W. and Chrisp, T.M., 2001. Surface Zone Concrete: Drying,
Absorption and Moisture Distribution, Journal of Materials in Civil Engineering, 1 (13),
49-57.
Mason, T.O.; Hwang, J.H.; Mansourian-Hadan, N.; Gonzalez, G.B.; Ingram, B.J. and Homrighaus, Z.H., 2002. Impedance/Dielectric Spectroscopy of Nanoceramics, in Nanocrystalline Metals and Oxides, Edited by P. Knauth and J. Schoomman, Kluwer Acad. Pub., Norwell Mass., 111-131.
FIGURES
Real (ohms)
Imaginary (ohms)
R1 R1+R2
(a)
Bulk cement paste effect Electrode effect
R1
R2
C2 Cdl
Rct
(b)
Bulk cement paste effect Electrode effect
Figure 1. (a) Schematic plot of a high frequency arc in the impedance complex plane obtained for cement paste systems. (b) A simplified electrical equivalent circuit for
hydrating cement systems. R1, R2, and C2 are high-frequency resistance, solid-liquid
interface resistance and capacitance. Rct and Cdl are cement-electrode interface charge
ωincrease
Figure 2. AC impedance spectra for cement paste (w/c=0.30) subjected to cycles of wetting/drying subsequent to re-saturation with synthetic pore solution. Numbers indicate the conditioning sequence. Data points are experimental; solid lines are obtained from a computer simulation.
-0.2 0 0.2 0.4 0.6 0.8 1 1.2 1.4 1.6 1.8 0 25 50 75 100 125 150 175 200 225 temperature, °C D-drying Soft-drying Control Treatment 1 Treatment 2 Treatment 3 d er iva ti ve o f % m a ss lo ss, % /m in
Figure 3. Derivative mass change of hydrated cement paste (w/c=0.50) after re-saturation with pore solution subsequent to different drying pre-treatments.
35 30 25 20 15 10 0 50 0 0 0 0 0 0 0 20 40 60 80 100 120 140 time, in hours m icr o s tr ai n , i nµ m/m Control Treatment 1 Treatment 2 Treatment 3
Figure 4. Shrinkage of hardened cement paste (w/c=0.50) conditioned at 96% relative humidity after re-saturation from different drying pre-treatments.
-30000 -20000 -10000 0 0 10000 20000 30000 40000 50000 60000 70000 Real, in ohms Ima g in a ry , in o h m s 1 2 increasing time
Figure 5. AC impedance spectra: shrinkage of untreated hcp (w/c=0.50) specimens conditioned at about 96% RH for 0, 1, 2, 3.7, 6.5, 9, 12.7, 24, 48 and 72 hours. The numbers indicates the presence of an intermediate arc: (1) high frequency arc; (2) intermediate arc.
-20000 -15000 -10000 -5000 0 0 5000 10000 15000 20000 25000 30000 35000 40000 45000 Re al, in ohm s Im ag in ar y, i n o h ms increasing time
Figure 6. AC impedance spectra: shrinkage of untreated hcp (w/c=0.50) isopropanol soaked vacuum dried at 37°C and re-saturated with synthetic pore
solution; specimens conditioned at about 96% RH for 0, 1, 2, 3.7, 6.5, 9, 12.7, 24, 48 and 72 hours.
-15000 -10000 -5000 0 0 5000 10000 15000 20000 25000 30000 35000 40000 Re al, in ohms Im a g in ar y, i n o h m s increasing time
Figure 7. AC impedance spectra: shrinkage of untreated hcp (w/c=0.50) methanol soaked vacuum dried at 37°C and re-saturated with synthetic pore solution; specimens conditioned at about 96% RH for 0, 1, 2, 3.7, 6.5, 9, 12.7, 24, 48 and 72 hours.
-10000 -7500 -5000 -2500 0 0 5000 10000 15000 20000 25000 Real, in ohm s Im a g in a ry , in oh m s 1 2 increasing time
Figure 8. AC impedance spectra: shrinkage of untreated hcp (w/c=0.50) dried at 37°C and and re-saturated with synthetic pore solution; specimens conditioned at about 96% RH for 0, 1, 2, 3.7, 6.5, 9, 12.7, 24, 48 and 72 hours.