Publisher’s version / Version de l'éditeur: ASHRAE Preprint, 4159, pp. 1-7, 1998-01-01
READ THESE TERMS AND CONDITIONS CAREFULLY BEFORE USING THIS WEBSITE. https://nrc-publications.canada.ca/eng/copyright
Vous avez des questions? Nous pouvons vous aider. Pour communiquer directement avec un auteur, consultez la
première page de la revue dans laquelle son article a été publié afin de trouver ses coordonnées. Si vous n’arrivez pas à les repérer, communiquez avec nous à [email protected].
Questions? Contact the NRC Publications Archive team at
[email protected]. If you wish to email the authors directly, please see the first page of the publication for their contact information.
Archives des publications du CNRC
This publication could be one of several versions: author’s original, accepted manuscript or the publisher’s version. / La version de cette publication peut être l’une des suivantes : la version prépublication de l’auteur, la version acceptée du manuscrit ou la version de l’éditeur.
Access and use of this website and the material on it are subject to the Terms and Conditions set forth at
Sound pressure level vs. distance from sources in rooms Warnock, A. C. C.
https://publications-cnrc.canada.ca/fra/droits
L’accès à ce site Web et l’utilisation de son contenu sont assujettis aux conditions présentées dans le site LISEZ CES CONDITIONS ATTENTIVEMENT AVANT D’UTILISER CE SITE WEB.
NRC Publications Record / Notice d'Archives des publications de CNRC:
https://nrc-publications.canada.ca/eng/view/object/?id=4809e318-7650-4ae2-8592-2e49cecb7a41 https://publications-cnrc.canada.ca/fra/voir/objet/?id=4809e318-7650-4ae2-8592-2e49cecb7a41
Sound Pressure Level Versus Distance from Sources in Rooms
A.C.C. Warnock, Ph. D., Member of ASHRAE, Institute for Research in Construction, National Research Council Canada
A version of this paper was published in ASHRAE Preprints, 4159, ASHRAE Winter Meeting (San Francisco, 1/1/98), pp. 1-7, 1998
Résumé
Sound fields in furnished rooms are not diffuse and so do not conform to diffuse-field theory. In an earlier ASHRAE research project RP339, sound pressure levels in a variety of normally furnished rooms were found to reduce by 3 decibels each time the distance from the source was doubled. No dependence on room absorption was found. Under the conditions of this project, RP755, the reduction in level with increasing distance for a source in the room was found to depend on the inverse of the room reverberation time. The approximate relationship found was attenuation = 0.9/RT +0.5 dB/distance doubling for 250Hz and above. However, for furnished rooms, which are usually found to have reverberation times around 0.5 seconds, the attenuation is still very close to 3 dB per doubling of distance from the source, the value found in RP339.
When sources were in the plenum above the ceiling, the sound fields in the room below were, for practical purposes, uniform. Some attenuation was seen at 2 and 4 kHz but it was small.
SOUND PRESSURE LEVEL VERSUS DISTANCE FROM
SOURCES IN ROOMS.
†INTRODUCTION
Diffuse field theory (Beranek, 1971) gives the relationship between sound pressure level and sound power in a room as
÷ ø ö ç è æ + + = A r Q L Lp w 4 4 log 10 10 2 πθ ( 1)
where Lp is the sound pressure level in dB re 20 µPa
Lw is the sound power level in dB re 1 pW
r is the shortest distance from the noise source to the receiver
Qθ is the directivity factor of the source in direction θ
A is the total absorption in the room, m2
It has been established (Schultz 1985) that in typical rooms, the reduction of sound pressure level with distance from a source does not agree with diffuse-field, reverberant room theory. The transition from the direct field decaying at 6 dB per distance doubling to the
reverberant field with a constant level far from the source is not observed. What is observed is a steady decrease in sound pressure level with distance from the source and no sign of a uniform reverberant field. As well, due to the relative lack of room modes, plots of sound pressure level in rooms versus distance at low frequencies show pronounced fluctuations. The literature on this subject was well reviewed by Schultz in ASHRAE research project RP339 (Schultz, 1985).
Schultz investigated the conversion from sound power level to sound pressure level in rooms in some detail. He developed a simple empirical formula that was subsequently
incorporated into the chapter on Sound and Vibration in the ASHRAE Handbook (ASHRAE 1993) and other documents. Schultz’ formula is
Lp =Lw−10logr−5logV−3log f +K ( 2)
where V is the volume of the room
f is the mid-band frequency for the octave band of interest, and
K is a constant equal to 25 when r and V are in feet and cubic feet
respectively and equal to 12 when r and V are in metres and cubic metres
There is no explicit term in this equation to account for the amount of sound absorption in the room, but it should be remembered that this equation is a fit to measured data and has
specified limited application. Note as well that the 10 log r term is equivalent to a spatial attenuation of 3 dB/dd, a reduction of 3 dB each time the distance from the source is doubled.
The major thrust of the ASHRAE RP755 project (Warnock, 1997) was the investigation of sound transmission from air terminal units installed above suspended ceilings into the room below. The information obtained was to be used to verify that the calculation procedures in ARI 885 were valid. Part of the procedure in ARI 885 is the calculation of the attenuation of sound due to distance from the source, so, during RP755 the attenuation with distance of sound from sources above and below the ceiling was measured. The data and its implications for ARI 885 are discussed in this paper.
ROOM ACOUSTICS TEST ROOM
The room acoustics test (RAT) room, where the propagation measurements were made, is a rectangular parallelepiped 4.71 m (15.5 ft) wide and 3.6 m (11.8 ft) high. One end wall can be
above the floor, so the distance from the supporting surface of the T-bar to the true ceiling of the room was 740 mm (29 in). To provide some scattering, 8 sheets of 16 mm (5/8 in.) gypsum board measuring 1.22 x 1.22 m (4 x 4 ft) were hung on the walls or placed on the floor and inclined against the walls. When a ceiling was installed, the vertical surfaces of the room above the ceiling were lined with 100 mm (4 in) thick sound absorbing foam.
CEILING TYPES
Five types of ceiling panels were initially selected for the RP755 project. Towards the end of the project, an additional ceiling type (A2910), expected to have much lower sound
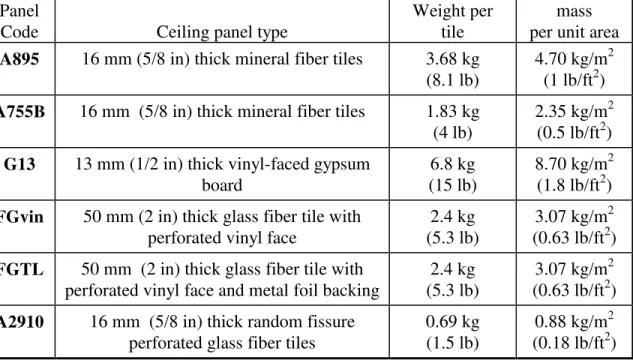
transmission loss, was added. The panels are described in Table 1. For convenience, panel codes are used to identify each panel type throughout this paper.
Table 1: Identification and properties of 625 x 1250 mm (2 x 4 ft) ceiling panels used in project RP755.
Panel
Code Ceiling panel type
Weight per tile
mass per unit area
A895 16 mm (5/8 in) thick mineral fiber tiles 3.68 kg
(8.1 lb)
4.70 kg/m2
(1 lb/ft2)
A755B 16 mm (5/8 in) thick mineral fiber tiles 1.83 kg (4 lb)
2.35 kg/m2
(0.5 lb/ft2)
G13 13 mm (1/2 in) thick vinyl-faced gypsum
board
6.8 kg (15 lb)
8.70 kg/m2
(1.8 lb/ft2)
FGvin 50 mm (2 in) thick glass fiber tile with perforated vinyl face
2.4 kg (5.3 lb)
3.07 kg/m2
(0.63 lb/ft2)
FGTL 50 mm (2 in) thick glass fiber tile with
perforated vinyl face and metal foil backing
2.4 kg (5.3 lb)
3.07 kg/m2
(0.63 lb/ft2)
A2910 16 mm (5/8 in) thick random fissure perforated glass fiber tiles
0.69 kg (1.5 lb)
0.88 kg/m2
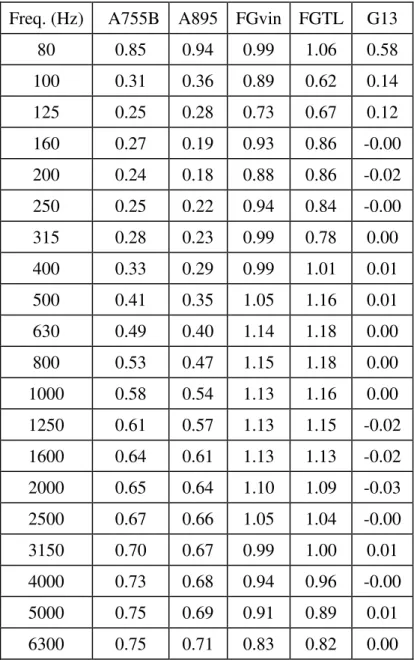
Sound absorption for each ceiling specimen was measured in a 250 m3 reverberation room (ASTM C423) with each specimen mounted in an E400 frame (ASTM E795). Table 2 lists the absorption coefficients.
Table 2: Sound absorption coefficients with ceiling panels mounted in an E400 frame.
Freq. (Hz) A755B A895 FGvin FGTL G13
80 0.85 0.94 0.99 1.06 0.58 100 0.31 0.36 0.89 0.62 0.14 125 0.25 0.28 0.73 0.67 0.12 160 0.27 0.19 0.93 0.86 -0.00 200 0.24 0.18 0.88 0.86 -0.02 250 0.25 0.22 0.94 0.84 -0.00 315 0.28 0.23 0.99 0.78 0.00 400 0.33 0.29 0.99 1.01 0.01 500 0.41 0.35 1.05 1.16 0.01 630 0.49 0.40 1.14 1.18 0.00 800 0.53 0.47 1.15 1.18 0.00 1000 0.58 0.54 1.13 1.16 0.00 1250 0.61 0.57 1.13 1.15 -0.02 1600 0.64 0.61 1.13 1.13 -0.02 2000 0.65 0.64 1.10 1.09 -0.03 2500 0.67 0.66 1.05 1.04 -0.00 3150 0.70 0.67 0.99 1.00 0.01 4000 0.73 0.68 0.94 0.96 -0.00 5000 0.75 0.69 0.91 0.89 0.01 6300 0.75 0.71 0.83 0.82 0.00
SOUND SOURCES
Four types of VAV terminals were used during project RP755. These were 1) an air-to-air ceiling induction unit, 2) a simple shutoff unit, 3) a series flow fan-powered unit, and 4) a parallel-flow fan-powered unit. As well, to provide simple and more convenient sources with good repeatability, two VAV simulators were used as sources above the ceilings. The simulators were 24 gauge metal boxes measuring 300 x 600 x 900 mm (1 x 2 x 3 ft). Two elliptical car loudspeakers, each fed by its own noise generator and amplifier, were mounted facing in opposite directions on a 13 mm thick plywood panel at the mid-plane of each box. One simulator,
denoted VAVsim1, was mounted about 1 m (3 ft) to one side of the mid-point of the ceiling plenum positioned near the middle of the room, close to the VAV devices. The second, denoted VAVsim2, was placed in one corner of the ceiling plenum. The lower face of each simulator was 75 mm (3 in) above the bottom of the T-bars.
To measure the reduction in sound pressure level with distance below the ceilings, a dodecahedral source incorporating twelve 100 mm (4 in) diameter loudspeakers was placed in one corner of the room with its center at a height of 1.45 m (4.75 ft). The speakers were fed with pink noise.
Each time the ceiling tiles were changed or a new VAV terminal was installed, sound levels in the room generated by a reference sound source placed on the floor were measured. The reference sound source was a vertically-oriented, centrifugal fan with a 305 mm diameter fan wheel. The reference sound source was placed on the floor close to the middle of one long wall of the room. Sound pressure levels were measured at an array of 36 microphone positions. These measurements were made so sound power levels could be calculated using the comparison
technique but it became evident that the sound pressure levels showed marked attenuation with distance from the source. The data were therefore processed to obtain plots of sound pressure level versus distance.
REVERBERATION TIMES.
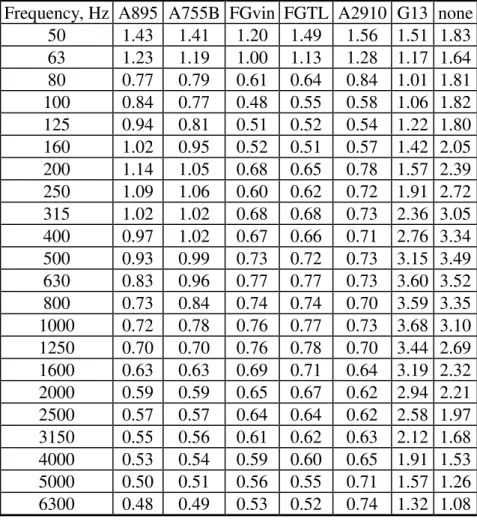
Reverberation times in the RAT room were measured using two loudspeakers supplied with pink noise in diagonally opposite corners as noise sources. At each of 17 microphone positions along a room diagonal, 10 decays were averaged together at each frequency. The averages were passed to a computer and a straight line was fitted to the first 25 dB of the decay in each one-third octave band. The average reverberation times obtained for the room with each ceiling in place and for the room with no ceiling are given in Table 3. When there was no ceiling in the room, the open-cell foam above the T-bars was removed but all ductwork was left in place.
Table 3: Average reverberation times in the RAT room with each ceiling system installed.
Frequency, Hz A895 A755B FGvin FGTL A2910 G13 none
50 1.43 1.41 1.20 1.49 1.56 1.51 1.83 63 1.23 1.19 1.00 1.13 1.28 1.17 1.64 80 0.77 0.79 0.61 0.64 0.84 1.01 1.81 100 0.84 0.77 0.48 0.55 0.58 1.06 1.82 125 0.94 0.81 0.51 0.52 0.54 1.22 1.80 160 1.02 0.95 0.52 0.51 0.57 1.42 2.05 200 1.14 1.05 0.68 0.65 0.78 1.57 2.39 250 1.09 1.06 0.60 0.62 0.72 1.91 2.72 315 1.02 1.02 0.68 0.68 0.73 2.36 3.05 400 0.97 1.02 0.67 0.66 0.71 2.76 3.34 500 0.93 0.99 0.73 0.72 0.73 3.15 3.49 630 0.83 0.96 0.77 0.77 0.73 3.60 3.52 800 0.73 0.84 0.74 0.74 0.70 3.59 3.35 1000 0.72 0.78 0.76 0.77 0.73 3.68 3.10 1250 0.70 0.70 0.76 0.78 0.70 3.44 2.69 1600 0.63 0.63 0.69 0.71 0.64 3.19 2.32 2000 0.59 0.59 0.65 0.67 0.62 2.94 2.21 2500 0.57 0.57 0.64 0.64 0.62 2.58 1.97 3150 0.55 0.56 0.61 0.62 0.63 2.12 1.68 4000 0.53 0.54 0.59 0.60 0.65 1.91 1.53 5000 0.50 0.51 0.56 0.55 0.71 1.57 1.26 6300 0.48 0.49 0.53 0.52 0.74 1.32 1.08
SOUND PRESSURE LEVEL VERSUS DISTANCE FROM SOURCE
Dodecahedral Source Below the Ceiling.
To measure sound pressure level from the dodecahedral source, a 13 mm (1/2 in) diffuse field microphone at a height of 1.6 m (5.25 ft) was placed consecutively at several locations along a room diagonal running from the source to the opposite corner of the room. The data collected were used to generate drawaway curves – plots of sound pressure level versus distance
along a straight line. Drawaway curves were obtained for each tile type each time it was installed beneath one of the terminal units.
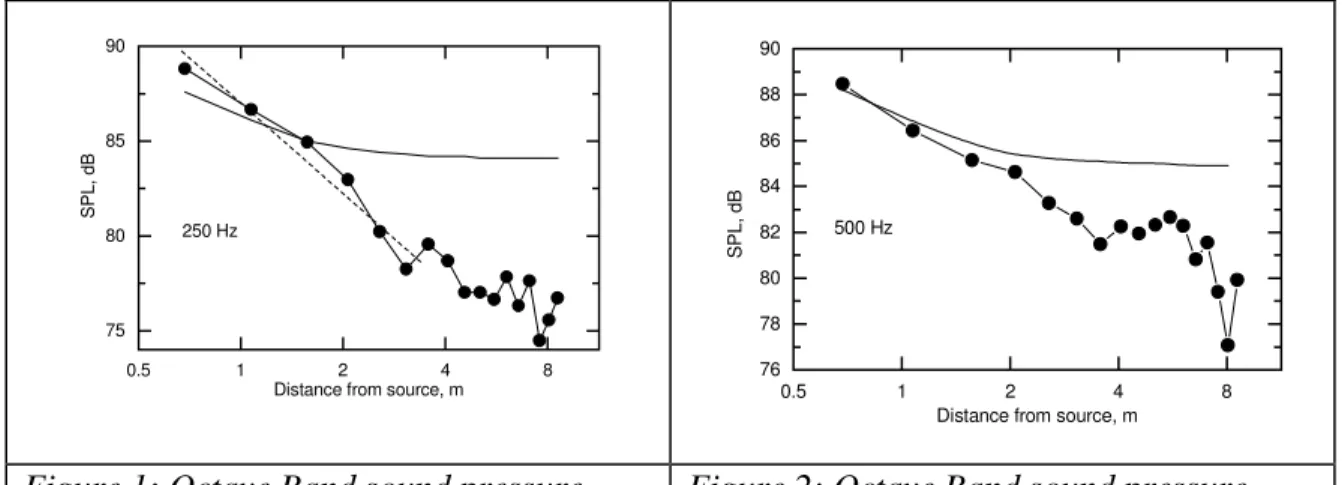
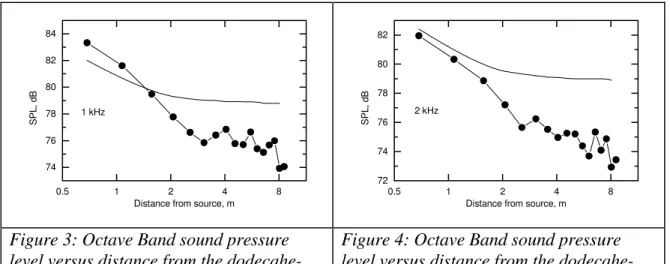
Examples of measured octave band drawaway curves for the FGTL tiles are shown in Figure 1 to Figure 4. The continuous line in each graph is the sound pressure level predicted using the diffuse field relationship in Equation 1 with the directivity factor taken as unity and using measured values of sound power and room reverberation time. The dashed line in Figure 1 is a linear fit to the data from 0.5 to 3.5 m. A linear fit was made automatically for all drawaway measurements. 0.5 1 2 4 8 75 80 85 90 250 Hz SPL , d B
Distance from source, m 0.5 1 2 4 8
76 78 80 82 84 86 88 90 500 Hz S P L, dB
Distance from source, m
Figure 1: Octave Band sound pressure level versus distance from the dodecahe-dral source for the FGTL tiles at 250 Hz.
Figure 2: Octave Band sound pressure level versus distance from the dodecahe-dral source for the FGTL tiles at 500 Hz.
0.5 1 2 4 8 74 76 78 80 82 84 1 kHz SPL , d B
Distance from source, m
0.5 1 2 4 8 72 74 76 78 80 82 2 kHz SPL , d B
Distance from source, m
Figure 3: Octave Band sound pressure level versus distance from the dodecahe-dral source for the FGTL tiles at 1 kHz.
Figure 4: Octave Band sound pressure level versus distance from the dodecahe-dral source for the FGTL tiles at 2 kHz.
Space restrictions preclude the presentation of data for all tile types and room conditions here. Further detail can be found in the project report (Warnock 1997) but some general
statements can be made here. For all of the tiles, there was no real indication of a uniform reverberant field far from the source except perhaps at high frequencies for the less absorptive tiles. At the lower frequencies there were quite strong fluctuations in the sound pressure level because of room resonances. These fluctuations are even more evident when the data are viewed as 1/3 octave bands.
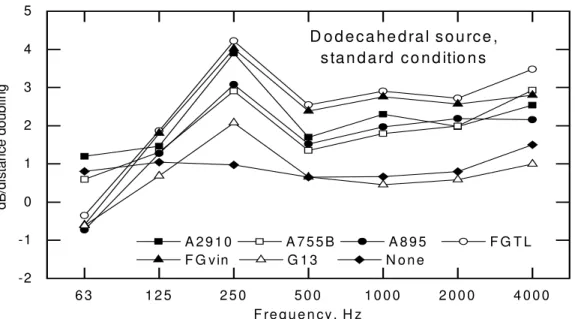
6 3 1 2 5 2 5 0 5 0 0 1 0 0 0 2 0 0 0 4 0 0 0 -2 -1 0 1 2 3 4 5 D o d e c a h e d ra l s o u rc e , s ta n d a rd c o n d itio n s A 2 9 1 0 A 7 5 5 B A 8 9 5 F G T L F G v in G 1 3 N o n e dB /d is tan c e do ub ling F re q u e n c y , H z
Figure 5: Average value of spatial attenuation for the dodecahedral source for the ceiling tiles used in the project.
The mean spatial attenuations for each tile type are shown in Figure 5 and in Table 4. The Schultz formula predicts a 10 log r dependence or 3 dB/dd whereas the mean value in Figure 5 for all the conventional ceiling tiles from 500 to 4000 Hz is about 2.5 dB/dd. The differences in attenuation among the types of tiles are quite clear although not very great.
Table 4: Mean values of attenuation, dB/distance doubling, for dodecahedral source.
Ceiling Octave Band Frequency, Hz
Type 63 125 250 500 1k 2k 4k A2910 1.2 1.5 3.9 1.7 2.3 2.0 2.5 A755B 0.6 1.3 2.9 1.4 1.8 2.0 2.9 A895 -0.7 1.3 3.1 1.5 2.0 2.2 2.2 FGTL -0.4 1.9 4.2 2.5 2.9 2.7 3.5 FGvin -0.6 1.8 4.0 2.4 2.8 2.6 2.8 G13 -0.6 0.7 2.1 0.7 0.5 0.6 1.0 None 0.8 1.0 1.0 0.6 0.7 0.8 1.3
Effects of plenum lining, carpet and absorbers.
It must be remembered that the RAT room was not furnished during these experiments. It did have fixed diffusing panels mounted on the walls of the room but the floor was bare and there was no furniture. Some measurements were made with a carpeted floor and several absorbing panels added to the room. This was done for two types of ceiling tiles: FGvin and A755B. Aside from reducing reverberation times in the room, the sound levels decreased more rapidly with distance above 500 Hz, in some cases to slightly more than the 3 dB/dd expected from the Schultz formula.
Reference Sound Source below the Ceiling.
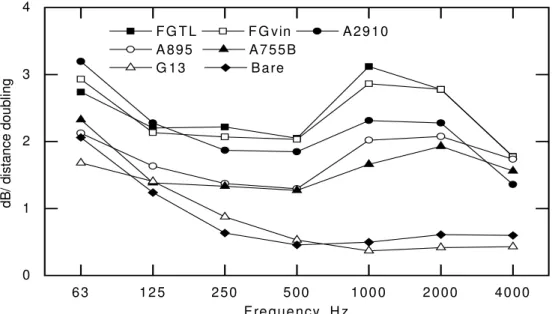
The mean values of attenuation with distance for the reference sound source are shown in Figure 6. A visual comparison of Figure 6 with the results for the dodecahedral source in Figure 5 shows that the spatial attenuation values are not identical. The peak at 250 Hz seen in the dodecahedral results is not visible in the results for the reference sound source. This might be explained by the different positions of the sources; the reference sound source rested on the floor close to the middle of one of the long walls of the room, while the dodecahedral source was 1.45 m (4.75 ft) above the floor in one corner of the room. The different positions would lead to different interference effects between the source and its images in the floor, walls and ceiling. These differences suggest that spatial attenuation values depend on source type or location and are not just a property of the room.
This variation of sound pressure level with distance has implications for measurements of sound pressure level and estimation of sound power level in the RAT room when the ceiling is
absorptive. Since there is no clearly established reverberant field, the customary relationship between sound pressure level and sound power level (ANSI S12.32) is not strictly valid. While this is an interesting result, it is not the subject of this paper.
6 3 1 2 5 2 5 0 5 0 0 1 0 0 0 2 0 0 0 4 0 0 0 0 1 2 3 4 F G T L F G vin A 2 9 1 0 A 8 9 5 A 7 5 5 B G 1 3 B a re dB / d ista n ce doub lin g F re q u e n cy, H z
Figure 6: Mean values of attenuation with distance for the reference sound source under different tiles.
Sources Above the Ceiling.
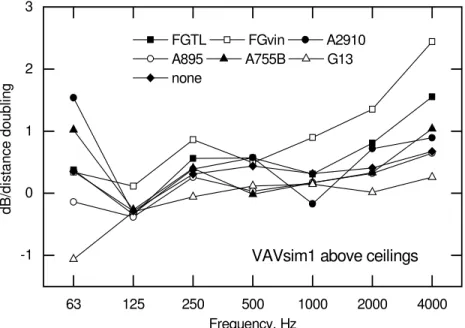
For the air terminal units and the two simulators above the ceiling, the sound field in the room was rather uniform over most of the frequency range. Thus it is not appropriate, as specified in ARI 885, to use the Schultz formula. To illustrate, the mean values of attenuation with distance are shown for all ceilings and for VAVsim1 and VAVsim2 in Figure 7 and Figure 8. Similar results were obtained for the air terminal units. In neither case do the spatial
63 125 250 500 1000 2000 4000 -1 0 1 2 3
VAVsim1 above ceilings
FGTL FGvin A2910 A895 A755B G13 none dB/d is ta nc e do ub ling Frequency, Hz
Figure 7: Mean spatial attenuation under different ceilings for the VAVsim1 source in the plenum. 63 125 250 500 1000 2000 4000 -1 0 1 2 3
VAVsim2 above ceilings
FGTL FGvin A2910 A895 A755B G13 none dB /di s tan c e do ub lin g Frequency, Hz
Figure 8: Mean spatial attenuation under different ceilings for the VAVsim2 source in the plenum.
Effects of plenum lining, carpet and wall absorbers.
The addition of a carpet and absorbing wall panels to the room below had negligible effect on the decrease of sound pressure level with distance in the room when the source was above the ceiling. It is possible that a large number of scattering objects such as desks, bookcases and filing cabinets would have a significant effect on the attenuation of sound with distance but this was not investigated.
Spatial Attenuation versus Reverberation Time and C423 Data.
Inspection of Figure 5 suggests that the spatial attenuation of sound from a source depends on the ceiling type, or more generally on the amount of sound absorption in the room. To examine this further, the correlation between the spatial attenuation and the reciprocal of the room reverberation time (proportional to room absorption) was examined. Figure 9 shows an example of the reverberation time (RT) data obtained at 500 Hz. This plot includes cases where a carpet and wall absorbers were added to the room. The values of the slope and intercept of the regression line at each frequency are given in Table 5 together with the square of the correlation coefficient, r. The values at 63 Hz are not very reliable because of the small number of room resonances; the data are shown only for completeness. Examination of this table shows that a fair approximation for the spatial attenuation for the frequency bands above 250 Hz is (0.9/RT + 0.5) dB/dd. For this room and these measurements, it was only when the room reverberation time was around 0.4 seconds that the decay of sound pressure level approached the value of 3 dB/dd predicted by Schultz’ empirical expression.
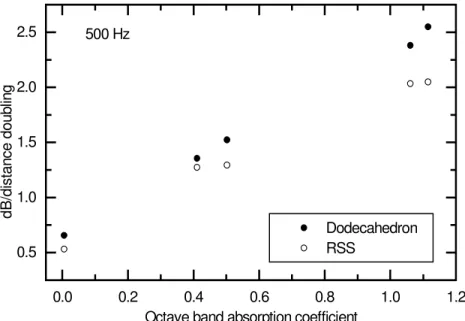
Also examined was the correlation between the spatial attenuation and the absorption coefficients from the C423 measurements. To calculate octave band absorption, the three coefficients for the appropriate one-third octave bands were arithmetically averaged. In a normally furnished room, one might expect that C423 results for the ceiling would not be of much value in predicting the spatial attenuation. However, in much of this work, the ceiling tiles were the only significant absorbing surface. Figure 10 shows that the C423 coefficients correlate fairly well with the spatial attenuation. Cases where a carpet and wall absorbers were added to the room could not be included when making comparisons with the C423 measurements, so there are fewer points in Figure 10 than there are in Figure 9. The correlations with the C423
absorption coefficients were surprising in that for both the dodecahedral and the reference sound source the square of the correlation coefficient was greater than 0.9 in all bands, with one
exception where it dropped to 0.75. The average r-squared was 0.95, so, for this set of data, the absorption coefficient measured in a reverberation room was a better predictor of the spatial attenuation than the measured reverberation time in the room. These results suggest that spatial attenuation in rooms similar to the RAT room used in this work can be estimated from
absorption coefficients if reverberation times are not available.
Table 5: Results of correlation between spatial attenuation and the reciprocal of the room reverberation time. The table shows the slope and intercept of the regression line for each
frequency as well as the value of the square of the correlation coefficient, r.
63 125 250 500 1000 2000 4000
Slope -0.7 0.7 1.5 0.9 0.9 0.9 0.9
Intercept 1.8 0.6 0.5 0.4 0.7 0.6 0.5
0.0 0.5 1.0 1.5 2.0 0.5 1.0 1.5 2.0 2.5 Dodecahedron RSS 500 Hz d B /dis tan c e dou b lin g 1/Octave band RT, s-1
Figure 9: Octave band sound attenuation (dB/distance doubling) versus the reciprocal of the room octave band reverberation time for 500 Hz for the dodecahedral and the reference sound source. 0.0 0.2 0.4 0.6 0.8 1.0 1.2 0.5 1.0 1.5 2.0 2.5 Dodecahedron RSS 500 Hz d B /dis tan c e dou b lin g
Octave band absorption coefficient
Figure 10: Octave band sound attenuation (dB/dd) versus octave band sound absorption coefficient for 500 Hz for the dodecahedral and the RSS.
CONCLUSIONS
For sources in the plenum above the ceiling, the sound field in the room below varied very little with distance from the source; the Schultz formula does not apply. ARI 885 specifies the use of the Schultz formula and so is inaccurate in this respect. Better agreement with measurement was found by assuming a uniform sound field in the room below.
When a dodecahedral source was placed in the room below the ceiling, the attenuation of sound with distance in the room depended on the reciprocal of the room reverberation time. There is no dependence on room absorption or reverberation time in the Schultz formula. The approximate relationship found in this work is attenuation = 0.9/RT +0.5 dB/distance doubling for 250Hz and above. While this dependence on reverberation time was quite clear, it is not very important in practice since most occupied rooms have reverberation times around 0.5 seconds. Thus there was nothing found in this work that would be a significant practical improvement over the Schultz formula in furnished offices.
REFERENCES
ANSI S12.31 – Precision Methods for the determination of sound power levels of broad-band noise sources in reverberation rooms.
ASHRAE Handbook, Fundamentals, Chapter 7, p 7.6, 1993.
ARI Standard 885-90, “Procedure for estimating occupied space sound levels in the application of air terminals and air outlets”, Air-Conditioning & Refrigeration Institute, Arlington, Virginia, 1990.
ASTM C423 – Standard Test method for sound absorption and sound absorption coefficients by the reverberation room method.
ASTM E795 – Standard Practices for mounting test specimens during sound absorption tests.
Beranek, L. L., Noise and Vibration Control, p. 228, McGraw-Hill, N. Y., 1971.
Schultz, T., “Relationship between sound power level and sound pressure level in dwellings and offices”, RP-339, ASHRAE Transactions 1985, V. 91, Pt. 1.
Warnock, A.C.C., “Sound Transmission Through Ceilings from Air Terminal Devices in the Plenum”, Final report ASHRAE RP755. January 1997.
Warnock, A.C.C., “Environmental Effect for Use in Predicting Room Sound Pressure Levels”, San Francisco, 1998.