Publisher’s version / Version de l'éditeur:
ACI Materials Journal, 94, Sept/Oct 5, pp. 385-395, 1997-09-01
READ THESE TERMS AND CONDITIONS CAREFULLY BEFORE USING THIS WEBSITE.
https://nrc-publications.canada.ca/eng/copyright
Vous avez des questions? Nous pouvons vous aider. Pour communiquer directement avec un auteur, consultez la première page de la revue dans laquelle son article a été publié afin de trouver ses coordonnées. Si vous n’arrivez pas à les repérer, communiquez avec nous à PublicationsArchive-ArchivesPublications@nrc-cnrc.gc.ca.
Questions? Contact the NRC Publications Archive team at
PublicationsArchive-ArchivesPublications@nrc-cnrc.gc.ca. If you wish to email the authors directly, please see the first page of the publication for their contact information.
NRC Publications Archive
Archives des publications du CNRC
This publication could be one of several versions: author’s original, accepted manuscript or the publisher’s version. / La version de cette publication peut être l’une des suivantes : la version prépublication de l’auteur, la version acceptée du manuscrit ou la version de l’éditeur.
Access and use of this website and the material on it are subject to the Terms and Conditions set forth at
A study of corrosion inhibitor performance in chloride contaminated
concrete by electrochemical impedance spectroscopy
Gu, P.; Elliott, S.; Hristova, R.; Beaudoin, J. J.; Brousseau, R. J.; Baldock, B.
https://publications-cnrc.canada.ca/fra/droits
L’accès à ce site Web et l’utilisation de son contenu sont assujettis aux conditions présentées dans le site
LISEZ CES CONDITIONS ATTENTIVEMENT AVANT D’UTILISER CE SITE WEB.
NRC Publications Record / Notice d'Archives des publications de CNRC:
https://nrc-publications.canada.ca/eng/view/object/?id=5203e16a-d4c2-450b-aa99-0b04555e0559 https://publications-cnrc.canada.ca/fra/voir/objet/?id=5203e16a-d4c2-450b-aa99-0b04555e0559http://www.nrc-cnrc.gc.ca/irc
A St udy of c orrosion inhibit or pe rform a nc e in c hloride c ont a m ina t e d
c onc re t e by e le c t roc he m ic a l im pe da nc e spe c t rosc opy
N R C C - 3 9 8 5 4
G u , P . ; E l l i o t t , S . ; H r i s t o v a , R . ; B e a u d o i n ,
J . J . ; B r o u s s e a u , R . J . ; B a l d o c k , B .
S e p t e m b e r 1 9 9 7
A version of this document is published in / Une version de ce document se trouve dans:
ACI Materials Journal, 94, (5), Sept/Oct, pp. 385-395, September 01, 1997
The material in this document is covered by the provisions of the Copyright Act, by Canadian laws, policies, regulations and international agreements. Such provisions serve to identify the information source and, in specific instances, to prohibit reproduction of materials without written permission. For more information visit http://laws.justice.gc.ca/en/showtdm/cs/C-42
Les renseignements dans ce document sont protégés par la Loi sur le droit d'auteur, par les lois, les politiques et les règlements du Canada et des accords internationaux. Ces dispositions permettent d'identifier la source de l'information et, dans certains cas, d'interdire la copie de documents sans permission écrite. Pour obtenir de plus amples renseignements : http://lois.justice.gc.ca/fr/showtdm/cs/C-42
ACI MATERIALS JOURNAL
TECHNICAL PAPER
Title no. 94-M46 ···..·,'.. ,.'.,i,
A Study of Corrosion Inhibitor
Performance in
Chloride
Contaminated Concrete by Electrochemical Impedance
Spectroscopy
.rt&.tI.1
by Ping Gu, S. Elliott, R. Hristova,
J. J.
Beaudoin, R. Brousseau, and B. Baldock
Electrochemical impedance spectroscopy and linear polarizationtech-niques were used to study five-year-old "lollipop-like "-concrete specimens containing sodium nitrite and dinitrobenzoic acid. An equivalent circuit model considering the physical characteristics of the rehar/concreteゥョエ・イセ
face was used to simulate the impedance spectra. The RC parameters obtained from the impedance spectra simulation including the maximum phase angle shiftandpolarization resistance were used to characterize the rebar corrosion. The effectiveness of the」ッイイッウゥッョセゥョィゥ「ゥエゥョァ additives in the presence and absence of chloride ions was evaluated. The corrosion current densities estimated by impedance measurement were confirmed 'by those determined using linear polarization techniques. The purpose of this study was to evaluate the long-term perfomumce potential ofsodium nitrite and dinitrobenzoic acid used as the」ッイイッウゥッョセゥョィゥ「ゥエゥョァ additivesin」ィャッセ
ride contaminated reinforced concrete.
Keywords: corrosion of reinforced concrete; corrosion inhibitor; ac. impedance spectroscopy.
INTRODUCTION
The deterioration of the highway and bridge infrastructure has received significant attention in recent years. A major contributing factor to this deterioration is the reinforcing steel corrosion.It was reported that several thousand bridges in North America are suffering from the effects of corrosion. The cost of repairs was estimated to be in the range of tens of billions of dollars.! Much research has been performed to investigate possible solutions to the problem. Some of the re-medial measures that have been studied include the use of corrosion-inhibiting admixtures, epoxy-coated reinforcing steel, waterproofing membranes, penetrants and sealers, gal-vanized reinforcing steel, electrochemical removal of chlo-rides, and cathodic protection.
The principal function of these corrosion-protection sys-tems is to prevent aggressive agents, mainly chloride ions, from attacking the sUrface of the reinforcing steel. Desalina-tion removes chloride ions from the sUrface of reinforcing steel by electrical migration. Epoxy-coated rebar provides a physical barrier to the ingress of aggressive agents, and ca-thodic protection electrochemically stabilizes the steel sur-face. The use of corrosion-inhibiting admixtures has been considered as one of the most cost-effective solutions to the ACI Materials Journal
I
September-October 1997widespread corrosion problem due to their convenient and economical application to both new structures and repair of existing buildings.2
CORROSION INHIBITORS IN CONCRETE Corrosion inhibitors may be classified as either inorganic, organic, or both. Corrosion-inhibiting admixtures for rein-forced concrete typically are categorized as anodic, cathodic, or mixed depending on how they affect the corrosion pro-cess. Ideally, when added in sufficient amounts to concrete, they can prevent corrosion of embedded steel with no ad-verse effects on 」ッョ」イ・エセ performance (strength, setting time, bleeding, etc.). The use. of inhibitors in concrete has been reviewed by many including Griffin,3 Craig and Wood,4Treadaway and Russell,5Slater,6 and Berke.2;1 Ear-ly studies focused mainEar-ly on the use of sodium nitrite, calci-um nitrite, potassicalci-um chromate, sodicalci-um benzoate, and stannous chloride.It was found that a significant decrease (as high as20to40percent) in compressive strength values was observed for several of these inhibitors when added to mor-tars. However, strength decreases were not noted when cal-cium and sodium nitrite.were used. Tensile strengths were also adversely affected by sodium nitrite and sodium ben-zoate. Stannous chlorideappearedto decrease corrosion in the short term; however, it has been suggested that it is not a
.
inhi'
S ' · · ,corrOSIOn bltor. ;_ .. ;.,:."." ,', ,_,.'
.During the past fifteen years, corrosion-inhibiting admix-tures (mainly CalcilloJ. nitrite) have been increasingly used. They have gained popnlarity for protection of reinforced and prestressed. poncrete9llJnponents of highway bridges and other structures. Howe"er, there is considerable debate about the long-term btlnefitsand effective protection-life of
corro-:' <.:?⦅GセG[BG⦅Lセ[ I
BGOオセ '>'>:::'.
<;;-';".,' t·.··,·,;·;;'-'·,r
ACI MaterkJl.fjoオセZ
v.'
94:
nセGNMイウ・ーセュ「・イセo・エッ「・イ 1997.'Received February 14, 1996, and rm.ewed underInstitutepublication policies. Copyright© 1997.AmericanConcrete Institute. All rights reserved.includingthe making of copies unless permission is obtained from the copyright proprietors.p・イエゥセ
nent discussion wiD bepublishedinthejオャケセaオァオウエ 1998ACIMaterials Joumalif receiyedbyApril 1. 1998.
The terms セ・ =ReCe,セゥ = RiCi•セォ =RpCdl are relaxation
terms, and
a,
(0 <a,
<I)are constants used to represent thedegree of perfection of the capacitor and extent to which the arc is depressed below the real impedance axis. The RC pa-lent circuits have been proposed to describe the different
Ping Gu Is a researrh ojficerintheMaterialsl。「エjイエjQッイケッヲセ jョウエャエオエ・ヲッエセ・セ・ャョGcィ .': ",' _. f th 1/ . . I d' in Construction, NationolResearCh, Councilof
CAtuida
,fIRCI1!RC).hゥウセウセエャjGciイB[ stages0 e stee concrete corrosion process me u mg ac-areas includeャャャOHセュ。エゥカ・ イ・ゥGゥヲセセョァLュ。エセGイゥュウjッLZ 」PョエZイ・Lエ\G。エセエオGA[G LQョuャヲAセヲゥゥエセセ」ZN⦅セ . )..tive, passive corrosion processes involving diffusion control,tionol corrosionil/llIbitingadmixtures.'
and
reinforeedセセイ・エG・ セエイオ」エオセjG corrosiOn' .passivated fum, and macrocell corrosion,・エ」NQRNRPセRR A moreassessmentandprotection. He istheco·inventor a/novel conductive concrete systems
and istheco-author a/moretFum70technical papers. He is a member ofACI Com- complicated model such as the one dimension transmission minee222 and a member ofNACE. ' line analysis was also used to describe corrosion in a large
re-inforced concrete slab.!'
Amodified electrical equivalent circuit, similar to the one
reported by Sagoe-Crentsil et
alP
was used in thissimula-tion (Figure l[a]). This equivalent circuit consists of three parallel combinations of a pure resistor and a frequency de-pendent capacitor (which is also called a constant phase
ele-ment [CPEI23-24introduced to account for the shape of the
depressed complex plot) to represent the concrete matrix, in-terface film, and steel surface corrosion process arcs in the Real veI:SUS Imaginary (or Nyquist) plot (Figure l[b]). The
frequency dependent capacitor is defmed as: C= Cijro)"",
where Co is a constant representing the capacitance of a pure
capacitor, and ro
=
21tj,andj=
J:i).
The total impedance ofthe equivalent circuit is:
Sandra EUWu is a second year co·opsセ⦅ョi intheDepartmentalChemical Engineer· ing,Ryerson Polytechnic Univer.sity, Her work alIR9fNRCJセィuォウ corrosionュ・。ウオセ
menta ofreinforced concrete using linear polariultltm and。NセN impedtuu:e techniques.
James }. Beaudoin Is aーイゥョ」ゥーqH[ウ・。セィ office;ofthe
Mmerlms
lッ「ッイ。エセZ。エ tM .Institute for Research in Constnwtion. Natio1Ull Research Council of Canadi:J (IRCI NRC). He istheauthorD/morethan 250 research papersandtwo books on concrete materials. IJe is a member ofACI Committee 209, Creep and Shrinkage in Concrete. Hiscurrent reseorchfocuses on microfiber reinforced cement $ystenuandthe applica-tion ofa.c. impedance spectroscopy in cementandconcrete scienee. - .
Bruce Baldock is a technical officer in the Materials lAboratory Of the Institute for Research in Construction, National Research Council ofCanada. He is activein
many areas, including repairandinstallation cathodic protection systems ofparJdng garages and bridges, development a/metallized (zinc) CP systems,andcorrosion sur· vey of stonn and sewer lines. Hehasco-authored over30pllblications,and he isan associate member ofthe Ontario AssociationofCertified Engineering.
sion-inhibiting admixtures. The purpose of this study wasto
evaluate the long-term performance potential of sodium ni-trite and dinitrobenzoic acid used as the corrosion-inhibiting additives in chloride contaminated reinforced coricrete.
Ri.J'Mn Brousseau is a research offkerintheMaterials Laboratory aflke Institute/or
Research in Construction, National Research Council ofCanadtJ. His work has
focused on two areas: steel reinforcement corrosion and pipeline cQlhodic protection. He ,'s an active member o/the]'.l0 and T-3K committees in the National Association
0/Corrosion Engineers (NACE), and a member o/the Pipeline Research t?0mmittee,
R.Hmtova is a PhD candidaJe in the Department o/Civil Engineering, Ottawa Univer-sity, Her main research interests include corrosion and protection ofreinforced concrete and the developmentofcorrosion inhibiting admixtures/or reitiforced concrete.
ELECTRICAL EQUIVALENT CIRCUIT FOR THE STEELJCONCRETE INTERFACE
Electrochemical Impedaoce Spectroscopy is a powerful method of characterizirig many of the electrical properties of materials and their interfaces. 11 is widely used for solid mate-rials, both fundamental and applied electrochemical studies, including aspects of electrode kinetics, battery performance. corrosion, and high temperature electrochemistry.9-1O The use of this technique in reinforced concrete corrosion study was
initiated only in the 1980s.11Since then. this technique has
been used by an increasing number ofresearchers in
determin-ing the corrosion rate of reinforcdetermin-ing steel in coricrete.12-20
However. interpretation of an impedance spectrum is difficult due to the complexity of cement paste and concrete micro-structural changes taking place on steel surfaces. The analysis is strongly dependent on how the electrical components are se-lected and the extent to' which they represent the
microstroc-ture of the steel/concrete interface.13,15,20
Itis generally accepted/that the physical model of the steel/
concrete interface consists of a layer of a compact iron oxide film (in the passive stage) and an interfacial film adjoined to
the concrete rnatrix.I1 •13,20Th,,'hiterfac:ialfilm corisists of
Ca(OHh deposits and other cement hydration products de-posited onto tlie' surface of the steel. It also involves the
change ofdielciCtric constant.due.tlltlle.diftilstoh'of ironックセ^
=;- .
セMMセM
ゥ、・ウᄋゥョゥャャᄋゥィG[セャiァ[[セセヲヲイゥヲオCセセセセエセエセケLLセセwセセZMMMM
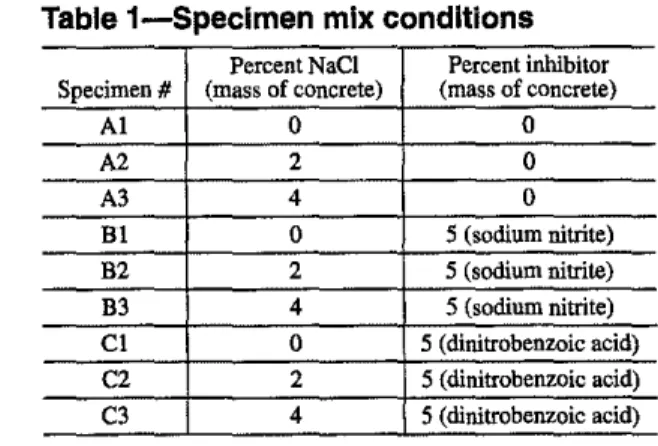
Table 1-Speclmen mix conditions Percent NaCI Percent inhibitor Specimen# (mass of concrete) (mass of concrete)
AI 0 0 A2 2 0 A3 4 0 BI 0 5 (sodium nitrite) B2 2 5 (sodium nitrite) B3 4 5 (sodium nitrite) CI 0 5 (dinitrobenzoic acid) C2 2 5 (dinitrobenzoic acid) C3 4 5 (dinitrobenzoic acid)
Table 2-RC parameters determined from the simulation
Rc.rl Ce,nF I-at Rj,n cjGセ 1-0., Rp.fl CdI.mF ャセ。S
AI 315 2.03 0.95 243 146 0.47 6894 21.9 0.6 A2 190 4.55 0.99 139 135 0.57 3313 59.6 0.43 A3 110 1.24 1.0 156 649 0.37 1406 55.5 0.57 BI 500 7,41 0.80 320 148 0.43 11,459 4.56 0.74 B2 275 1.62 0.99 368 150 0.49 3680 7.76 0.51 B3 150 4.14 1.0 224 165 0.52 6181 4,45 0.51 CI 247 36.2 0.80 242 116 0.54 8339 9.76 0.57 C2 130 7.90 1.0 440 180 0.40 5925 21.4 0.51 -C3 80' ·0;96-·-1.0-BRVTセ ··349-- 8.36 ·1·2-24 ··-23:0·· 0.47 . - - - ...
--387. Shrink Tubing SBIcone SteelReinforcement 3'
Z'
Rp
Cdl(co)
Surface
corrosion
process
5S14'Fig. 2-A schematic diagram ofa typical concrete test specimen
Interfacial
Film
1
1
Ri
Ci(co)
--Concrete
matrix
effect
(8)
(b)
Rc
Cc(ro)
ZII
Fig. 1-(a) The equivalent circuit consists ofthree parallel combinations ofa pure resistor and a frequency dependent capacitor; (b) Corresponding impedance plot in the complex plane (Nyquist plot)
rameters in equation (I) are defined elsewhere9-13and their abbreviations are given below:
• Rcand Cc-the concrete resistance and matrix solidi liquid interface capacitance;
• Rjand C,-steeVconcrete interface film resistance and capacitance;
• Rpand Cd!-rebar polarization resistance and steel
sur-face double layer capacitance.
It should be noted that there are a few simplifications as-sociated with the above equivalent circuit fitting process. The diffusion process (Warburg impedance) that usually is the controlling step in the low frequency measurement is not considered (points showing a 45 degree straight line at the very low frequency were omitted to reduce the error intro-duced by such a process). The fitted values ofRpand Cd!
rep-resent "overall conditions" of the surface steel corrosion and
theRp does notゥ、・ョセヲケ the passive or active corrosion areas
even though the latter has the major contribution to the mea-suredRp •The value of Cd! is not a true double layer
-2000 -50 (0) (c) -1600
f
-40 :g
-1200 A1,
I
>11
A1 -30I
f
I
-800 -20!
Jr- A2セ
-400 -10 A3 0 0 0 400 800 1200 1600 2000 -6 -3 0 3 6Real (Ohms)
L.og(freq.)
QPPNャMNセMセセMセセMセセGMG -6 -3 0 3 6
L.og(freq.)
800 200 400 600 Real (Ohms) . -400 10000 (b) A1 (d)I
-300 A2,N
A2i
rG A3.a
-200.g
1000I
::IE -100Il
,j
I".
セFig. 3-Impedance spectra and simulation for the control reinforced concrete specimens. (a) Real vs. Imaginary plot; (b) Enlarged Real vs. Imaginary plot; (c) Phase angle vs. Log(frequency) plot; and (d) Log(modulus) vs. Log(frequency) plot. The circles represent the experimental data, and the solid line is a computer simulation curve. Curves numbered I, 2, and 3
correspond to the chloride contents of 0,2,and4percent
tance and may include pseudo-capacitance due to adsorption of various ions. Zl Regardless of the deficiencies, the fitting process of the equivalent circuit still provides a reasonable approximation for this study.
reinforcing bars (1.27 cm cjl x14cm long) were sand blasted prior to use. Both ends of the rebar were sealed with silicone. Only the middle section (7 cm) of the bar was left exposed to the concrete. The exposed rebar area is approximately 28
cm2 Specimens were moist-cured for seven or more days
EXPERIMENTAL before they were placed in a3.4percent (by mass of cement)
Specimen preparation-Nine "lollipop-like" concrete sodium chloride solution.
specimens containing0-4percent chloride ions and 5 percent Experimental set-up-To determine the corrosion rate of
of the various corrosion inhibitors were cast (percentages are the reinforcing bar the test specimens were placed in a tap based on mass of cement). Type 10Portland cement was water bath containing3.4percent sodium chloride. The so-used for all specimens. The chemical composition (mass. lution was aerated for at least fifteen minutes prior to testing percent) was as follows:SiOz'"19.83;CaO
=
61.21;PeZ03=
and throughout the tests. A copper/copper sulfate reference3.20;Alz0 3= 4.\8;MgO= 4.09;S03= 3.93;NazO= 0.45 electrode of diameter about2.54cm was used for each test.
andKzO= 0.82.Thecement: sand: aggregate ratio was I:2:3 The connter electrode consisted of a stainless steel
cylin-and a water/cement ratioッヲosキ。ウオウ・、Ntセ「ャ・ャ summariz·' drical shell(20cm in height and 10 cm in diameter) to en-- es'!heamount,of.additiv.lLusedinceacJ1cn!i,JPThe specimen---s'tire.a symmetric.c\!rremdisJri!>Ji®ll during 'the
laQteセM|Zゥuャ。・ャャョ・stッイ evaluating rate
of
corroslonfromcurrent.denslty48._
arcs and only polarize the rebar locally). Linear polarization and a.c. impedance techniques were used.
Linear polarization-Tests were conducted using
aPoten-tiostatlOalvanostat and an associated software package to control the test procedures and analyze the data. Polarization experiments were performed at a scan rate of 0.1 mV/s (ASTM 059 recommends a scan rate of < 0.1667mV/s). They were initiated at 20 mV below the corrosion potential
Corrosion current density(jlA/cm2) lcorr< 0.1-0.2 0.2<lcorr< 0.5 0.5<leorr<5.5 5.5 <leorr<100 Rate of corrosion .----Passive state Low rate Moderate to high rate
High rate
and te=inated at a maximum of 20 mV above the corrosion potential.tィBG、uイゥャエゥッャ|HIヲセ。」iゥNエ・ウエキ。ウc「・エキ・・イイV\oャ、WiャゥャイエGᄋᄋ
. utes. Three tests were pefformed on each specimen with at least 15 minutes between consecutive tests on the same sam-ple to allow the reinforcement to depolarize. The IR drop was corrected(Rp =/iVllmeasured-Rc') using the concrete
re-sistance obtained in impedance measurement (Table 2).
A.C.impedance-A small sinusoidal voltage signal of 10
mV was applied over the range of frequencies 75kHz to 0.5 mHz. The current required to cause this voltage perturbation was measured as well as the.phase shift of the current and voltage characteristics. A three electrode configuration was used. These tests were done using a SI 1255 HF Frequency Response Analyzer and a SI 1286 Electrical Interface and as-sociated software Zplot to control the test procedures and an-alyze the data.
(0) 6 3
o
81-3
-50 (c)I
-40I
-30-&
セ
-20J
l1. -10 0 -6 6000 83 B2 4000 2000 oMGMMBMMMMMセMセMセMセMMMGo
- 6 0 0 0 , - - - , 81-
E
-4000i
1-
2000Real (Ohms)
Log(freq.)
-450 100000 (b)
•
(d)
-350 83 Bl 'iii'.E
10000セ
-250 NID 83 .5I
82 セ.s
-150 ::IE 1000 -50 100 0 200 400 600 800 -6 -3 0 3 6Real (Ohms)
Log(freq.)
Fig. 4-Impedance spectra and simulationfor the reinforced concrete specimens containing5percent sodium nitrite. (a) Real vs. Imaginary plot; (b) Enlarged Real vs. Imaginary plot; (c) Phase angle vs. Log(frequency) plot; and (d) Log(modulus) vs. La(frequency) plot. The circles represent the experimenral data and the solid line is a computer simulation curve. Curves numbered1.2.and3correspond to the chloride contents ofO,2.and4percent
6 6 (d) 3 3
o
-3 -3 C1 1ッッNャMセMMGMMMセセMセMセMBGGMMMG -6CZ
(c) C1 -10 -20Log(freq.)
- 5 0 , - - - , -30 -40 1 0 0 0 0 . , . - - - ,CZ
!:i
C3!!i
1000i
2500 C1 C1C2
600 ZOOO ZOO 400 Real (Ohms) (b)o
PNlキセZZNNNNNNNNNセセセセセセMG o 500· 1000 1500 (a) Real (Ohms) -150 - 3 5 0 . , - - - . . . . , MRUッッMイMMMMMMMMMMMセ -50 -2000-t:::::
-500 I-Z5of
1
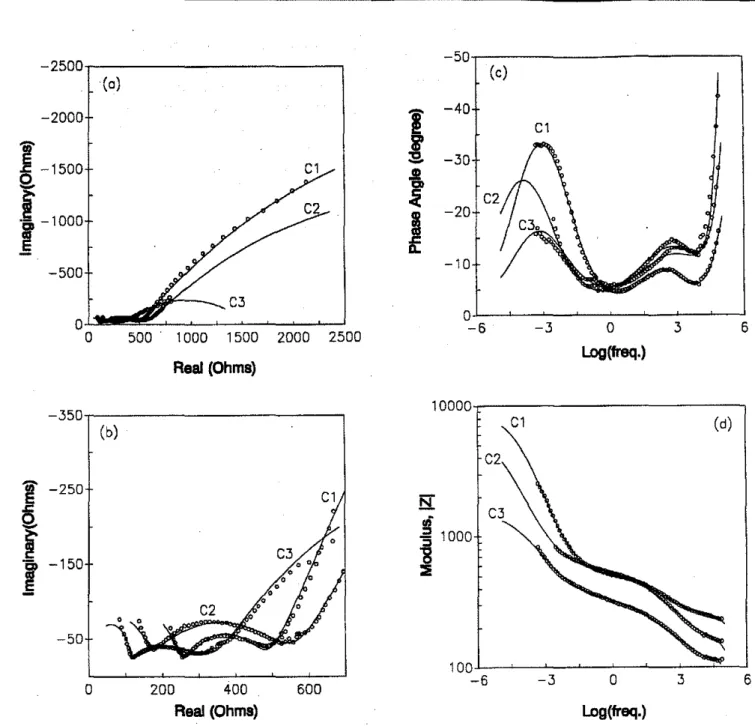
Fig. 5-Impedance spectra and simulation for the reinforced concrete specimens containing5percent dinitrobenzoic acid; (a) Real vs. Imaginary plot; (b) Enlarged Real vs. Imaginary plot; (c) Phase angle vs. Log(frequency) plot; and (d) Log(modulus) vs. Log(frequency) plot. The circles represent the experimental data and the solid line is a computer simulation curve. Curves numbered 1,2, and 3 correspond to the chloride Contents ofO, 2, and 4 percent
RESULTS AND DISCUSSION
Impedance behavior and simulation of the steel- . concrete interlace
The impedance spectra obtained'fram the cantrol concrete specimens (A series) and concrete specimens containing S percent sodium nitrite(Bseries) and dinitrobenzoic acid (C series) are shown in Figures 3-S, respectively. Data are pre-sented in the plots of Real impedancevs. Imaginary imped-ance (Figures 3[a] and [b]-S[a] and [b]), Bode plots, e.g. Phase anglevs. Log(frequency) (Figures 3[c]-S[c]) and Log(modulus) vs, Log(frequency) (Figures 3[d]cS[d]). Curves numbered I, 2, and 3 correspond to the chloride con-tents of 0, 2, and 4 percent. Examination of all tbeimpedance spectr'Hliow-somecoffilllon chal'acteristicsglvenas follows: two partial arcs and an entire arc were obserVedinthree
!'re-quency regionsin the Real vs. Imaginary plots for all the concrete specimens. A tail of an arc depicted in the high fre-quency range (10kHz and higher) was followed by a de-pressed arc at frequencies ranging from 10kHz to IHz. In the very low frequency region a large and incomplete arc Corre-sponding to the surface corrosion process was observed. The three regions corresponding to these three arcs can also be distinguished in the Bode plots where three peaks or partial peaks of the phase angle shift were observed in the phase an-gie versus logarithmic frequency flots. Three slope changes in the logarithmic modulus,
I
Z , versus logarithmic fre-quency plots were also observed.The simulation results are given by the solid lines and are ::TIIustrated in Flgures 3.S.-'The enlarge<iReaLversus Imagi. __
v v v " ." - - - ,..--_._--
·--8
NNセHッI.
Vi"
400
セ
400
E
B
.c:
A
.c:
Q.
Q.
c
0c
a:
200
a:
200
A
エ]]MBBG[ZセMMGBB
0
0
40
C
30
CL
S.
20
8
10
8
0
A
0
2
2
3
3
4
4
(b)
5
5
2
2
3
3
4
4
A
c
5
5
0,4Pre-mixed Chloride Content
('J6)
Fig,6-(a) Plot ofthe
Rc
values vs, percentage ofpre-mixed chlorides and (b) Ccvs, percentage ofpre-mixed chlorides, Symbols represent:(0)control concrete; (+) concretecon-taining5percent sodium nitrite; and(+)concrete contain-ing5percent dinitrobenzoic acid
more clearly the simulation results, The Real versus Imagi-nary plot is not good enough to judge the excellence of the simulation since the simulation of the high frequency portion cannot be seen clearly, Therefore, presenting the simulation results in the Bode plot format is necessary, Excellent agree-ment between the cycles and the solid line, especially in the log (modulus),
IzI,
and phase angle versus log (frequency) plots, was obtained, This ensures the accuracy of the Rp and other RC parameters (Figures 3-5), The simulated RC pa-rameters are listed in Table2,Characterization of the steel/concrete interface
Concrete matrix-The concrete matrix high frequency arc
is usually observed at a few hundred kHz and higher fre-quencies, This phenomenon was ftrst observed by McCarter et al,25,26 and investigated by othersP-32It is noted that the size of the bigh frequency arc decreases with an increase· of ionic concentration of the pore solution and porosity of the hydrating cement paste or concrete systems,32 The simulated
Reand Cevalues are plotted against the pre-mixed chloride content (Figures 6[a]-[b]). The values of concrete resistance,
Re,decrease with an increase of chloride content in the con-crete mix as expected, The specimens containing sodium ni-trite, however, appear to have the largest concrete resistance values. This is unexpected since addition of ions should
de-ACI Materials Journal
I
September-October 1997?
0,6-0.2
o
1
2
3
4
5
Pre-mixed Chloride Content
(%)
Fig. 7-(a) Plot ofthe R; values vs. percentage ofpre-mixed chlorides; (b) Civs. percentage ofpre-mixed chlo-rides; and (c) l-U2 vs. percentage ofpre-mixed chlorides. Symbols represent:(0)control concrete;(+ )concrete con-taining5percent sodium nitrite; and(+)concrete contain-ing5percent dinitrobenzoic acid
crease the concrete resistivity. TheRevalues of the samples containing dinitrobenzoic acid are smaller compared to the controls (Figure 6[a]). The acceleration effect of nitrite addi-tion and the retardaaddi-tion effect of dinitrobenzoic acid addiaddi-tion on cement hydration and concrete microSlrnctural develop-ment may be the reason, however, the chloride ion and po-rosity profIles need to be determined to confmn the estimated levels. The concrete matrix capacitance, Ce' is usually in the pF-nF/cm2 level. The factors responsible for this capacitive behavior are! not quite clear. Contributions due to the dielectric characteHstics and the liquid/solid inter-facial effect ofcement or cohcrete have been
ウオァァ・ウエ・、NSQNセS
In this stody, it appears that the corrosion-inhibiting addi-tives do not make a siguiftcant difference to the values ofCc
391
i '
Z'
_.
Z'_.
セセ NO Nセ-1
...
-
1
I t t _.."
..
--,> セ--
.j,-,,-
,-Z' Z'15000
B
'iii"10000
E
C
,l::Q.
A
{f
5000
a
a
60
2
3
4
(0)
5
<: o.
セ8
'5
セ
セ
_
Initiation _ _
Propagation _ _
Fig. 9-A schematic illustrating the reinforcement
corro-sion process in concrete and the corresponding changes to the impedance spectrum
pendent of overpotential20However, Sagoe-Crentsil et aI., in a later study, proposed that the arc was due to change of dielectric properties and the thickness of the steeVconcrete interface film. 13 This film could be a layer of precipitated ce-ment hydration products including calcium hydroxide and calcium silicate hydrates that deposit on the surface of the steel bars.It has been reported that this arc in the Real versus Imaginary plot was notobserved for the fresh or non-corrod-ed reinforcnon-corrod-ed concrete or for the steel· in calcium hydroxide solution systems. 13 It may suggest that the chemical and physical properties of this interfacial layer are similar to those of the cement or concrete matrix. This arc therefore
cannot be distinguished from the matrix arc in most cases in
the impedance measurements (except for the extreme case of significant microstructural differences existing in the steeV concrete interface zones). The corrosion products or the "rust" in this zone can be indicated by the appearance of the arc in the kHz frequency range in the impedance spectrum. The observation of an interface film in all the experimental measurements may suggest that the tested specimens have
undergone a certain amount of steel corrosion.
Another difficulty associated with the interface film is that the thickness of the film is unknown and it can change with time. This reality makes the interpretation of Riand Ci some-times very ambiguous. The simulated parameters, e.g., Ri,
Ci,andU],are plotted in Figure 7[a]-7[c]. UnlikeRc' the
sim-ulated Ri values ranging from 150-450 Ohms (or 5.35-16.1 Q/cm2)do not decrease with the amount of pre-mixed chlo-ride content.It is not clear what defines the interface film re-sistance, Ri• The values of Ci vary between 100-200 IlF
(3.57-7.14IlF/cm2) for all the specimens except for A3 and C3 for which the values are 649 and 349 IlF (23.2 and 12.4
IlF/cm2)respectively. Thea2values vary from 0.36 to 0.57 indicating the presence of highly distorted arcs.
This arc may be used as a qualitative indication for rebar
corrosion. However, its use to quantify the corrosion rate
would not be accurate.
Steel corrosion process-The third arc is due to the steel
sur-face corrosion process which is normally represented by the
5
4
3
2
o
(c)
o
2
3
4
5
Pre-mixed Chloride Content
(%)
0.4
0.2
0.6
0.8
Fig. 8-(a) Plot of the Rpvalues vs. percentage ofpre-mixed chlorides; (b) Cdt vs. percentage ofpre-ofpre-mixed chlo-rides; and (c) I-a] vs. percentage ofpre-mixed chlorides. Symbols represent:(0)control concrete; (.) concrete
con-taining5percent sodium nitrite; and(+)concrete
contain-ing 5 percent dinitrobenzoic acid
which range from 0.96-9.7 nF (except for CI). These capac-itance values lead to estimates of concrete dielectric constant values between 103_104 which seem to be unreasonably high. This value may contain errors due to the electrode and the liquid/solid interfacial effects of the cement system.It is apparent that this experimental set-up is not suitable for con-crete dielectric property measurement.
Inteifacefilm-Iohn et at. were possibly the first group to
report the observation of the second arc. tt They suggested that such an arc was due to the precipitation of lime on the surface of the rebar. This speculation was supported by Wenger and Galland who determined that this arc was
ij
4
Pre-mixed Chloride Content (%)
2Fez++ 20H' + 2NOZ--+2NOt
+
FeZ03+
HzO (2)I
1.5I
1.2.5
d
0.9$
l
0.6 0.3j
a
a
2 4!
0.8 (b)l
0.6 0.4j
0.2 393Elg. II-Plot ofcorrosion current densities vs. percentage ofpre-mixed chlorides. (a) Corrosion current densities were calculated using Stem-Geary equation withB=50 mV and
Rp
obtainedfrom the impedance spectra simulations; (b) corrosion current densities were determined by linear polarization measurementsThis reaction is much more rapid than the transport of fer-rous ions via chloride ion complex formation.36 Thus nitrite ions aid in the production of the stable passive layer even in the presence of chloride ions.Z9,31 However, its full protec-tion depends greatly on the concentraprotec-tion of aggressive ions such as the chloride ion. A CrlNOz ratio < 1.0 to 1.5 was suggested as a precaution against corrosion in reinforced .concrete.z Insufficient nitrite concentration has been report-ed as increasing the corrosion activity.38 The corrosion pro-tection of dinitrobenzoic acid is via its carboxyl group (RCOO') which forms a strong chemical bond with iron. This lowers the reactivityof iron atoms on the surface and fa-cilitates passivation.38 The NOz group in dinitrobenzoic acid may provide additional protection but the effect is much more moderate than that of sodium nitrite.
The process of reinforcement corrosioninconcrete is
usu-iilly divided into two periods: an initiation period and a prop-agation period as indicated in Figure 9.39 These two periods
maybeidentified qualitatively by observing the changes in
Effectiveness of corrosion Inhibitors
Sodium nitrite is a typical anodic corrosion inhibitor. It is .. thought that nitrite ions compete with chloride ions for ferrous ions and react with fe'!"us ions to produce ferric oxide34-37:
I
50 -AI
-+-8 40 -+-Ct
30J
20j
10セ
a
-1a
2 3 4 5PIlHIIIxedChloride
content
('*')Fig. IG--Plot ofthe maximum phase angle shift vs. percent-age ofpre-mixed chlorides. Symbols represent: (.) control
concrete; (.) concrete containing5percent sodium nitrite:
and (+) concrete containing 5 percent dinitrobenzoic acid
ACI Materials Journal
I
September-October 1997.. double layer capaliitallce.Cd!';';a the
jャoャ。イゥコ。エゥッャャイ・ウゥウエ。ョ」・[NNセャxェ^qNTNャVjエエャjゥウセエャNゥウlャ|iャiGLiゥセェエェウN。ョNゥjj、ェ」。エゥッョエィ。エウ・B・イ・
Rp.ICsliotiIdbe
emphasiZed。ァ。ゥョMエィ。エゥィセR
pandCd!me<rpair'
",COlTQsIooJ1llsJaketiplaeeiniill these sjJ<iciniens: .of "measured" values obtained throughout thefittingprocess
and they are overall effects associated with rebar surface corro-sion kinetics. They should not be mistakeu simply for pure charge transfer resistance and electric double layer capacitance.
Normally. a complete arc is hard to obtain due to time and
equipment limitations, especiiilly when the measurements at
very low frequencies (belowO.OlmHz) are required.Cd!andRp
can be evaluated using equivaleut circuit simulation. The
simu-lated parameters, e.g. Rp •Cd!and
lX:J,
are listed in Table 2 andplotted versus chloride content in Figures 8[a]-[c).Rpdecreases
with an increase in the amount of pre-mixed chloride. Large
val-ues of Rpwere obtained from specimens containing sodium
ni-trite (except for specimen B2 which is considered to have undergone heavy corrosiou since some rust stains were ob-served on the top portion of the sample) and the control
speci-mens appear to have smiill values. Rp is the most relevant
parameter since it represents the corrosion resistance of the
re-bar.Itcan be usedtoevaluate the corrosion rate by applying the
Stem-Geary equation. A large Rprepresents a high corrosion
re-sistance. The corrosion resistance of these specimens with and without pre-mixed chlorides appears to follow the sequence:
ni-trite> dinitrobenzoic acid> control. In contrastto Rp•the
dou-ble layer capacitance.Cd!,appearstoincrease with pre-mixed
chloride content but the trend is not very clear with few excep-tions (A2 and B3). The control specimens, AI and A3, have the
largestCd!values (21.9 and 55.5mF). Specimens containing
so-dium nitrite have the lowest values (4.45 to 7.76mF). The values
ofCd!fiill into the range of159j,lF/cm2to1980j,lF/cmz(with the
geometrical area normalization) which are larger than the pure
double layer capacitance ca. 4Oj,lFlcmz. TheCd!value here is an
overall capacitance containing a double layer capacitance and a pseudo-capacitance associated with adsorption species on the
rough rebar surface.Itshould be also noted that the values of
lX:J
for all the specimens are larger than 0.4 except for BI(which is
0.26). The value of
lX:J
has been usedtocharacterize thecorro-sion extent of the reinforcing steel qualitatively. Insignificant·
ACKNOWLEDGMENTS
Thanks are due Messrs. M. Amott,B. Myers, and Gordon Chan for their help withtheexperimental apparatus. Special thanks to Professor N.J.g。イ、セ
ner, University of Ottawa, Department of Civil Engineering, for his advice.
CONCLUSIONS
I. Impedance measurement in the low frequency region provides information related to surface corrosion occurring in reinforced concrete. Equivalent circuit models can be used to simulate the impedance spectra. The RC parameters ob-tained from impedance simulation including the maximum phase angle shift and polarization resistance can he used to characterize the degree of rebar corrosion and evaluate the effectiveness of corrosion-inhibiting additives with and without the presence of pre-mixed chlorides.
2. The corrosion current density can be estimated by knowing the polarization resistance, Rp' determined in the equivalent circuit simulation of the experimental spectra, and using the Stem Geary equation. The relative values of the corrosion current densities determined by impedance measurement were confirmed by those determined using liu-ear polarization techniques.
3. It appears that the corrosion protection performance provided by sodium nitrite is helter than that provided by dinitrobenzoic acid. The corrosion current densities of the
reinforced concrete specimens are in the order of: sodium
ni-trite<dinitrobenzoic acid<coutrol in both cases with and without pre-mixed chlorides.
In accordance with Table 3, the corrosion activity of the
re-inforced concrete samples containing nitrite appears to be in a passive state or low level even for those containing 4 percent (by mass of cement) cWorides. The corrosion protection per-formance provided by sodium nitrite is beller Ihan that provid-ed by dinitrobenzoic acid. These results were similar to those corrosion current densities determined by linear polarization measurement as indicated in Figure ll(b). The corrosion cur-rent densities of the reinforced concrete specimens are in the order of: sodium nitrite<dinitrobenzoic acid<control in the both cases with and without pre-mixed cWorides.
(3)
B
lcorr= 'if
,
the impedance spectrum. Normally there are two arcs in the impedance spectrum, e.g. the arcs corresponding to the con-crete matrix and the steel interface effect in the complex plane. This indicates a non-corroded reinforcement in the initiation period. The appearance of
ihe
interface film are, however, may imply an ongoing propagation period of rebar corrosion (Figure 9). Moreover, the maximum phase angle and polarization resistance can be used to estimate the present corrosion rate of the reinforcement.Phase angle characteristics
A decrease of the maximum absolute value of the phase angle of the steel surface kinetic arc has been used to de-scribe the degree of surface corrosion of steel by Mans-feld 40-44In a previous study by the authors,45the decrease of maximum phase angle was also observed in reinforced concrete specimens immersed in chloride solution. In this study, the maximum absolute phase angle was obtained from the simulation (Figures 3[c], 4[c], and 5[c]). The plot of ab-solute phase angle versus chloride content is given in Figure 10. Specimens without pre-mix chloride ions have the larg-est values of maximum absolute phase angle in the series. For example, the values of absolute phase angle are 31.5, 44.8, and 32.9 degrees for specimens AI, Bl, and Cl respec-tively (the concrete resistance may have affected the phase angle data; however, it does not change the argument in this study). The B series (samples containing sodium nitrite) ap-pear to have higher absolute values of phase angle than that of control and specimens containing dinitrobenzoic acid (ex-cept for specimen B2), The decrease of maximum absolute phase angle is attributed to the decrease of corrosion resis-tance of the rebar in concrete. This trend was obtained from both experiment and theoretical simulation.45
Rpand corrosion rate-Thecorrosion rate canbe
estimat-ed through the polarization resistance, Rp'determined in the equivalent circuit simulation of the experimental spectra. This approach is useful especially at very low frequencies when data is difficult to obtain experimentally due to time or equipment limitations. Corrosion current density is calculat-ed using the Stern-Geary equation as expresscalculat-ed below46:
REFERENCES
1. Strategic Highway Research Program-Research Plans,Final Report.
Technical Research Areas 43, TRA4-I-TRA4-60, May 1986.
2. Berke. N. S., and Weil, T. G., "World Wide Review of Corrosion
Inhibitors in Concrete," inAdvances in Concrete Technology, 2nd ed., editedbyV. M. Malhotra. Natural Resources Canada, 1983,pp.891-915.
where "B" is a function of the anodic and cathodic Tafel 3. Griffin, D.F.. "Corrosion Inhibitors for Reinforced Concrete," in Cor-(
セ セ ) rosion of Metals in Concrete, ACI SP-49, American Concrete Institute,
slopes,13a and
13c
= B -RNSPSHセBGK
セLI
. Detroit,1975,p.95.For the rebar corrosion, a"B"value of 26 or 52mV has been 4.Craig,R.J.,and Wood,L.E.t"Effectiveness of Corrosion Inhibitors
and their Influence on the Physical Properties of Portland Cement
Mor-used in the calculation for the hare steelin the active and pas- tars;'Highway Research Record,No.328,1970, p.77.
sive stages, respectively.47 Figure 11(a) illustrates the corro- 5,Treadaway,K.W.1.,andRussell, A. D.,Highways and Public Works,
sion current densities, calculated using B
=
26mV and Rp 36,40·,1968.. d . . 6.Slater,J.E., "Corrosionof Metalsin Association with Concrete," STP
obtame from the impedance spectra stmulatlons, of all the 818,Philadelphia,PA.ASTM,1983,p.53.
reinforced concrete specimens containing pre-mixed chlo- 7,Berke, N,sセL "Corrosion Inhibitors in Concrete," NACE Corrosion 89,
ride and corrosion inhibiting-additives."The calculated Rp Paper No. 445, National Association of Corrosion Engineers, New
may have an inherent error of 2 times since theBconstant Orleans,Apr.t989.
⦅Gカ。イゥ・セ
「・エキ・セョ
QセL
to 52セvNセ⦅セセNセイZL[・ウセエゥセァZ
MG⦅cヲ・セセセセ[
セセセ[ゥZ、jセセGイセセコNセvッセBGXGセセセセセ[セZNiセセセセセ
for Use inCon-エィ・MイエQエ・MッヲcッイイッウイッイイjヲqjQエMュN・。ァLpセゥェGMcNuitセNャAォBセセsャエyセャョMイ・ャセ[MM ..-,MMセセBᄋᄋGY[Meー・ャ「ッゥョLLMiML[Gg。「イゥ・ャャゥLセ[[セk・セセ。ュ[MMm[[ and-l'akenouti, H.,in.Come:
forced concrete is
givenint。「ャ・S[LLセZLᄋL[BOᄋ[L[Z[セBエWZ\LL[LALゥG\ZGセBZZZGO^ZG ,-,"o;'--""'pfehensive,Tr'eatisf.p!ElectrQchemislry,'Vot.A.セゥセ、L「ケ J.O'M.Brekris,i
'IIii
I
I
I
I
fl f'B. E. Comway,li Yeager, and. R.E, Wltite, Plenum.Press,New York, 1981. sー・」エイッウ」ッーケLGᄋjNaュNc・セ Soc.,Vol.75. No,4,1992,pp. 939-945.
"p:151.
:·__
MBSPLNg|ャij_Zセセセ・セM]Mーセセjャ・。ᆬ、LPhエ[[A[ゥjセイセゥゥエbョェセ・。オLKセaLH[セQイョー・、。ョ・・MMGャoセMbッョ。ョッウ[GnZセsエ・・ャ・[bZchM[bゥゥエャ・イLMr pN[GjッィdウッョLMZMwZMbセセBキッュゥャャ[Zᄋ]セセセ [ッWGLウセ」エイッウ・NエGZーケZidエMGLnセセ⦅エ[AエG⦅セy。ャ・ョエ Circuit Model forHydratedPortland W.L.;MacDonald, D. D.; and McKubre, M. C.R,Application oflmped;;. , "--CementPaste,"Cem.Coner.Res.•Vol. 22, No. 5.1992,pp. 833-840. ance Spectroscopy,Ch. 4, editedbyJ.R. McDonald, Wtley& Sons, NY, 31. Gu,P.;Kie. P.; Beaudoin, J.J.;and Brousseau, R.o"A.C.lmpedance
1987. Spectroscopy00:Microstructurai Characterization Hydrating Cement-Sil-11. John. D.gLセ Searson, P. C.; and Dawson,1. L.,"Use of ACiュー・、セ icaFume Systems," Cem.(;cJncr. Res., Vol. 23, No.l,.l993a. pp.157-168. anoo Technique in Studies on Steel in Concrete in Immersed Conditions," 32 Xu, Z.; Gu, P.; Xie, P.; and Beaudoin,J. J., "Application of A.C.
Br. CorrosionJ., fl6, 1981, pp. 102-106. Impedance Techniquesin Studies of Porous Cementitious Materials,(m. 12. Alonso, M. C., and Andrade, C., "Corrosion of Steel Reinforcement Relationship between ACIS Behavior and the Porous Microstructure," in Carbonated Mortar Containing Chloride," Advances in Cement Cern. Concr. Res., Vol. 23, No.4, 1993, pp. 853-862.
Research, Vol. I, 1988, pp. 155-163. 33. Coverdale, R. T.; Christensen B.J.; Mason T. 0.; and Jennings, 13. Crentsil, K. K. S.; Glasser,F.P.; and Irvine, J. T. S., "Electrochemi- H. M., "Interpretation of the Impedance Spectroscopy of Cement Paste via cal Characteristics of Reinforced Concrete Corrosion as Determined by Computer Modelling: PartnDielectric Response," Journal of Mat. Sci., Impedance Spectroscopy;'BritishVoL 27, 1992, pp. 113-318. VoL 29, No. 19, 1994, pp. 4984-4992.
14. Crentsil, K. K.S.; ¥l1maz, V. T.; and Glasser,F. P., "Impedance 34. Ehrlich, S. G., and Rosenberg, A. M., "Methods of Steel Corrosion Spectroscopy Analysis of the Influence of Superplasticizers on Steel Cor- Control and Measurement in Concrete,"inMaterials Science of Concrete
rosion in OPC Mortar," Journal oj Materials Science Vol. 27, 1992, pp. II, edited by J. Skalny and S. Mindess, The American Ceramic Society,
3400-3404. Inc., 1991, pp. 201-219.
15. Hachani,L.;Carpio,J.;Fiaud, C.; Raharinaivo,A.; and Triki. E., 35. 'EI-Jazairi, B.; Berke, N. S.; and Grace, W. R'The Use of Calcium "Steel Corrosion in Concrete Deteriorated by Chlorides and Sulphates: Nitrite as a Corrosion Inhibiting Admixture to Steel Reinforcementin Con-Electrochemical Study Using Impedance Spectrometry and Stepping down crete,"inCorrosion of Reinforcement in Concrete Structures, edited by
the Current Method," Cem. Concr. Res., Vol. 22,1992, pp. 56-66. C. L. Page,K.W. I. Treadaway, andP. B. Bamforth, published for the Soci-16. Hachani, L.; Fiaud, C.; Triki, E.;.and Raharinaivo,A., "Characteris· ety of Chemical Industry by Elsevier, London, 1990, pp. 571-585. tics of Steel/Concrete Interface by Electrochemical Impedance Spectros- 36. Baidis.J.M., and Rosenberg, A. M., 'The Inhibition of Chloride-copy:' British Corrosion Journal, Vol. 29, 1994, pp. 122-127. Induced CorrosioninReinforced Concrete by Calcium Nitrite," Cement,
17. Macdonald, D. D.; El·Tantawy, Y.A.;Rocha-Filho, R. C.; Urquidi- Concrete. andAggregotes, Vol. 9, No. I, 1987. pp. 30-33.
Macdonald, M.• "Evaluation of Electrochemical Impedance Techniques for 37. Nmai, C.K.,and Krauss, P. D., "Comparative Evaluation of Corro-Detecting Corrosion on Rebar in Reinforced Concrete," National Research sion-Inhibiting Chemical Admixtures for Reinforced Concrete,"in
Dura-Council, Washington, D.C., SHRP-IDIUFR-91-524, 1994. bilityoj Concrete, third International Conference, Nice, France, edited by
18. Wenger, E, and Galland,1.,''Analysis of Local Corrosion of Large V.M. Malhotra, published for American Concrete Institute, 1994, pp. 245-Metallic Structures or Reinforced Concrete Structures by Electrochemical 282.
Impedance Spectroscopy," Electrochimica Acta Vol. 35, 1990, pp. 1573- 38. Rozenfeld,1. L., Corrosion Inhibitors, McGraw-Hill International
1578. Book Company, 1981, Part 2, Cbapter 5, pp. 145-180.
19. Wenger, E, "Etudedela Corrosion de L'ader Doux dans Ie Beton 39. Thutti, K., "Service Life of Structureswith Regard to Corrosion of par des Methodes Electrochimiques, Application au Contr6le des Ouvrages Embedded Steel," in Perfonnance of Concrete in Marine Environment, de Genie Civil," Metaux Corrosion lndustrie, No. 742, June 1978. edited byV.M. Malhotra. ACI Publication SP-65, Detroit, 1980, pp.
223-20. Lemoine,L.;Wenger,F.;and Galland. J., "Study of the Corrosion of 236. Concrete Reinforcement by Electrochemical hnpedance· Measurement,"
"C ' R fS l' C "ASTMSTPI065 ediedb NS 40. Mansfeld,F.;Kendig,M.W.;and Lorenz,·W.J.,"CoITosionInhibi-orrOSlon ates0 tee m oncrete, , t y . , . tion in Neutral, Aerated Media," J. Electrochem. Soc., Vol. 132, No.2, Berke, V. Cbaker, and D. Whiting, Philadelphia, PA, ASTM, 1990, pp. 1985, pp. 290-296.
118-133.
41. Mansfeld, E, and Shih, H., "Detection of Pitting with Electrochemi-21 Andrade, C.; Merino, P.; Novoa, X. R; Perez, M. C.; and Soler, L., 135 4 9 "Passivation of Reinforcing Steel in Concrete," Materials Science Forum, cal Impedance Spectroscopy," J. Electrochem. Soc., Vol. ,No., 1 88.
Vols. 192-194, 1995, pp. 891-898. p p . I I 7 1 - 1 1 7 2 . '
22. Andrade, C.; Maribona,I.R.;Feliu, S.; Gonzales. J.A.;and Feliu, Ir., 42. Mansfeld, F.; Un, S;;Kim, S.; and Shih, R., "Pitting and Surface S., ''The Effect of Macrocells between Active and PassiveAreasofsセャ Modification ofSIC!AI," Corrosion Science, Vol. 27, No.9, 1987, pp. 997-Reinforcements," Corrosion Science, Vol. 33, No.2, 1992, pp. 237-249. 1000.
23. Sluyters-Rehbach, M., and Sluyters, I. H., in Electroanalytical 43. Shih, R., and Mansfeld, E, "A Fitting Procedure for hnpedance
Chemistry, Vol. 4, edited by A.J. Bard and Marcel Dekker, New York, Spectra Obtained for Cases of Localized Corrosion," Corrosion, Vol. 45,
1970, pp. 1-125. No.8, 1989, pp. 610-614.
24. Cole,K. S.,and Cole. R.H.,"Dispersion and Absorptionin Dielec. 44. Mansfeld, F.j Lin, S.;Kim,S.;andShihH.."Corrosion Protection of tricsI. Alternating Current Characteristics," J. Chern. Phys., Vol. 9, 1941, AI Alloys and AI-Based Metal Matrix CompositesbyChemical
Passiva-pp.341-351. tioo,"Conusion,Vol. 45, No.8, 1989, pp. 615-630.
25. McCarter W. I.; Gearing S.; and Buzzed N., "Impedance Measure- 45. Ping, Gu; Yan, Fu; Ping. Xie;J.J., Beaudoin, -"Characterization of ments on Cement Paste,"1.Mater. Sci.Lett.,Vol. 7, No.to,1988, pp. 1056- Surface Corrosion of Reinforcing SteelinCement Paste by Low Frequency 1057. Impedance Spectroscopy," Cement and Concrete Research, Vol. 24, No.2,
26. McCarterW.I.,and Brousseau R., ''The A.C. Response of Hardened 1994, pp. 231-242.
Cement Paste:' Cem. Concr. Res.. Vol. 20, No.6, 1990, pp. 891-900. 46. EG&G, Princeton Applied Research Application Note-140 '1..inear 27. Brantervik, K., and Nildasson, G.A., "Circuit Models for Cement Polarization" and Note-148 ''Tafel Plot."
Based Materials Obtained from Impedance Spectroscopy," Cem. Concr. 47. Andrade, C., and Gonzales. J. A., "Quantitative Measurements of
Res., Vol. 21, 1991, pp. 469-508. Corrosion Rate of Reinforcing Steels EmbeddedinConcrete using Polar-28. Scuderi, C. A.; Mason, T. 0.; and Iennings, H. M., "Impedance ization Resistance Measurements," Werkstoife und Korrosion, Vol. 29, Spectra of Hydrating Cement Pastes,"J. Mater. Sci., Vol. 26, 1991, pp. 1978, pp. 515·519.
349-353. 48. Andrade, C., "Quantification of Durability of Reinforcing Steel," in 29. Christensen, B.J.;Mason T.0.;and Jennings, H. M., "Influence of Concrete Teclmology, New Trends, Industn'al Applications. edited by A.
Silica Fume on the Early Hydration of Portland Cements Using Impedance Aguado, R Gettu,andS. P. Shah,セfn Spon, London, 1994, pp. 157·175.