Evidence of negative energy balance using doubly labelled water in elite
Kenyan endurance runners prior to competition
Barry W. Fudge
1, Klaas R. Westerterp
2, Festus K. Kiplamai
3, Vincent O. Onywera
3, Michael K. Boit
3,
Bengt Kayser
4and Yannis P. Pitsiladis
1*
1International Centre for East African Running Science (ICEARS), Institute of Biomedical and Life Sciences, University of Glasgow, Glasgow, G12 8QQ, UK
2Department of Human Biology, Maastricht University, PO Box 616, 6200 MD Maastricht, The Netherlands 3Department of Exercise and Sports Science, Kenyatta University, PO Box 43844, Nairobi, Kenya
4School of Physical Education and Sports, Institute of Movement Sciences and Sports Medicine, Faculty of Medicine, University of Geneva, Switzerland
(Received 29 March 2005 – Revised 20 June 2005 – Accepted 22 August 2005)
Previous studies have found Kenyan endurance runners to be in negative energy balance during training and prior to competition. The aim of the present study was to assess energy balance in nine elite Kenyan endurance runners during heavy training. Energy intake and expenditure were determined over 7 d using weighed dietary intake and doubly labelled water, respectively. Athletes were on average in negative energy balance (mean energy intake 13 241 (SD1330) kJ/d v. mean energy expenditure 14 611 (SD1043) kJ/d; P¼ 0·046), although there was no loss in body mass (mean 56·0 (SD3·4) kg v. 55·7 (SD3·6) kg; P¼ 0·285). The calculation of underreporting was 13 % (range 2 24 to þ 9 %) and almost entirely accounted for by undereating (9 % (range 2 55 to þ 39 %)) as opposed to a lack of significant underrecording (i.e. total water intake was no differ-ent from water loss (mean 4·2 (SD0·6) l/d v. 4·5 (SD0·8) l/d; P¼ 0·496)). Fluid intake was modest and consisted mainly of water (0·9 (SD0·5) l/d) and milky tea (0·9 (SD0·3) l/d). The diet was high in carbohydrate (67·3 (SD7·8) %) and sufficient in protein (15·3 (SD4·0) %) and fat (17·4 (SD 3·9) %). These results confirm previous observations that Kenyan runners are in negative energy balance during periods of intense training. A negative energy balance would result in a reduction in body mass, which, when combined with a high carbohydrate diet, would have the poten-tial in the short term to enhance endurance running performance by reducing the energy cost of running.
Energy expenditure: Doubly labelled water: Energy intake: Undereating: Intense high-altitude training: East African endurance athletes
Male Kenyan middle- and long-distance runners have domi-nated athletics since the 1960s, but until recently diet and nutrition in these athletes had not been comprehensively investigated. The diet of nine elite Kenyan endurance run-ners was investigated over a 7 d training period 1 week before the Kenyan national cross-country trials (Onywera et al. 2004). Energy intake (EI) was assessed by weighed dietary record and was significantly lower than energy expen-diture (EE) as assessed by the physical activity ratio (mean EI 12 486 (SD 1225) kJ/d v. physical activity ratio 15 069 (SD 497) kJ/d), suggesting that the athletes were in negative energy balance prior to competition. The mean difference of 2585 kJ/d between EI and EE accounted precisely for the loss in body mass over the 7 d period (mean body mass 58·9 (SD 2·7) kg v. 58·3 (SD 2·6) kg, where 1 kg was assumed to be equivalent to 30 000 kJ; Westerterp et al. 1995).
These results corroborated those of an earlier study evaluat-ing the nutrient intake of Kenyan runners (Mukeshi & Thairu, 1993). The reported EI in that study was low (9781 kJ/d), and considering that the athletes were training intensely, the
validity of these results was questioned by the authors of the only other study to have assessed the dietary intake of Kenyan runners (Christensen et al. 2002). Those authors stu-died twelve adolescent (15 – 20-year-old) male Kenyan runners during a 2-week period and found the athletes to be in energy balance (EI 13 186 (SD274) kJ/d v. EE 13 210 (SD283) kJ/d). Those athletes were, however, regarded as promising junior athletes competing at regional level and were studied during a period of regular training.
The dietary habits and energy balance of elite senior Kenyan endurance runners have not been comprehensively studied in the days prior to major competition. Since none of the previous studies used the doubly labelled water (DLW) method to measure EE, the aim of the present study was to directly measure the energy-balance status of elite Kenyan endurance runners prior to major competition using ‘gold standard’ methods. Taking previous results into con-sideration, we hypothesised that elite Kenyan endurance run-ners might be in negative energy balance prior to major competition.
* Corresponding author: Dr Y. P. Pitsiladis, fax þ 44 (0)141 330 2915, email Y.Pitsiladis@bio.gla.ac.uk
Abbreviations:ADMR, average daily metabolic rate; DLW, doubly labelled water; EE, energy expenditure; EI, energy intake. qThe Authors 2006
Methods Subjects
Nine elite Kenyan endurance runners with a mean age of 21 (SD 2) years and a percentage body fat of 7·1 (SD 2·5) % were invited to participate in this study (Table 1). All athletes gave their written informed consent prior to participating in the study. The research protocol was in accordance with the Helsinki declaration and was approved by the local Kenyan authorities in Nairobi, Kenya. The athletes were highly trained and included world, Olympic and junior champions frequently competing in major national and international middle- and long-distance running events. At the time of the study, the ath-letes were based at a high-altitude training camp (Global Sports Training Camp, Kaptagat, Eldoret, Kenya) situated in the North Rift Valley (altitude 2200 m above sea level, daytime ambient temperature 8 – 248C, relative humidity 31 – 100 %). All the athletes belonged to one of eight small tribes, collectively known as the Kalenjin (the Nandi, Kipsigis, Tugen, Keiyo, Marakwet, Pokot, Terik and Sabaot). The Kalenjin have a population of approximately 3 million, or about 10 % of the Kenyan population, yet have won about 75 % of all major distance running races in Kenya (Pitsiladis et al. 2004). The athletes were in peak physical condition as the investigation was undertaken in the week before the Kenyan Olympic trials and 5 months before the 2004 Athens Olympics.
Food and water intake
In order to ensure a representative sample of dietary habits, athletes were asked to follow their normal diet while weighing (using individual digital weighing scales readable to 1 g) and recording all food and water consumed for 7 consecutive days using a nutritional diary. The manager of the high-alti-tude training camp assured investigators that the 7 d dietary intake was typical of the diet during a period of intense train-ing. Meals and snacks were served at standard times of day: breakfast (08.00 hours), mid-morning snack (10.00 hours), lunch (13.00 hours), afternoon snack (16.00 hours) and dinner (19.00 hours). The athletes selected their portion sizes ad libitum from the food provided. The athletes were also required to weigh and record all food and water con-sumed away from the camp.
Data from the nutritional diaries were used to calculate the intake of total energy, carbohydrate, fat, protein and water using a computerised version of the National Food Compo-sition Tables of Kenya (Sehmi, 1993). Total water intake was determined by combining the reported dietary intake of water with the estimated metabolic water value. Metabolic water was determined by multiplying the measured EE by the fraction of energy in the diet obtained from carbohydrate, protein and fat (data derived from the 7 d nutritional diaries). The oxidation of carbohydrate, protein and fat yields 0·60, 0·41 and 1·07 ml water/g, respectively (Fjeld et al. 1988). In the calculations of the DLW method, we corrected for the effect on isotope abundance changes resulting from the exchange of water in the respiratory system. If, on a net basis, water is lost in the expired air, inspired water is partly taken up in the respiratory system, thus diluting the increases in isotope abundance induced by the DLW method. Inspired water (Fjeld et al. 1988) was calculated as:
Inspiratory water intake (g/d) ¼ Respiratory volume £ Absolute humidity/1000,
where respiratory volume (l/d) was estimated using CO2 production derived from the measurement of EE by the DLW method, assuming that 3·5 % of the expired air was CO2. The reported mean absolute and relative humidity were 10·2 mg/l (range 2·6 – 21·7 mg/l) and 75 % (range 31 – 100 %), respectively, at a mean ambient temperature of 168C (range 8 – 248C).
Body mass, energy expenditure and water loss
On the morning (05.30 hours) of the first and final day of the recording week, body mass and percentage body fat were measured by bio-electrical impedance (Tanita Body Fat Ana-lyzer, Tanita Corporation of America Inc., Arlington Heights IL, USA). The estimates of percentage body fat provided by the manufacturer’s software were reported. (The prediction equation used by the Tanita system is not disclosed by the manufacturer so the equation cannot be presented.) Measure-ments were made after the subjects had voided their bladder and before any food or drink had been consumed. EE was measured by DLW (EEDLW; see Westerterp et al. 1986).
Water loss was calculated from 2H elimination in accord-ance with the DLW method. Athletes were given a weighed dose of a mixture of 99·84 atom% 2H2O in 10·05 atom% H218O on the evening of day 0 in order to increase baseline
Table 1. Physical characteristics of elite Kenyan endurance runners
Subject Event Age Height (cm) Start BM (kg) End BM (kg) DBM (kg) BMI (kg/m2) Start % BF End % BF D% BF
1 Marathon 24 173 62·5 62·0 20·5 20·7 8·0 7·0 21·0 2 5000 m 23 175 54·8 54·6 20·2 17·8 6·5 7·0 0·5 3 5000 m 21 178 56·7 55·6 21·1 17·5 6·0 6·0 0·0 4 5000 m 25 171 54·9 54·8 20·1 18·7 9·0 9·0 0·0 5 10 000 m 23 176 54·8 54·4 20·4 17·6 5·0 5·5 0·5 6 10 000 m 18 171 51·0 49·3 21·7 16·9 6·0 4·5 21·5 7 1500 m 19 179 53·8 55·0 1·2 17·2 3·5 4·5 1·0 8 3000 m SC 20 173 55·2 55·5 0·3 18·5 8·0 8·0 0·0 9 5000 m 20 172 60·1 59·8 20·3 20·2 12·0 11·0 – 1·0 Mean 21 174 56·0 55·7 20·3 18·3 7·1 6·9 20·1 SD 2 2·9 3·4 3·6 0·8 1·3 2·5 2·1 0·8
levels to $ 300 ppm for2H and $ 2300 ppm for18O. A back-ground urine sample was collected on the evening of day 0, and additional urine samples were collected on day 1 (from the second daily void and in the evening), the morning and evening of day 3, and the morning and evening of day 7. A correction factor for the change in isotope dilution space was applied, as calculated from the difference between the initial and final study body mass of the athletes, assuming that the change in body water was linear and proportional to the change of body mass. DLW-measured CO2 production was converted to EE with an energy equivalent calculated from the macronutrient composition of the diet. BMR was estimated using the Schofield Equation (Schofield, 1985). A significant difference between EI and EE required the calculation of percentage underreporting and undereating as follows:
Under reporting ¼ [(EI – EE) / EE] £ 100 % (Goris & Westerterp, 1999)
Under eating ¼ [(D BM £ 30 000 kJ/7 d)/EE] £ 100 % (Lissner et al. 1998),
where BM is body mass.
Physical activity and training
The ActiGraph activity monitor (Manufacturing Technology Inc., Fort Walton Beach, FL, USA) and physical activity ratio were used to assess physical activity (Ainsworth et al. 2000). The activity monitor was secured to the right hip with a belt after being calibrated according to the manufact-urer’s specifications. The data were analysed according to Freedson et al. (1998) and Ainsworth et al. (2000). In short, waking time was subdivided in categories of activity ranging from light to very heavy, and relaxing to fast running, respect-ively. Subjects were also instructed to record in detail their individual activities each day (including the type, intensity and duration of activity). The Compendium of Physical Activity (Ainsworth et al. 2000) was used to assign specific activities with their respective metabolic equivalent. The Timex Bodylink system (Timex Corporation, Middlebury, CT, USA) was used accurately to determine the distance, time and speed of the training runs by utilising global posi-tioning system technology. Athletes wore the Timex Perform-ance (Timex Corporation) device during individual and group runs.
Data analysis
Data were expressed as means and standard deviations, or medians and ranges, as appropriate following a test for the normality of distribution. Paired t tests were used to compare EI v. EE, total water intake v. water loss, and starting body mass v. final body mass. The Pearson product moment corre-lation coefficient (r) was used to assess the recorre-lationship between EI and EE, as well as the relationship between per-centage underreporting and perper-centage energy derived from carbohydrate, protein and fat to determine whether there was selective underreporting. Statistical significance was set at P, 0·05.
Results
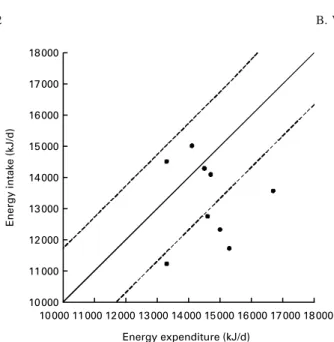
Values for EI, EE, BMR, ADMR/BMR (average daily meta-bolic rate/BMR), change in body mass, BMI, water intake, water loss, metabolic water and inspiratory water intake are shown in Table 2. The reported EI of 13 241 (SD 1330) kJ/d was significantly lower than the measured EE (EEDLW 14 611 (SD 1043) kJ/d; P¼ 0·046). The value calculated for per-centage underreporting was 13 % (range 2 24 to þ 9 %). There was no correlation between EI and EE (r – 0·071; P¼ 0·855) as shown in Fig. 1; line of identity and ^ 2SDare also shown.
The initial body mass of 56·0 (SD 3·4) kg was not signifi-cantly different from the final body mass (55·7 (SD 3·6) kg; P¼ 0·285); however, the vast majority of subjects lost body mass over the 7 d recording period. Percentage undereating was calculated as 9 % (range 2 54 to þ 39 %). The mean difference in EI (13 241 (SD1330) kJ/d) and EEDLW(14 611 (SD1043) kJ/d; P¼ 0·046) was 1370 (SD1738) kJ/d; when cal-culated over the 7 d period, this equated to approximately 9590 kJ, or alternatively 0·3 kg (where 1 kg was assumed to be equivalent to 30 000 kJ; Westerterp et al. 1995). Total water intake (including reported water intake, calculated meta-bolic water and inspiratory water) was 4·2 (SD0·6) l/d and was not significantly different from the measured water loss (4·5 (SD 0·8) l/d; P¼ 0·496).
Approximately 77 % of the energy consumed by the athletes was attributable to vegetable sources, the remaining 23 % coming from animal sources (Table 3). The diet consisted mainly of carbohydrate (67·3 (SD7·8) %; 9·8 g/kg body mass per d) compared with protein (15·3 (SD4·0) %; 2·2 g/kg body mass per d) and fat (17·4 (SD 3·9) %; 1·1 g/kg body mass per d). A daily variation in the macronutrient composition of the athletes’ diet was observed during the 7 d experimental period. The reported percentages of energy from carbohydrate (r 0·085, P¼ 0·828), protein (r 0·019, P¼ 0·962) and fat (r 0·187, P¼ 0·629) were not related to percentage underre-porting. Fluid intake was modest and consisted mainly of water (0·9 (SD 0·5) l/d) and milky tea (0·9 (SD 0·3) l/d), with a small contribution from other fluids such as soft drinks (0·4 (SD 0·2) l/d).
Table 2. Average energy intake (EI), energy expenditure (EEDLW), basal metabolic rate
(BMR), ADMR/BMR (average daily metabolic rate/BMR), change in body mass (DBM), BMI, water consumed, metabolic water, total water intake and water loss over the recording week
Mean SD EI (kJ/d) 13 241 1330 EEDLW(kJ/d)* 14 611 1043 BMR (kJ/d) 6408 224 ADMR/BMR 2·3 0·1 DBM (kg/week) 20·3 0·8 BMI (kg/m2) 18·4 1·3 Water consumed (l/d) 3·5 0·6 Metabolic water (l/d) 0·5 0·04 Inspiratory water (l/d) 0·2 0·01 Total water intake (l/d) 4·2 0·6
Water loss (l/d) 4·5 0·8
Time spent in activities during the waking hours estimated using accelerometry and the physical activity ratio is presented in Table 4. The reported time spent in light, moderate, hard and very hard activity, as determined by accelerometry, was 82 (SD3) %, 11 (SD2) %, 6 (SD3) % and 1 (SD1) % respect-ively. Time spent relaxing and in light activity, slow running (8 – 13·6 km/h), moderate running (13·7 – 17·3 km/h) and fast running ($ 17·4 km/h), as estimated using the physical activity ratio method (Ainsworth et al. 2000), was 82 (SD 6) %, 8 (SD 6) %, 3 (SD1) %, 5 (SD 1) % and 2 (SD1) %, respectively.
The morning run (06.00 hours) comprised a long run of 10·6 (SD 3·8) km carried out at either a moderate or a fast running pace (average running speed 15·1 km/h, maximum 24·0 km/h) depending on instructions received from the coach/manager (distances and speed determined by the Timex Bodylink (Timex Corporation) system). The late-morning (11.00 hours) training session was not compulsory and included light exercise such as jogging, stretching or walking. Athletes completed at least one weekly high-intensity interval training session on a 400 m dirt track. Typical interval training sessions included 4 £ 600 m at 1 min 30 s pace and 6 £ 400 m at a 58 s pace for the middle-distance runners, or 6 £ 600 m at 1 min 33 s pace and 6 £ 400 m at a 59 s pace for the long-distance runners. The late-afternoon run (17.00 hours) was a short run (6·2 (SD 1·3) km) usually run at an easier running speed (average running speed 14·7 km/h, maximum 15·2 km/h). The weekly training distance was in excess of 117 km (not including the late morning training session). The remainder of the time at the training camp was spent resting, eating and washing. Some athletes went home at the weekend and completed individual training runs as prescribed by their coach/manager.
Discussion
The average EI of the elite Kenyan runners investigated was lower than their EE (13 241 (SD 1330) kJ/d v. 14 611 (SD
1043 kJ/d; P¼ 0·046), suggesting that these elite runners Table
3 . Food s ources a s a percentage of daily intake of each macronutrient Food sources (%) Mean SD Sugar† B read Rice Potatoes Beans K ales Milk Maize Meat Ugali C hapatti Other‡ Animal Vegetable Energy (kJ) 13 241 1330 10 9 9 3 2 2 1 2 1 11 19 7 1 5 2 3 7 7 Carbohydrate (g) 552 81 15 10 12 4 2 2 5 2 0 25 6 1 7 5 95 Fat (g) 6 1 1 5 0 3 2 0 0 0 3 5 1 28 5 1 4 1 2 6 3 3 7 Protein (g) 122 33 0 8 6 2 5 1 0 1 7 1 38 6 4 3 5 5 4 5 † Sugar co nsumed in tea and porrid ge. ‡ Food sou rces that contribute less than 1 % to total e n e rgy in take. 10 000 11 000 12 000 13 000 14 000 15 000 16 000 17 000 18 000 Energy intake (kJ/d) 11 000 10 000 12 000 13 000 14 000 15 000 16 000 17 000 18 000 Energy expenditure (kJ/d)
Fig. 1. Relationship between energy intake from weighed dietary intake and energy expenditure measured with the doubly labelled water technique in elite Kenyan endurance runners. (——), line of identity; ( – – – ), ^ 2SD.
were, as a group, in negative energy balance during the study period of intense training. These results confirm those of pre-vious studies evaluating the food and macronutrient intake of Kenyan runners (Mukeshi & Thairu, 1993; Onywera et al. 2004). Combined with the subsequent outstanding perform-ances of these athletes, the observations raise the intriguing possibility that this seemingly unintentional negative energy balance during an intense training week just prior to major
competition may somehow benefit their race running
performance.
The reported EI of the elite runners in the present study (13 241 (SD1330) kJ/d) was very similar to that from a previous investigation carried out at the same training camp (12 486 (SD 1225) kJ/d; Onywera et al. 2004), but both were at the lower end of the range of 12 540 – 20 900 kJ/d recommended for endurance athletes during intense training (Grandjean, 1997). As in the present study, the data in the earlier study suggested that athletes were in negative energy balance. EE was, how-ever, estimated in the previous study using only the physical activity ratio, which may be subject to significant errors when applied to athletes of this calibre. For example, in the Compendium of Physical Activities compiled by Ainsworth et al. (2000), the fastest running speed possible is $ 17·4 km/h and is assigned 14 – 18 metabolic equivalents. However, the Kenyan athletes participating in both these studies would frequently run at much faster running speeds in training, and the metabolic equivalents assigned using the Compendium of Physical Activities would most likely underestimate the true metabolic cost, although this has yet to be demonstrated. Despite this limitation in deter-mining EE, the mean difference of 2583 kJ/d between EI and EE in the earlier study by Onywera et al. (2004) agreed precisely with the loss of body mass over the 7 d period (58·9 (SD 2·7) kg v. 58·3 (SD 2·6) kg). Estimated EE in that study (15 069 (SD 497) kJ/d) was also very simi-lar to EE measured in the present study (14 611 (SD 1043) kJ/d). The present study thus confirms and consolidates these earlier findings because of the more accurate method-ology used, i.e. DLW.
The negative energy balance in the present study was not accompanied by a significant loss in body mass (56·0 (SD 3·4) kg v. 55·7 (SD3·6) kg; P¼ 0·285), as previously reported (Onywera et al. 2004). Nevertheless, the energy equivalent of the non-significant change in body mass was very similar to the significant energy deficit when calculated over the 7 d assessment period (9000 kJ v. 9590 kJ, respectively, where 1 kg is assumed to be equivalent to 30 000 kJ; Westerterp et al. 1995). Failure to achieve and/or detect a significantly lower body mass over the 7 d period may be due to the slightly higher mean EI and lower EE in the current study. It can also be seen from Fig. 1 that there was considerable heterogeneity in the energy balance status of the athletes: five runners clearly in negative energy balance, two somewhat borderline and the remaining two runners in positive energy balance. Interest-ingly, both athletes in positive energy balance ran in the Kenyan National Championships (5 km and 10 km races) on day 5 of the investigation and had actually reduced their train-ing load in the days leadtrain-ing up to and after the event while appearing to maintain normal dietary habits.
Percentage underreporting, which expresses a measured energy deficit in the light of any possible inaccuracy of dietary intake recording, was calculated at 13 % (range 2 24 % to þ 9 %) in the present study. However, we found that it was almost entirely accounted for by undereating, which was cal-culated at 9 % (range 2 54 % to þ 39 %). It is unlikely that there was considerable underrecording in the present study since no significant difference was found between total water intake and total water loss (4·2 (SD 0·6) l/d v. 4·5 (SD 0·8) l/d; P¼ 0·496), suggesting that the athletes had accurately recorded all the food and water consumed.
The percentage underreporting of 13 % in the present study was lower than values reported in other studies on athletes (Westerterp et al. 1986; Edwards et al. 1993). For example, Edwards et al. (1993) reported that EI was 32 % below EE estimated by DLW in non-elite female distance runners. In another study, underreporting rose progressively over a 3-week period in professional cyclists competing in the Tour de France, one of the world’s most demanding cycle races. Table 4. Percentage of time spent in activity during the waking hours estimated using accelerometry and the physical activity ratio
Physical activity (%)
Accelerometer data† Physical activity ratio data‡
Subject Light Moderate Heavy Very heavy Relax Light Slow run Moderate run Fast run
1 78 12 8 2 74 13 3 7 3 2 84 10 5 1 88 4 3 3 2 3 88 8 3 1 75 17 2 5 1 4 80 7 13 0 84 4 5 5 2 5 84 12 3 1 89 2 3 5 1 6 79 15 4 2 90 3 2 4 1 7 80 12 6 2 81 10 4 3 2 8 83 12 4 1 75 17 3 4 1 9 80 11 7 2 86 4 4 5 1 Mean 82 11 6 1 82 8 3 5 2 SD 3 2 3 1 6 6 1 1 1
† Light, , 1952 counts/min (, 3·00 metabolic equivalents (MET); moderate, 1952 – 5724 counts/min (3·00 – 5·99 MET); heavy, 5725 – 9498 counts/min (6·00 – 8·99 MET); very heavy, . 9498 counts/min (. 8·99 MET) (Freedson et al. 1998).
‡ Rest, # 1·00 MET (i.e. lying at rest, sleeping); relaxing, 1·01 – 2·10 MET (i.e. sitting down, standing, walking, talking); light, 2·11 – 3·70 MET (i.e. warm-up/cool-down exercises); slow run, 3·71 – 8·00 MET; moderate run 8·01 – 14·00 MET; fast run 14·00 – 18·00 MET (Ainsworth et al. 2000).
In that study, underreporting over the 3-week study period was 13 % over the first 7 d (i.e. similar to the present study), 21 % over the next 8 d and 35 % over the last 7 d (Westerterp et al. 1986). The authors attributed the significant underreporting to athletes not recording what they had eaten (i.e. underrecord-ing) rather than undereating as no difference in body mass (or body composition) was found over each of the three recording periods.
The elite cylists in that study reached an ADMR of 3·4 – 3·9 and 4·3 – 5·3 times BMR based on the food-record technique and the DLW technique, respectively, while in the present study the athletes reached an ADMR/BMR of 2·1 (range 1·7 – 2·4) and 2·3 (range 2·1 – 2·6) for the two respective tech-niques. It is recommended that an ADMR/BMR for a sustain-able lifestyle should fall within the range 1·2 – 2·5 (Black et al. 1996); individuals with values . 2·5 may experience a loss of body mass (Westerterp, 1998) and may thus require dietary supplementation of the diet with energy-dense carbohydrate. The difference between values reported in the present study and those obtained in elite cyclists (Westerterp et al. 1986) is likely to be due to the length of daily exercise in the Tour, typically 4 – 5 h for a flat stage and 5 – 6 h for a mountain stage (Lucia et al. 2003). Nevertheless, an ADMR/BMR of 2·3 (SD0·1) estimated in the present study (Table 2) highlights the substantial amount of training undertaken by most of these athletes in the week prior to major competition.
Although weekly training distances in excess of 117 km (not including the late morning training session) were documented in the present study, the athletes spent the majority (82 %) of their waking hours resting (Table 4). A previous study by Saltin et al. (1995) reported the daily training schedule of Kenyan athletes; in that study, athletes were running less than 100 km/week. However, the majority of these runners (n 16) were talented juniour runners, with the inclusion of only a small number (n 6) of truly elite athletes. The greater training distances in the more recent study may also reflect the increased demands currently placed on athletes compared with almost a decade ago.
The consequences of training and competing while in nega-tive energy balance have been well documented, and current recommendations for endurance events advocate athletes refraining from training and/or competition while consuming a hypocaloric diet (American College of Sports Medicine, 2000). Informal discussion with the present group of elite Kenyan runners revealed that a number of the athletes com-plained of reduced appetite following hard training, a phenom-enon commonly referred to as ‘exercise-induced anorexia’ (King et al. 1994; Blundell et al. 2003). For example, Blundell et al. (2003) proposed that a depressed appetite following strenuous exercise could be due to a redistribution of blood away from the splanchnic circulation in favour of the working muscles. On the other hand, King et al. (1994) argued for a delayed response in the matching of EI to acute changes in EE, resulting in acute periods of negative energy balance. Whether either of these suggestions is implicated in the reported negative energy balance found in the current study is unclear. Both are in agreement with a recent review suggesting that the control of appetite results from a complex interaction between homeostatic mechanisms and environ-mental and cognitive factors (Berthoud, 2004). Therefore, a great number of factors could be responsible for the negative
energy balance and reduced appetite reported by many of the athletes during the 7 d recording period.
The view that reducing body mass may potentially improve endurance running performance has previously been discussed (Myers & Steudel, 1985; Jones et al. 1986; Noakes, 2000). Indeed, the simple notion of reducing mass while keeping power constant, and therefore reducing the O2cost of move-ment, seems valid, and there is not a single study to date that would refute this view. Current recommendations, however, dis-courage reducing body mass in the build-up to an important race; rather, it is typically recommended that athletes follow adequate nutrition and hydration practices and remain in energy balance, or even attempt to increase energy stores in the form of glycogen, combining training and dietary manipulation (for a review, see American College of Sports Medicine, 2000). It is interesting to note the recent, albeit anecdotal, observation that the winner of the women’s 2004 London Marathon was Margaret Okayo from Kenya (a previous marathon world record-holder), who weighed only 39 kg at the time of the race (normal weight 43 kg, height 1·5 m).
An analysis of allometric relationships throughout the animal kingdom may allow an insight into the additional ben-efits of reducing body mass. For example, Noakes (2000) pro-poses that the small size and high degree of running economy displayed by the cheetah provide a physiological advantage over its prey in terms of delaying heat accumulation and there-fore the onset of fatigue. Extrapolating this notion to humans, smallness, lightness and a greater running economy might benefit endurance running performance. Indeed, Marino et al. (2000, 2003) suggest that heavier runners display a greater degree of heat retention than lighter individuals, and this may be a major factor limiting the performance of physically larger and heavier athletes in distance running events; this is particularly evident in hot environments. It was additionally reported that heavier runners self-selected a slower running speed than lighter runners while running in the heat and that this speed was inversely related to body mass (Marino et al. 2000, 2003).
In addition, observations from human gait analysis suggest that the addition of mass will increase absolute O2cost (Myers & Steudel, 1985; Jones et al. 1986). For example, Myers & Steudel (1985) compared adding weight proximally to the centre of mass (i.e. the waist) and distally on the limbs (i.e. foot/ankle) during running and reported that the energy cost was increased by a factor of 1·5 – 5·5. Interestingly, the largest increase in energy cost was observed when weight was added distally and when running velocity was increased, prompting the authors to conclude that long and slender legs would confer an advantage on running economy. Similarly, Jones et al. (1986) measured the energy cost of wearing shoes of varying weight during running and walking and reported an average increment in O2 cost of 1 % per 100 g weight added. Consequently, reducing body mass, and leg mass in particular, ought to enhance running economy and therefore running performance as a consequence of reducing the kinetic energy required to accelerate and decelerate the limbs. When considering that running economy has been consistently shown to be a good indicator of performance, it would stand to reason that a low body mass, particularly minimal leg
mass, might be advantageous for endurance running
Evidence favouring superior running economy in Kenyan endurance runners compared with Caucasian athletes was first presented by Saltin et al. (1995). In that study, Kenyan runners exhibited better running economy compared with their Scandinavian counterparts while running at sub-maximal running speeds even though absolute _VO2maxwas no different. Interestingly, the BMI of the Kenyan runners was significantly lower than that of the Scandinavian runners. In a recent review, Larsen (2003) postulated that the superior running economy of Kenyan runners could partly be explained by their low BMI combined with the fact that the majority of their body mass was distributed proximally, the mass of their extremities being kept to a minimum, especially in the calf and thigh area. More recently, Larsen et al. (2004) reported that untrained boys from the Kenyan Nandi (a Kalen-jin subtribe) are slender, have relatively long legs and have a 20 – 25 % lower BMI than untrained children of a similar age from Nigeria, Libya, the USA (blacks, whites, Hispanics), Mexico (Mexican-Americans) and Greenland (Larsen et al. 2004). Whether these anthropometric characteristics are indeed typical of Kenyans and are responsible, in part at least, for the outstanding running performances of Kenyans remains to be determined.
In the present study, the diet consisted mainly of carbo-hydrate sources (67·3 (SD 7·8) %, 9·8 g/kg body mass per d) compared with protein (15·3 (SD 4·0) %, 2·2 g/kg body mass per d) and fat (17·4 (SD 3·9) %). The composition of the diet was consistent with previous results from this laboratory (77 % carbohydrate, 10 % protein, 13 % fat; Onywera et al. 2004) and complied with current recommendations for macro-nutrient intake for endurance athletes, typically 55 – 58 % (6 – 10 g/kg body mass per d) energy from carbohydrate, 12 – 15 % (1·2 – 1·4 g/kg body mass per d) energy from protein and . 15 % energy from fat (American College of Sports Medicine, 2000).
A particular feature of the Kenyan diet is the large contri-bution of carbohydrate to the diet. A typical nutrient is ugali (a carbohydrate-dense combination of maize and water that is usually eaten in combination with meat stew, vegetables and grains). There are in fact anecdotal reports attributing the success of Kenyan endurance athletes to the frequent inclusion of ugali in their diets (e.g. Tanser, 1997). It is also noteworthy that ugali continues to be part of the training diet of the Kenyan athletes when living and competing abroad (e.g. at the Global Sports Communication Camp, Nij-megen, The Netherlands). There is, however, no scientific jus-tification for any effects of ugali on performance; its macronutrient composition is similar to that of rice (the carbo-hydrate, protein and fat content of ugali being 25·3, 1·3 and 0·5 g/100 g and of cooked rice 31·0, 2·6, and 1·3 g/100 g, respectively; Sehmi, 1993). Nevertheless, a typical Kenyan diet, rich in carbohydrate, allows the optimal storage of liver and muscle glycogen.
This is in contrast to what appears to be the case for athletes from industrialised countries, where carbohydrate intake can fall at the lower end of the range recommended for endurance athletes (e.g. 6·1 g/kg body mass per d; Moses & Monore, 1991), especially when a typically Western diet of 55 – 58 % carbohydrate (American College of Sports Medicine, 2000) is consumed. Endurance athletes consuming a Western diet will almost certainly be limiting their carbohydrate
availability, especially if they are trying to be as light as poss-ible before racing. Interestingly, the American College of Sports Medicine (2000) proposes that athletes training and competing while in negative/borderline energy balance are at increased risk of fatigue, illness, injury and loss of muscle mass. Indeed, it has previously been proposed that the high ‘turnover’ of Kenyan runners in international athletics may be a consequence of repetitive periods of negative/borderline energy balance in the face of increased pressure to compete successfully at an international level (Onywera et al. 2004).
Fluid intake in the present study comprised primarily water (0·9 l/d) and milky tea (0·9 l/d), confirming previous results (water 1·1 l/d, tea 0·9 l/d; Onywera et al. 2004). As in the pre-vious study, the athletes in the present study did not consume water before or during training and sometimes consumed only small amounts of water following training. Therefore, the fluid intake reported here is substantially less than current rec-ommendations (e.g. American College of Sports Medicine, 2000), although it has recently been suggested that such rec-ommendations are excessive and can be detrimental to exer-cise performance (Noakes, 2003). The advantages and disadvantages of drinking ad libitum or drinking enough liquid to satisfy specific guidelines remain to be investigated in this population of elite athletes.
Conclusion
This study confirms previous findings (Onywera et al. 2004) that elite Kenyan endurance runners are frequently in nega-tive/borderline energy balance during periods of intense train-ing and/or prior to major competition. The significance of this is unclear, but it is suggested that a reduced body mass conse-quent of being in negative energy balance may be potentially advantageous to the endurance athlete as this may enhance running economy; this is especially apparent when competing in the heat. The unintentional weight loss prior to competition is most likely a gradual process taking place over a number of weeks leading up to an event rather than a rapid reduction in body mass in the week before the event. This ‘strategy’ would have less, or even no, negative impact on the quality of train-ing, especially when athletes are consuming a diet high in carbohydrate (e.g. 67·3 (SD 7·8) %, 9·8 g/kg body mass per d) and sufficient protein (e.g. 15·3 (SD 4·0) %, 2·2 g/kg body mass per d), as is typically the case in Kenya.
Acknowledgements
The authors acknowledge the invaluable assistance of Athletics Kenya. The cooperation of all athletes, cooking staff and the management at Global Sports Communication Camp, Kaptagat, Kenya is greatly appreciated. This study was partly funded by the Carnegie Trust of Scotland.
References
Ainsworth BE, Haskell WL, Whitt MC, et al. (2000) Compendium of physical activities: an update of activity codes and MET intensities. Med Sci Sports Exerc 32, S498 – S504.
American College of Sports Medicine (2000) Joint Position State-ment: nutrition and athletic performance. American College of
Sports Medicine, American Dietetic Association, and Dietitians of Canada. Med Sci Sports Exerc 32, 2130 – 2145.
Berthoud H (2004) Mind versus metabolism in the control of food intake and energy balance. Physiol Behav 81, 781 – 793.
Black AE, Coward WA, Cole TJ & Prentice AM (1996) Human energy expenditure in affluent societies: an analysis of 574 doubly-labeled water measurements. Eur J Clin Nutr 50, 72 – 92. Blundell JE, Stubbs RJ, Hughes DA, Whybrow S & King NA (2003)
Cross talk between physical activity and appetite control: does physical activity stimulate appetite?" Proc Nutr Soc 62, 651 – 661. Christensen DL, Van Hall G & Hambraeus L (2002) Food and macro-nutrient intake of male adolescent Kalenjin runners in Kenya. Br J Nutr 88, 711 – 717.
Edwards JE, Lindeman AK, Mikesky AE & Stager JM (1993) Energy balance in highly trained female endurance runners. Med Sci Sports Exerc 25, 1398 – 1404.
Fjeld CR, Brown KH & Schoeller DA (1988) Validation of the deu-terium oxide method for measuring average daily milk intake in infants. Am J Clin Nutr 48, 671 – 679.
Freedson PS, Melanson E & Sirard J (1998) Calibration of the Com-puter Science and Applications. Inc. accelerometer. Med Sci Sports Exerc 30, 777 – 781.
Goris AH & Westerterp KR (1999) Underreporting of habitual food intake is explained by undereating in highly motivated lean women. J Nutr 129, 878 – 882.
Grandjean AC (1997) Diets of elite athletes: has the discipline of sports nutrition made an impact? J Nutr 127, 874S – 877S. Jones BH, Knapik JJ, Daniels WL & Toner MM (1986) The energy
cost of women walking and running in shoes and boots. Ergo-nomics 29, 439 – 443.
King NA, Burley VJ & Blundell JE (1994) Exercise-induced suppres-sion of appetite: effects on food intake and implications for energy balance. Eur J Clin Nutr 48, 715 – 724.
Larsen HB (2003) Kenyan dominance in distance running. Comp Biochem Physiol A Mol Integr Physiol 136, 161 – 170.
Larsen HB, Christensen DL, Nolan T & Sondergaard H (2004) Body dimensions, exercise capacity and physical activity level of adoles-cent Nandi boys in western Kenya. Ann Hum Biol 31, 159 – 173. Lissner L, Heitmann BL & Lindroos AK (1998) Measuring intake in
free-living human subjects: a question of bias. Proc Nutr Soc 57, 333 – 339.
Lucia A, Earnest C & Arribas C (2003) The Tour de France: a phys-iological review. Scand J Med Sci Sports 13, 275 – 283.
Marino FE, Lambert ML & Noakes TD (2003) Superior running per-formance of African runners in warm humid but not in cool environments. J Appl Physiol 96, 124 – 130.
Marino FE, Mbambo Z, Kortekaas E, Wilson G, Lambert MI, Noakes TD & Dennis SC (2000) Advantages of smaller body mass during distance running in warm, humid environments. Pfugers Arch Euro J Physiol 441, 359 – 367.
Moses K & Manore MM (1991) Development and testing of a carbo-hydrate monitoring tool for athletes. J Am Diet Assoc 91, 962 – 965. Mukeshi M & Thairu K (1993) Nutrition and body build: a Kenyan
review. World Rev Nutr Diet 72, 218 – 226.
Myers MJ & Steudel K (1985) Effect of limb mass and its distribution on the energetic cost of running. J Exp Biol 116, 363 – 373. Noakes TD (2000) Physiological models to understand exercise
fati-gue and the adaptations that predict or enhance athletic perform-ance. Scand J Med Sci Sports 10, 123 – 145.
Noakes TD (2003) Overconsumption of fluids by athletes. BMJ 327, 113 – 114.
Onywera VO, Kiplamai FK, Tuitoek PJ, Boit MK & Pitsiladis YP (2004) Food and macronutrient intake of elite Kenyan distance run-ners. Int J Sports Nutr 14, 709 – 719.
Pitsiladis YP, Scott RA, Moran C, Wilson RH & Goodwin WH (2004) The dominance of Kenyans in distance running. Equine Comp Exerc Physiol 1, 285 – 291.
Saltin B, Larsen H, Terrados N, Bangsbo J, Bak T, Kim CK, Sveden-hag J & Rolf CJ (1995) Aerobic exercise capacity at sea level and at altitude in Kenyan boys, junior and senior runners compared with Scandinavian runners. Scand J Med Sci Sports 5, 209 – 221. Schofield WN (1985) Predicting basal metabolic rate, new standards
and review of previous work. Hum Nutr Clin Nutr 39, 15 – 41. Sehmi KJ (1993) National Food Consumption Tables and the
Planning of Satisfactory Diets in Kenya. Nairobi, Kenya: Kenya Government Press.
Tanser T (1997) Train Hard, Win Easy: The Kenyan Way. Mountain View, CA: Track and Field News Press.
Westerterp KR (1998) Alterations in energy balance with exercise. Am J Clin Nutr 68, 970S – 974S.
Westerterp KR, Donkers JH, Fredrix EW & Boekhoudt P (1995) Energy intake, physical activity and body weight: a simulation model. Br J Nutr 73, 337 – 347.
Westerterp KR, Saris WH, van Es M & ten Hoor F (1986) Use of the doubly labeled water technique in humans during heavy sustained exercise. J Appl Physiol 61, 2162 – 2167.