Representativeness of terrestrial ecosystems in Chile’s protected area
system
P A T R I C I O P L I S C O F F1∗ A N D T A R Y N F U E N T E S - C A S T I L L O2
1Spatial Ecology Group, Department of Ecology and Evolution, University of Lausanne, Switzerland and 2Facultad de Ciencias Forestales, Universidad de Chile, Santiago, Chile
Date submitted: 14 April 2010; Date accepted: 11 November 2010; First published online: 9 May 2011
SUMMARY
Because protected areas are a major means of conservation, the extent to which ecosystems are represented under different protection regimes needs to be ascertained. A gap analysis approach was used to assess the representativeness of Chile’s terrestrial ecosystems in differing kinds of protected areas. Terrestrial ecosystems were described in terms of potential vegetation, employing three protection scenarios. Scenario 1 was based exclusively on the Chilean National System of Protected Wild Areas (SNASPE). Scenario 2 included all types of public protected areas, namely SNASPE, nature sanctuaries and Ministry of National Heritage lands. Scenario 3 included all items in Scenario 2, but also included private protected areas and biodiversity priority sites. There is insufficient protection of terrestrial ecosystems under the Scenario 2. In addition to the low level of ecosystem protection provided by state protected areas (only 42 of the 127 terrestrial ecosystems had >10% of their area protected), 23 terrestrial ecosystems were identified as having no protection at the national level. Gaps in protection were concentrated in the North (both coastal and inland desertic scrub), Central (thorny scrub, thorny forests, sclerophyllous forests and deciduous coastal forests) and Austral (steppe ecosystems) regions of Chile. These gaps include ecosystems that are of global conservation importance.
Keywords: Chile, gap analysis, protected areas,
representative-ness, vegetation types, vegetation formations
INTRODUCTION
In large part, the success of conservation biology depends on an effective transfer of scientific knowledge into conservation practice; this in turn requires the application of science-based criteria to connect scientific knowledge to concrete actions in real-world planning (Robinson 2006). ‘Representativeness’ (Austin & Margules 1984; Mackey et al. 1989) is one of the most fundamental criteria for assessing how adequately a protected area (PA) or system of PAs captures the range of ∗Correspondence: Patricio Pliscoff e-mail: [email protected]
biological variation in terms of species and ecosystems in a given region (Groves 2003).
Representativeness assessment is a relevant tool for setting conservation priorities for PAs management (Davey 1998; Margules & Pressey 2000), accurately evaluating the representation of wildlife and natural communities within PA networks. Those species and communities not represented in PAs are considered to be ‘conservation gap efforts’, as defined through the process of ‘gap analysis’ (Scott et al. 1993; Jennings 2000; Dudley & Parrish 2006). At an international scale, the representativeness approach has arisen from the need to assess the effectiveness of ecosystem protection, establish conservation priorities and guide investment (Brooks et al. 2006). Using ecoregions as classification units at the global scale (Dinerstein et al. 1995; Olson & Dinerstein 2002), zones of high biodiversity and endemism have been identified globally (Myers et al. 2000; Mittermeier et al. 2004; Kier
et al. 2005; Lamoreaux et al. 2006), and their protected
status evaluated (Hoekstra et al. 2005). Several studies have applied representativeness assessment for setting conservation priorities at global (Chape et al. 2003, 2005; Rodrigues et al. 2004a, Jenkins & Joppa 2009) and country or regional scales (Powell et al. 2000; Sierra et al. 2002; Arango et al. 2003; Armenteras et al. 2003; Oldfield et al. 2004; Dietz & Czech 2005; López & Zambrana-Torrelio 2006; Soutullo & Gudynas 2006; Maiorano et al. 2007; Schulman et al. 2007; Brugiere & Kormos 2009; Wiersma & Nudds 2009). Representativeness has also been used as a fundamental criterion for prioritizing areas for systematic conservation planning (Davey 1998; Margules & Pressey 2000; Groves 2003; Molnar et al. 2004; Pressey 2004).
The definitions of a set of representative PAs and identification of gaps in the current PA system are both important goals in conservation planning (Moilanen 2008). Representativeness assessment is becoming increasingly relevant to the design of new PA networks, which deal not only with the representation of biodiversity features at ecosystem and species levels, but also attempt to ensure the conservation of evolutionary and ecological processes (Klein et al. 2009) and adapt PA networks to climate change (Vos et al. 2008; Willis
et al. 2009). When beginning a systematic conservation
planning process, if it has been established which biodiversity features are represented, then gap analysis may be appropriate for measuring conservation success (Margules & Pressey 2000). To date, overall vegetation diversity has been used as
the main biodiversity measure in terrestrial representativeness assessment (Groves 2003; Josse et al. 2003). Vegetation is a reasonable surrogate for the ecosystem at a given scale because it includes a high proportion of biomass in the ecosystem and reflects the influence of climate and soil conditions (Leuschner 2005).
The National System of Protected Wild Areas (SNASPE for its acronym in Spanish) was the first overarching effort in Chile to establish a conservation plan that defined legal boundaries and management objectives for PAs. Several studies have assessed the representativeness of SNASPE in Chile (Weber 1983; Mella & Simonetti 1994; Prado & Alvarez 1994; Benoit 1996; Arroyo & Cavieres 1997; Armesto et al. 1998; Luebert & Becerra 1998; Mardones 1998; Pliscoff 2003; Luebert & Pliscoff 2006; Tognelli et al. 2008). These assessments have been applied at different scales and used inconsistent ecosystem classifications to assess representativeness. Nonetheless, SNASPE has been criticized for failing to adequately represent the country’s ecosystems (Luebert & Becerra 1998; Pauchard & Villarroel 2002) especially in Mediterranean (Myers et al. 2000; Mittermeier
et al. 2004) and grassland ecosystems (Ceballos et al. 2010).
Public debate in Chile has led the government to adopt a new policy calling for an integrated public and private PA system (CONAMA [Comisión Nacional del Medio Ambiente] 2005; CONAMA-PNUD [Comisión Nacional del Medio Ambiente-Programa de las Naciones Unidas para el Desarrollo] 2006). One of the major objectives of this new system should be to achieve the minimum 10% representation targets established in the Convention on Biological Diversity (CBD 2004).
This study is the first assessment of the representativeness of this integrated PA system at the national scale. Older analyses only assessed one PA category, commonly SNASPE, and used broader spatial scale ecosystem classification. Spe-cifically, we seek to evaluate the representation of remaining natural vegetation and the effectiveness of public and private PAs under three protection scenarios. These scenarios attempt to capture the current status and medium-term projections for PAs in order to contribute to the development of conservation targets for terrestrial vegetation in Chile.
METHODS Protection systems
Five PA categories were selected for representativeness assessment: (1) SNASPE (consisting of 30 national parks, 49 national reserves and five natural monuments), (2) private PAs (292 areas), (3) lands protected by the Chilean Ministry of National Heritage (31 areas), (4) nature sanctuaries (31 areas) and (5) priority sites for biodiversity conservation identified by the National Environmental Commission (CONAMA) (68 areas).
The SNASPE makes up the bulk of traditional public PAs in the country and is administrated by the Chilean
National Forestry Corporation (CONAF) (Government of Chile 1984). The Ministry of National Heritage also holds public lands managed for conservation established by decree (No. 1939, Articles 1, 19 and 56; Government of Chile 1977). Nature sanctuaries include both public and private lands and are a category established by Chile’s National Environmental Law (Government of Chile 1994) and law No. 17 288 on National Monuments (No. 17 288, Article 10; Government of Chile 1970). Private PAs were also defined by Article 35 of the National Environmental Law. They are portions of private land whose owners have voluntarily established conservation objectives. Finally, priority sites for biodiversity conservation were identified by the National Environmental Commission as part of the country’s National Biodiversity Strategy (CONAMA 2003). These last areas have no legal protection status but were established as priorities for protection for government purposes.
Additional categories of protection such as scientific interest areas, patrimonial areas, Biosphere Reserves, Ramsar sites, touristic interest zones (ZOIT) and other types of areas were excluded from the analysis for different reasons, such as incomplete datasets and lack of clear biodiversity conservation objectives.
Protection scenarios
Each scenario represents alternative conservation approaches with different degrees of effectiveness, ranging from an exclusively public scenario to a public-private complementary approach. Scenario 1 centred exclusively on SNASPE areas. Scenario 2 (the current protection system) included all types of public PAs, namely SNASPE areas, Nature Sanctuaries and Ministry of National Heritage lands. Scenario 3 included all items in Scenario 2, but also included private PAs and biodiversity priority sites, and was thus a public-private scenario.
Representativeness analysis
We used Luebert and Pliscoff’s (2006) definitions of vegetation type as our terrestrial ecosystem descriptors, and this is the most detailed vegetation classification system covering mainland Chile (1: 100 000 scale). This system describes 127 vegetation types, defined by the authors using the ‘vegetation belts’ concept (van der Maarel 2005), within 17 vegetation formations. Its combination of detail and coverage facilitates a national-level representativeness assessment.
For the purposes of this study we identified remnant areas of each vegetation type using a detailed classification of Chilean land uses (CONAF et al. 1999). Anthropogenic land uses (agriculture, forestry, urban and mining areas) were then subtracted from the cartography of vegetation types (see Luebert & Pliscoff 2006).
For each vegetation type, representativeness was evaluated by the following index:
Table 1 Vegetation formations in Chile, including current areas (excluding water bodies and vegetation-uncovered areas), converted areas
and number of units in each category of protected area.
Vegetation formation Country Converted Vegetation SNASPE Private Priority Lands Nature
area (%) areas (%) types(n) (n) areas(n) sites(n) protected (n) sanctuaries(n)
Desert 7.7 0 2 1 0 3 2 1
Desertic scrub 9.5 3.8 19 8 1 12 3 2
Low desert scrub 8.7 0.1 5 5 1 4 0 2
Alpine dwarf scrub 13.8 0.2 20 24 10 20 4 8
Herbaceous alpine vegetation 2.4 0 5 20 5 13 1 3
Sclerophyllous shrubland 1.0 3.9 4 2 8 8 0 4 Thorny shrubland 0.3 19.1 2 1 1 3 0 0 Thorny forest 2.8 56 7 4 11 6 0 0 Sclerophyllous forest 5.2 46.9 8 9 35 24 5 8 Deciduous forest 14.7 39.8 22 47 96 25 6 6 Broad-leaved forest 1.9 39.7 3 7 85 7 0 2 Coniferous forest 2.3 2.2 8 20 16 6 0 2 Evergreen forest 6.9 8.0 10 30 76 10 0 2 Deciduous shrubland 2.3 0 2 16 6 4 5 0 Evergreen shrubland 0.3 0 1 3 0 3 0 0
Steppe and grassland 3.4 0.1 5 8 2 2 0 0
Moorland 9.1 0 4 7 0 2 1 0
%PA= remnant vegetation within PA / ×total remnant vegetation area × 100 This index allowed for the quantification of current terrestrial ecosystem representativeness under the three different scenarios.
We overlapped data for the PAs and the vegetation types using GIS (Geographic Information System) software ArcGis 9.3 (ESRI, Inc.). Representativeness was assessed by taking a gap analysis approach (Scott et al. 1993; Rodrigues 2004b). Results were analysed in order to assess the geographic distribution of vegetation types meeting a 10% protection goal (CONAMA 2003; CBD 2004; Jenkins & Joppa 2009). We used the following protection levels: 0%= lacking protection, 0.1– 10%= low protection, and 10.1–100% = meets protection goal.
Protection scenario data were analysed at national level by geographic zones, the North (tropical), Central (Mediterranean), Central South (temperate) and Austral (temperate antiboreal macrobioclimate) zones representing the macrobioclimate divisions of Chile (Luebert & Pliscoff, 2006). The last two zones were separated at 44◦ latitude S, where the Andes approach the Pacific coast, creating a distinct environment on the eastern slopes, the Patagonian steppe.
RESULTS Geographic zones
The vegetation formations are not all present in all PA categories (Table 1), and we present our findings on representativeness by geographic zone.
North zone
The North zone has six vegetation formations and 39 vegetation types (Fig. 1). Only vegetation types located in the Andean part (east) of the North zone and other inland locations had high vegetation type representativeness in Scenario 1, and these types consisted mainly of Alpine dwarf scrub and thorny forest formations (Table 2). Vegetation types without protection were located in the pre-Andean (low desert scrub formations) and coastal areas (desertic scrub formations). In general, Scenario 2 had low representativeness (< 10%; Table 2), the areas being located mainly in coastal plains, coastal mountains, the central depression and some Andean areas. Vegetation types without protection were located in desertic scrub, absolute desert, low desert scrub and thorny forest formations located in inland and pre-Andean areas, and in valleys. Scenario 3 provided low protection levels for both coastal and interior areas of the North zone, as well as for the desertic scrub formation; almost all the Andean zone had high levels of protection (Table 2).
Central zone
The Central zone has six vegetation formations and 35 vegetation types (Fig. 1). Scenario 1 had low protection levels and protection gaps within the entire zone, and only one vegetation type had more than 10% of its area protected (Table 2). Unprotected vegetation types like thorny forest, thorny shrub, deciduous forest, low scrub and sclerophyllous forest occurred in coastal and southern inland areas of this zone. Scenario 2 was similar to the Scenario 1, but the vegetation belt of coastal areas had a low protection level compared to the gap in Scenario 1. Protection gaps were evident in the southern inland area. In Scenario 3, protection increased throughout the entire area and there were
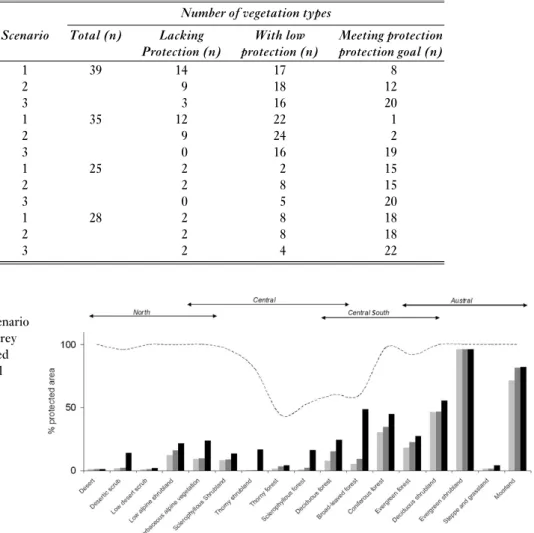
Table 2 Degree of protection for vegetation types by geographic zone in Chile. Protection levels: 0%=
lacking protection, 0.1–10%= low protection and 10.1–100% = meets protection goal.
Geographic zone Number of vegetation types
Scenario Total (n) Lacking With low Meeting protection
Protection (n) protection (n) protection goal (n)
North zone 1 39 14 17 8 2 9 18 12 3 3 16 20 Central zone 1 35 12 22 1 2 9 24 2 3 0 16 19 Central-South zone 1 25 2 2 15 2 2 8 15 3 0 5 20 Austral zone 1 28 2 8 18 2 2 8 18 3 2 4 22
Figure 1 Vegetation formation
representativeness in Scenarios 1–3; Scenario 1= light grey bars, Scenario 2 = dark grey bars and Scenario 3= black bars. Dashed line indicates the percentage of potential natural vegetation. Arrows indicate latitudinal distribution of each zone.
no remaining gaps in vegetation protection. Some Andean areas exceeded the 10% target for all their vegetation types, including sclerophyllous and deciduous forest (Table 2).
Central South zone
The Central South zone had five vegetation formations and 25 vegetation types (Fig. 1). Under Scenario 1, vegetation formations lacking protection, such as deciduous forest, sclerophyllous forest, coniferous forest and thorny forest, were located in northern coastal and inland areas. In contrast, protection levels>10% occurred in both coastal and Andean mountains, the level of protection increasing substantially from north to south. Low levels of protection were evident throughout inland areas, and Scenario 1 did not protect vegetation formations like coniferous forest. In Scenario 2, protection levels of vegetation formations were low (for example in vast areas of the central depression, coastal mountains and coastal plains). In several cases, deciduous forest, sclerophyllous forest, coniferous forest and thorny forest were not protected, while in the coastal mountains, coniferous forest was the only vegetation belt with appropriate protection levels. At the southern limit of this zone, the central
depression was a low protection area; higher protection levels were found in the Andes. In Scenario 3, there was an increase in protection compared to the other scenarios, and the increase occurred in both coastal and interior areas. Scenario 3 did not have protection gaps (Table 2).
Austral zone
The Austral zone had five vegetation formations and 28 vegetation types (Fig. 1). In Scenario 1 we observed two distinctive situations: the fjords and coastal channels had a higher level of protection (although this protection varied within the zone) and there was a protection gap in the eastern steppe formations. Under Scenario 2, the protection pattern of Scenario 1 was maintained (Table 2). In Scenario 3, the general pattern of Scenarios 1 and 2 was maintained, but there was an increase in protection levels for the transitional forest-steppe and forest-steppe.
National level
A total of 127 vegetation types were identified for the whole country (Luebert & Pliscoff 2006), and we compiled
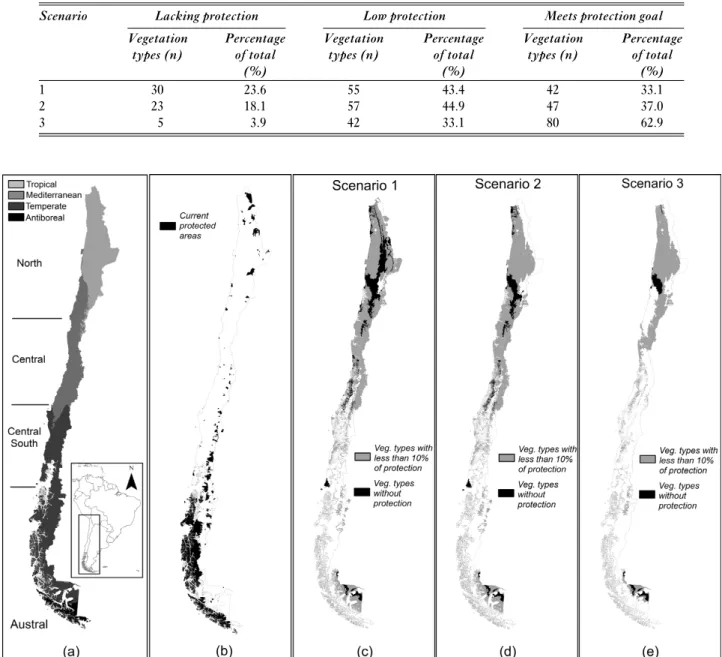
Table 3 Protection for vegetation types at national level: 0%= lacking protection, 0.1–10% = low protection, and
10.1–100%= meets protection goal.
Scenario Lacking protection Low protection Meets protection goal
Vegetation Percentage Vegetation Percentage Vegetation Percentage
types (n) of total (%) types (n) of total (%) types (n) of total (%) 1 30 23.6 55 43.4 42 33.1 2 23 18.1 57 44.9 47 37.0 3 5 3.9 42 33.1 80 62.9
Figure 2 Protection gaps and 10% of representativeness in Chilean terrestrial ecosystems. (a) Macrobioclimate zones of continental Chile,
(b) current official PAs. (c) Scenario 1, (d) Scenario 2 and (e) Scenario 3, where vegetation types with no protection are shown in black and vegetation types with some but<10% protection are shown in grey.
a complete list of vegetation types with potential and remnant areas plus protection level in each scenario (Appendix 1, see supplementary material at Journals.cambridge.org/ enc).
Overall, representation levels relative to the 10% goal varied considerably among vegetation types (Table 3). The North zone contained the largest number of unrepresented vegetation types. This situation improved with Scenarios 2 and 3, but there remained a high proportion of types that had less than 10% of their area protected. Under Scenarios 1 and 2, almost all the vegetation types in the Central zone had
<10% of their area protected. Under Scenario 3, the addition
of new areas eliminated unrepresented vegetation types and
thus the number of vegetation types with>10% of their area protected increased. The Central South and Austral zones had the largest number of vegetation types with the highest level of protection (Fig. 2).
Unprotected and underprotected vegetation types indicated an unbalanced distribution of PAs throughout Chile. High representativeness was found only in the Andean areas of the North and Central South zones, and at the coast in the Austral zones. Vegetation types with low protection were located in the scrub formations of coastal and inland areas of the North zone, in sclerophyllous and thorny forest of the Central zone, and in steppe vegetation in the Austral zone (Fig. 2).
DISCUSSION
Our ecosystem representativeness assessment has identified key gaps in the current system of PAs in relation to the 10% protection target, and shows the extent of representation if priority sites and private PAs were formally incorporated into the Chilean PA system.
Consistent with previous studies (Arroyo & Cavieres 1997; Armesto et al. 1998; Luebert & Becerra, 1998; Pauchard & Villarroel, 2002; Arroyo et al. 2004; Tognelli et al. 2008), we found the SNASPE (Scenario 1) failed to represent the range of Chilean terrestrial ecosystems. In particular, Scenario 1 has low levels of protection in the Chilean Central zone, where no ecosystem exceeds the minimum 10% target of protection of the Chilean National Biodiversity Strategy (CONAMA 2003). In contrast, some areas with high levels of protection are observed in the Southern zone, principally in the coastal range, but steppe ecosystems in the east inland area had low protection levels (Fig. 2). Scenario 2, which represents the current PA system, did not substantially improve the situation; 23 vegetation types and nine vegetation formations were unprotected (Appendix 1, see supplementary material at Journals.cambridge.org/enc). Those vegetation units need to be given top priority if the government is to achieve its goal of minimally representing all the country’s ecosystems in PAs. Public-private Scenario 3 highlighted the importance of private PAs for improving the current degree of representativeness (Jackson & Gaston 2008; Gallo et al. 2009). Despite the lack of formal protection and the uncertainty surrounding the conservation objectives of private owners, the inclusion of private PAs has high potential to enhance the representation of unprotected vegetation units, especially in the Central South zone (Fig. 2).
In Chile, the highest land-use conversion for agriculture, forestry and urban uses has occurred between 30◦S and 40◦S (Arroyo et al. 2004). This area includes the Central and Central South zones, and has the lowest number of PAs, which moreover have a geographically unbalanced distribution. As a consequence of land use change, native vegetation has been heavily replaced (Aronson et al. 1998; Pauchard et al. 2006; Echeverria et al. 2008). Most unprotected ecosystems in the SNASPE are located in the Chilean Matorral ecoregion (Appendix 2, see supplementary material at Journals.cambridge.org/enc), where the lowest protection levels occur and greatest loss of natural vegetation has taken place. The Chilean Matorral ecoregion has been identified as a ‘hotspot’ of global biodiversity (Myers et al. 2000; Mittermeier et al. 2004), as one of the Global 200 priority ecoregions for global conservation (Olson & Dinerstein 2002), and posited as one of the most endangered ecoregions within the Mediterranean-type areas of the world (Underwood et al. 2009).
Novel approaches in systematic conservation planning bring new challenges to representativeness assessment (Hodgson et al. 2009). The static analysis of current vegetation types could become redundant in the future,
because the rise of new species assemblages under novel climate combinations. Analysis of connectivity appears crucial to address this issue (Rose & Burton 2009). Furthermore, the emergence of ecosystems under novel climate conditions raises questions for representativeness assessment (Williams
et al. 2007; Keith et al. 2009). New methodologies should
be developed to address such dynamic landscapes (Beaumont
et al. 2009; Marini et al. 2009; Carroll et al. 2010), current
representativeness assessments updated and PA systems designed to address climate change (Hannah 2010). These new directions need to be considered for the PA network in Chile. The country’s narrow shape could also be useful in the design of corridors of natural vegetation. The adoption of conservation compatible practices outside the PA system could enhance the surrounding natural ecosystems located outside PAs.
CONCLUSION
Gap analysis in the current PA system could be useful for the definition of novel conservation policies and in the identification of priorities for the establishment of new PAs. A new national system of protected areas should be based on representativeness criteria and verifiable objectives. The underrepresentation of vegetation types in Chile’s PAs needs correction, starting with the inclusion of vegetation types that currently lack any type of protection.
ACKNOWLEDGEMENTS
This research was conducted within the UNDP-GEF project ‘Building a comprehensive National Protected Area System for Chile: a financial and operational framework’. We thank: Viviana Avalos, John Dwyer, Sebastian Fuentes, Federico Luebert, Andrés Moreira-Muñoz, David Tecklin and two anonymous reviewers for their comments.
References
Arango, N., Armenteras, D., Castro, M., Gottsmann, T., Hernández, O.L., Matallana, C., Morales, M.M., Naranjo, L.G., Renjifo, L.M., Trujillo, A.F. & Villareal, H. (2003) Vacíos de conservación del Sistema de Parques Nacionales Naturales de Colombia desde una perspectiva ecoregional. Bogota, Colombia: WWF Colombia (Fondo Mundial para la Naturaleza).
Armenteras, D., Gast, F. & Villareal, H. (2003) Andean forest fragmentation and the representativeness of protected natural areas in the eastern Andes, Colombia. Biological Conservation 113: 245–256.
Armesto, J., Rozzi, R., Smith-Ramírez, C. & Arroyo, M.T.K. (1998) Conservation targets in South American temperate forests. Science
282: 1271–1272.
Aronson, J., Del Pozo, A., Ovalle, C., Avendano, J., Lavín, A. & Etienne, M. (1998) Land use changes and conflicts in central Chile. In: Landscape Degradation and Biodiversity in Mediterranean-type Ecosystems, ed. P.W. Rundel, G. Montenegro. & F.M. Jaksic, pp. 155–168. Berlin, Germany: Springer-Verlag.
Arroyo, M.T.K. & Cavieres, L. (1997) The Mediterranean type-climate flora of central Chile. What do we know and how can we assure its protection? Noticiero de Biologia 5: 48–56.
Arroyo, M.T.K., Marquet, P.A., Marticorena, C., Simonetti, J.A., Cavieres, L., Squeo, F. & Rozzi, R. (2004) Chilean winter rainfall. Valdivian forest. In: Hotspots Revisited: Earth’s Biologically Richest and Most Endangered Terrestrial Ecoregions, ed. R. Mittermeier, P. Robles-Gil, M. Hoffmann, J. Pilgrim, T. Brooks, C. Goettsch-Mittermeier, J. Lamoreux & G.A.B. Da Fonseca, pp. 99–103. Ciudad de México, México: CEMEX.
Austin, M. & Margules, C. (1984) Concept of representativeness in conservation evaluation with particular relevance to Australia. Technical memorandum 84/11. CSIRO Institute of Biological Resources, Division of Water and Land Resources, Canberra, Australia: 43 pp.
Beaumont, L.J., Gallagher, R.V., Downey, P.O., Thuiller, W., Leishman, M.R. & Hughes, L. (2009) Modelling the impact of Hieracium spp. on protected areas in Australia under future climates. Ecography 32: 757–764.
Benoit, I. (1996) Representación ecológica del Sistema Nacional de Áreas Silvestres Protegidas del Estado. In: Libro rojo de los sitios prioritarios para la conservación de la diversidad biológica en Chile, ed. M. Muñoz, H. Nuñez & J. Yañez, pp. 149–159. Santiago, Chile: Corporación Nacional Forestal.
Brooks, T., Mittermeier, R.A., da Fonseca, G.A.B., Gerlach, J., Hoffmann, M., Lamoreux, J.F., Mittermeier, C.G., Pilgrim, J.D. & Rodrigues, A.S.L. (2006) Global biodiversity conservation priorities. Science 313: 58–61.
Brugiere, D. & Kormos, R. (2009) Review of the protected area network in Guinea, West Africa, and recommendations for new sites for biodiversity conservation. Biodiversity and Conservation
18: 847–868.
Carroll, C., Dunk, J.R. & Moilanen, A.J. (2010) Optimizing resiliency of reserve networks to climate change: multi-species conservation planning in the Pacific Northwest, USA. Global Change Biology
16: 891–904.
CBD (2004) COP 7 decision VII/30. Strategic plan: future evaluation of progress. Goal 1: Promote the conservation of the biological diversity of ecosystems, habitats and biomes; Target 1.1 [www document]. URL http://www.cbd.int/decision/cop/?id=7767 Ceballos, G., Davidson, A., List, R., Pacheco, J., Manzano-Fischer,
P., Santos-Barrera, G. & Cruzado, J. (2010) Rapid decline of a grassland system and its ecological and conservation implications. PLoS ONE 5(1): e8562 [www document]. URL http://www.plosone.org/article/info%3Adoi%2F10.1371%2 Fjournal.pone.0008562
Chape, S., Blyth, S., Fish, L., Fox, P. & Spalding, M. (2003) United Nations List of Protected Areas. Gland, Switzerland: UNEP-World Conservation Monitoring Centre/IUCN-The UNEP-World Conservation Union.
Chape, S., Harrison, J., Spalding, M. & Lysenko, I.(2005) Measuring the extent and effectiveness of protected areas as an indicator for meeting global biodiversity targets. Philosophical Transactions of the Royal Society B 360: 443–445.
CONAF, CONAMA, BIRF, Universidad Austral de Chile, Pontificia Universidad Católica de Chile & Universidad Católica de Temuco (1999) Catastro y Evaluación de los Recursos Vegetacionales Nativos de Chile. Informe Nacional con Variables Ambientales. Santiago, Chile: Corporación Nacional Forestal (CONAF).
CONAMA (2003) Estrategia Nacional de Biodiversidad. Santiago, Chile: Comisión Nacional del Medio Ambiente, Gobierno de Chile.
CONAMA (2005) Política Nacional de Áreas Protegidas. Santiago, Chile: Comisión Nacional del Medio Ambiente, Gobierno de Chile.
CONAMA-PNUD (2006) Creación de un Sistema Nacional Integral de Áreas Protegidas para Chile. GEF Full Project [www document]. URL http: //www.pnud.cl/proyectos/fichas/areas-protegidas.asp
Davey, A. (1998) National System Planning for Protected Areas. Gland, Switzerland: World Conservation Union.
Dietz, R. & Czech, B. (2005) Conservation deficits for the continental United States: an ecosystem gap analysis. Conservation Biology 19: 1478–1487.
Dinerstein, E.D., Olsen, M., Graham, D.J., Webster, A.L., Primm, S.A., Book-binder, M.P. & Ledec, G. (1995) A Conservation Assessment of the Terrestrial Ecoregions of Latin America and the Caribbean. Washington, USA: World Bank, World Wide Fund for Nature.
Dudley, N. & Parish, J. (2006) Closing the Gap. Creating Ecologically Representative Protected Area Systems: A Guide to Conducting the Gap Assessments of Protected Area Systems for the Convention on Biological Diversity. Technical Series No. 24. Montreal, Canada: Secretariat of the Convention on Biological Diversity.
Echeverría, C., Coomes, D., Hall, M. & Newton, A. (2008) Spatially explicit models to analyze forest loss and fragmentation between 1976 and 2020 in southern Chile. Ecological Modelling 212: 439– 449.
Gallo, J., Pasquini, L., Reyers, B. & Cowling, R. (2009) The role of private conservation areas in biodiversity representation and target achievement within the Little Karoo region, South Africa. Biological Conservation 142: 446–454.
Government of Chile (1970) Ley de Monumentos Nacionales. Law No.17288. Diario Oficial, 4 de Febrero 1970. Santiago, Chile: Gobierno de Chile.
Government of Chile (1977) Normas sobre adquisición, administración y disposición de bienes del Estado. Decree-law No.1939. Diario Oficial, 5 de Octubre 1977. Santiago, Chile: Gobierno de Chile. Government of Chile (1984) Creación un Sistema Nacional de Áreas
Silvestres Protegidas del Estado. Law No.18362. Diario Oficial de 27 de Noviembre 1984. Santiago, Chile: Gobierno de Chile. Government of Chile (1994) Ley sobre Bases Generales del Medio
Ambiente. Law No.19300. Diario Oficial, 1 de Enero 1994. Santiago, Chile: Gobierno de Chile.
Groves, C. (2003) Drafting a Conservation Blueprint: a Practitioner’s Guide to Planning for Biodiversity. Washington, USA: Island Press. Hannah, L. (2010) A global conservation system for climate-change
adaptation. Conservation Biology 24: 70–77.
Hodgson, J., Thomas, C.D., Wintle, B.A. & Moilanen, A. (2009) Climate change, connectivity and conservation decision making: back to basics. Journal of Applied Ecology 46: 964–969.
Hoekstra, J.M., Boucher, T.M., Ricketts, T.H. & Roberts, C.,(2005) Confronting a biome crisis: global disparities of habitat loss and protection. Ecology Letters 8: 23–29.
Jackson, S. & Gaston, K. (2008) Incorporating private lands in conservation planning: protected areas in Britain. Ecological Applications 18: 1050–1060.
Jennings, M. (2000). Gap analysis: concepts, methods, and recent results. Landscape Ecology 15: 5–20.
Jenkins, C. & Joppa, L. (2009) Expansion of the global terrestrial protected area system. Biological Conservation 142: 2166– 2174.
Josse, C., Navarro, G., Comer, P., Evans, R., Faber-Langendoen, D., Fellows, M., Kittel, G., Menard, S., Pyne, M., Reid, M., Schulz, K., Snow, K. & Teague, J. (2003) Ecological Systems of Latin America and the Caribbean: A Working Classification of Terrestrial Systems. Arlington, USA: NatureServe.
Keith, S.A., Newton, A.C., Herbert, R.J.H., Morecroft, M.D. & Bealey, C.E. (2009) Non-analogous community formation in response to climate change. Journal for Nature Conservation 17: 228–235.
Kier, G., Mutke, J., Dinerstein, E., Ricketts, T.H., Küper, W., Kreft, H. & Barthlott, W. (2005) Global patterns of plant diversity and floristic knowledge. Journal of Biogeography 32: 1107– 1116.
Klein, C., Wilson, K., Watts, M., Stein, J., Carwardine, J., Mackey, B. & Possingham, H.P. (2009) Spatial conservation prioritization inclusive of wilderness quality: a case study of Australia’s biodiversity. Biological Conservation 142: 1282–1290.
Lamoreux, J.F., Morrison, J.C., Ricketts, T.H., Olson, D.M., Dinerstein, E., McKnight, M.W. & Shugart, H.H. (2006) Global tests of biodiversity concordance and the importance of endemism. Nature 440: 212–213.
Leuschner, C. (2005) Vegetation and ecosystems. In: Vegetation Ecology, ed. E. van der Maarel, pp. 85–105. Oxford, UK: Blackwell Science.
López, R.P. & Zambrana-Torrelio, C.M. (2006) Representation of ecoregions in the protected area of Bolivia: the situation in relation to the new phytogeographical findings. Biodiversity and Conservation 15: 2163–2175.
Luebert, F. & Becerra, P. (1998) Representatividad vegetacional del Sistema Nacional de Áreas Silvestres Protegidas del Estado (SNASPE) en Chile. Ambiente y Desarrollo 14: 62–69.
Luebert, F. & Pliscoff, P. (2006) Sinopsis bioclimática y vegetacional de Chile. Santiago, Chile: Editorial Universitaria.
Mackey, B.G., Nix, H.A., Stein, J.A., Cork, S.E. & Bullen, F.T. (1989) Assessing the representativeness of the wet tropics of Queensland world heritage property. Biological Conservation 50: 279–303.
Maiorano, L., Falcucci, A., Garton, E.O. & Boitani, L. (2007) Contribution of the Natura 2000 network to biodiversity conservation in Italy. Conservation Biology 21: 1433– 1444.
Mardones, G. (1998) Representatividad biogeográfica del sistema nacional de áreas silvestres protegidas del estado (SNASPE). Revista Geográfica de Chile Terra Australis 43: 31–44.
Margules, C. & Pressey, R. (2000) Systematic conservation planning. Nature 405: 243–253.
Marini, M.A., Barbet-Massin, M., Lopes, M.E. & Jiguet, F. (2009) Major current and future gap of Brazilian reserves to protect Neotropical savanna birds. Biological Conservation 142: 3039– 3050.
Mella, J. & Simonetti, J. (1994) Representación de poblaciones viables: conservación de mamíferos en áreas silvestres protegidas de Chile. Ambiente y Desarrollo 10: 72–78.
Mittermeier, R.A., Robles Gil, P., Hoffmann, M., Pilgrim, J., Brooks, T., Mittermeier, C.G., Lamoreux, J. & da Fonseca, G.A. (2004) Hotspots Revisited: Earth’s Biologically Richest and Most Endangered Terrestrial Ecoregions. Ciudad de Mexico, Mexico: CEMEX.
Moilanen, A. (2008) Generalized complementarity and mapping of the concepts of systematic conservation planning. Conservation Biology 22: 1655–1658.
Molnar, J., Marver, M. & Karieva, P. (2004) The sum is greater than the parts. Conservation Biology 18: 1670–1671.
Myers, N., Mittermeier, R.A., Mittermeier, C.G., da Fonseca, G.A.B. & Kent, J. (2000) Biodiversity hotspots for conservation priorities. Nature 403: 853–858.
Oldfield, T.E.E., Smith, R.J., Harrop, S.R. & Leader-Williams, N. (2004) A gap analysis of terrestrial protected areas in England and its implications for conservation policy. Biological Conservation
120: 303–309.
Olson, D. & Dinerstein, E. (2002) The Global 200: priority ecoregions for global conservation. Annual Missouri of Botanical Garden 89: 199–224.
Pauchard, A. & Villarroel, P. (2002) Protected areas in Chile: history, current status and challenges. Natural Areas Journal 22: 318–330. Pauchard, A., Aguayo, M., Peña, E. & Urrutia, R. (2006) Multiple effects of urbanization on the biodiversity of developing countries: the case of a fast-growing metropolitan area (Concepción, Chile). Biological Conservation 127: 272–281.
Pliscoff, P. (2003) Priorización de áreas para fortalecer la conservación de la flora arbórea nativa en la zona mediterránea de Chile. MS Tesis, Facultad de Ciencias, Universidad de Chile, Santiago, Chile. Powell, G.V.N., Barborak, J. & Rodriguez, M. (2000) Assessing
representativeness of protected natural areas in Costa Rica for conserving biodiversity: a preliminary gap analysis. Biological Conservation 93: 35–41.
Prado, C. & Alvarez, M. (1994) Estado de Conservación de la Vegetación y Flora en Chile, In: Perfil ambiental de Chile, ed. Espinoza G., Pisani P., Contreras L. & P. Camus, pp. 335–364. Santiago, Chile: Comisión Nacional del Medio Ambiente. Pressey, R.L. (2004) Conservation planning and biodiversity:
assembling the best data for the job. Conservation Biology 18: 1677– 1681.
Robinson, J.G. (2006) Conservation biology and real-world conservation. Conservation Biology 20: 658–669.
Rodrigues, A.S.L., Andelman, S.J., Bakarr, M.I., Boitani, L., Brooks, T.M., Cowling, R.M., Fishpool, L.D.C., da Fonseca, G.A.B., Gaston, K.J., Hoffmann, M., Long, J.S., Marquet, P.A., Pilgrim, J.D., Pressey, R.L., Schipper, J., Sechrest, W., Stuart, S.N., Underhill, L.G., Waller, R.W., Watts, M.E.J. & Yan, X. (2004a) Effectiveness of the global protected area network in representing species diversity. Nature 428: 640–643.
Rodrigues, A.S.L., Akcakaya, H.R., Andelman, S.J., Bakarr, M.I., Boitani, L., Brooks, T.M., Chanson, J.S., Fishpool, L.D.C., da Fonseca, G.A.B., Gaston, K.J., Hoffmann, M., Marquet, P.A., Pilgrim, J.D., Pressey, R.L., Schipper, J., Sechrest, W., Stuart, S.N., Underhill, L.G., Waller, R.W., Watts, M.E.J. & Yan, X. (2004b) Global gap analysis: priority regions for expanding the global protected-area network. BioScience 54: 1092–1100. Rose, N.A. & Burton, P.J. (2009) Using bioclimatic envelopes to
identify temporal corridors in support of conservation planning in a changing climate. Forest Ecology and Management 258: 64–74. Schulman, L., Ruokolainen, K., Junikka, L., Saaksjarvi, I.E., Salo,
M., Juvonen, S.K., Salo, J. & Higgins, M. (2007) Amazonian biodiversity and protected areas: do they meet? Biodiversity and Conservation 16: 3011–51.
Scott, J.M., Davis, F., Csuti, B., Noss, R., Butterfield, B., Groves, C., Anderson, H., Caicco, S., D’Erchia, F., Edwards, T.C., Ulliman, J. & Wright, R.G. (1993) Gap analysis: a geographic
approach to protection of biological diversity. Wildlife Monograph
123: 1–41-.
Sierra, R., Campos, F. & Chamberlin, J. (2002) Assessing biodiversity conservation priorities: ecosystem risk and representativeness in continental Ecuador. Landscape and Urban Planning 59: 95–110. Soutullo, A. & Gudynas, E. (2006) How effective is the
MERCOSUR’s network of protected areas in representing South America’s ecoregions?. Oryx 40: 112–116.
Tognelli, M.F., Ramirez de Arellano, P.I. & Marquet, P.A. (2008) How well do the existing and proposed reserve networks represent vertebrate species in Chile?. Diversity and Distributions 14: 148– 158.
Underwood, E.C., Klausmeyer, K.R., Cox, R.L., Busby, S.M., Morrison, S.A. & Shaw, M.R. (2009) Expanding the global network of protected areas to save the imperiled Mediterranean biome. Conservation Biology 23: 43–52.
van der Maarel, E. (2005) Vegetation ecology: an overview. In: Vegetation Ecology. ed. E. van der Maarel, pp. 1–51. Oxford, UK: Blackwell Science.
Vos, C., Berry, P., Opdam, P., Baveco, H., Nijhof, B., O’Hanley, J., Bell, C. & Kuipers, H. (2008) Adapting landscapes to climate change: examples of climate-proof ecosystem networks and priority adaptation zones. Journal of Applied Ecology 45: 1722– 1731.
Williams, J.W., Jackson, S.T. & Kutzbacht, J.E. (2007) Projected distributions of novel and disappearing climates by 2100 AD. Proceedings of National Academy of Sciences USA 104: 5738–5742 Willis, S., Dave, G., Collingham, Y.C., Hilton, G., Rahbek, C. & Huntley, B. (2009) Assessing the impacts of future climate change on protected area networks: a method to simulate individual species’ responses. Environmental Management 43: 836–845. Wiersma, Y.F. & Nudds, T.D. (2009) Efficiency and effectiveness
in representative reserve design in Canada: the contribution of existing protected areas. Biological Conservation 142: 1639–1646. Weber, C. (1983) Representación de las provincias biogeográficas por
las Reservas de la Biósfera en Chile. Acción presente y futura de la Corporación Nacional Forestal. Corporación Nacional Forestal. Boletín Técnico (Valparaíso) 10: 1–23.