HAL Id: hal-01216840
https://hal.archives-ouvertes.fr/hal-01216840
Submitted on 17 Oct 2015
HAL is a multi-disciplinary open access
archive for the deposit and dissemination of
sci-entific research documents, whether they are
pub-lished or not. The documents may come from
teaching and research institutions in France or
abroad, or from public or private research centers.
L’archive ouverte pluridisciplinaire HAL, est
destinée au dépôt et à la diffusion de documents
scientifiques de niveau recherche, publiés ou non,
émanant des établissements d’enseignement et de
recherche français ou étrangers, des laboratoires
publics ou privés.
Diabetes Affects the Temporal Dynamics of the
Repolarization Properties of Cardiomyocytes
Olivier Meste, M Meo, S Signore, M Rota
To cite this version:
Olivier Meste, M Meo, S Signore, M Rota. Diabetes Affects the Temporal Dynamics of the
Repolariza-tion Properties of Cardiomyocytes. Computing in Cardiology, Sep 2015, Nice, France. �hal-01216840�
Diabetes Affects the Temporal Dynamics of the Repolarization Properties of
Cardiomyocytes
O. Meste
1, M. Meo
2, S. Signore
2, M. Rota
21
Laboratory I3S-CNRS-UNS, Sophia-Antipolis, France
2
Departments of Anesthesia and Medicine, and Division of Cardiovascular Medicine, Brigham and
Womens Hospital, Harvard Medical School, Boston, USA
Abstract
The progressive changes in the repolarization phase of the action potential (AP) for isolated cardiomycytes from control and diabetic mice were tested on a set of 100 con-secutive excitations at 2 Hz pacing rate. Each repolar-ization was normalized and fitted with a strictly decreas-ing function by usdecreas-ing an original approach. The tempo-ral properties of the repolarization function were automat-ically evaluated for the set of consecutive APs and the ob-tained indices were tested with linear regressions to define the dynamic characteristics of the repolarization over time. Specifically, whether the train of stimulations resulted in a stable pattern of APs or led to prolongation/shortening of the early and late repolarization phases was tested. In both control and diabetic groups prolongation and short-ening of the AP were observed. Importantly, the progres-sive stimulation led to a faster late repolarization phase of the AP in the diabetic cells, as documented by a Wilcoxon signed rank test (p<0.001). In contrast, AP indices for control myocytes were overall preserved over time. The dynamic changes of the AP profile in the diabetic group were restricted to the late repolarization phase, whereas the early phase behaved similarly for the two groups of cells. Thus, temporal dynamics of repolarization proper-ties of cardiomyocytes are altered with diabetes.
1.
Introduction
The duration of the action potential (AP) in cardiomy-ocytes is an important variable controlling the electrical properties of the normal and pathological myocardium. Prolongation of the AP in myocytes may represent the ba-sis for the increased risk of arrhythmia with diabets[1], but the determinants of these abnormalities remain to be elu-cidated. We raised the possibility that the diabetic condi-tion is associated with alteracondi-tions in the temporal dynamics of the AP profile in myocytes, a factor that may originate electrical instability. Thus, APs in isolated left
ventric-ular myocytes obtained from control and streptozotocin-induced diabetic mice were measured by patch-clamp.
It is expected that APs of diabetic mice exhibit a differ-ent repolarization duration along the successive stimula-tion, compared to the control ones. The assessment of this difference is performed by estimating the time scale of the repolarization phase for each beat. The trend of the scale changes for one cell is computed by using a linear regres-sion whose slope informs us whether the prolongation or shortening of the repolarization occurs at each stimulation over time.
It has been shown in [4] that the scale of any signal can be estimated by transforming the observations into the nor-malized integrals domain. The main property of this trans-formation is to provide a strictly monotonic function while preserving any affine transformation of the time. It should be worth noted that the repolarization phase of the mouse AP is strictly decreasing. Any deviation from this behavior is assumed to be due only to acquisition noise. Then, there is no need to use the normalized integrals provided that the repolarization is strictly decreasing. In [2], a full ECG processing is developed to smooth a part of the T waves under the constraint of monotonicity. This methodology is applied and extended over the whole repolarization phase to meet the monotonicity requirement. Then, the inverse function of each phase is computed yielding an estimated scaling factor.
This global procedure is applied to the two populations of cardiomyocytes and provides us the dynamic of the re-polarization characteristics over time in a single scale pa-rameter, for each cell. A statistically relevant shortening of the late repolarization phase was observed in the dia-betic cells, in contrast to the control ones. This study also highlights the large variability of the repolarization char-acteristics of the two groups.
2.
Material
A group of female C57Bl/6 mice between 3 and 4.4 months of age was studied in accordance with the
Guide for Care and Use of Laboratory Animals; experi-ments were approved by the local animal care committee (IACUC). Hyperglycemia was induced by injecting ani-mals with streptozotocin (Sigma, concentration 5 mg/L) for approximately one week. Blood glucose levels were measured 6-10 days after the last injection of STZ. Mice with blood glucose concentration higher than 400 mg/dl were ascribed to the diabetic group. Furthermore, we ex-amined only animals at less than 1 month after the onset of hyperglycemia, so as to minimize the interference of other factors (e.g., structural or mechanical changes) with heart electrical activity.
A set of 24 cells was isolated from left ventricle in 14 control mice, whereas the STZ group consisted of 41 cells excised from 10 animals. Isolated cardiomyocytes were placed in a bath of Tyrode solution on the stage of an IX53 (Olympus) microscope for whole-cell patch-clamp mea-surements. APs were measured in current-clamped my-ocytes through an Axoclamp 900A amplifier (Molecular Devices). Electrical signals were digitized using a 250 kHz 16-bit resolution A/D converter (Digidata 1550, Molecu-lar Devices) and recorded through pCLAMP 9.0 10 soft-ware (Molecular Devices) with low-pass filtering at 2 kHz. Recording pipettes were fabricated using a horizontal (P-1000, Sutter Instrument) glass microelectrode puller. Cur-rent pulses 1.5 times threshold were applied for cell stim-ulation. A sequence of 100 APs has been triggered by the stimulation protocol at a 2 Hz pacing rate.
3.
Method
In order to focus the analysis only on the temporal dis-persion of the AP, each interval from 100% to 5% of the repolarization magnitude is mapped to the range [1-0]. Then, the monotonicity is obtained by using the following smoothing method. We considered the acquisition xi of
the ith repolarization interval for a given sequence of APs relative to a myocyte uniformly sampled over the time, with the variable n being the sample index. The compu-tation of the inverse function imposes that observations are strictly decreasing or increasing. In the case of the rodent AP, the strictly decreasing behavior of the repolarization was considered and modeled using a parametric function f , characterized by the parameter vector θi, which is
dif-ferent for each repolarization. Thus, the ith sampled repo-larization was modeled using the following:
xi(n) = f (n; θi) + ei(n) (1)
where n = 1, . . . , N and ei(n) accounts for the
acquisi-tion and noise modeling. More specifically, f (n; θi) is a
piecewise linear parametric function defined as a weighted
sum of a collection of functions vl(n):
f (n; θi) = L
X
l=1
θi,lvl(n) (2)
We built a collection of L functions vl(n) which defines
L intervals of width K [2]. In this application the interval length was chosen as 3, L is the largest integer not greater than (N + 1)/2 and N was assumed as an odd number. As previously reported in [2], imposing f (n; θi) to be strictly
decreasing is equivalent to verify the condition:
∀l ∈ [1 : L − 1], θi,l> θi,l+1> 0 (3)
Then, the least square estimation of θiwas performed
ac-cording to following crireria:
ˆ θi = arg min θi N X n=1 (xi(n) − f (n; θi))2 (4)
The estimation method is a linear-inequality constraints problem (LSI problem) converted in a least distance pro-gramming (LDP) problem [3]. Once the estimation was computed, xi(n) was replaced by f (n; θi) for subsequent
calculation. The process originated a decreasing function that allowed filtering of acquisition noise, accounted by ei(n). The imposed decreasing property of the function
f (n; θi) led to the computation of a unique value for n
from the inverse function n = f−1(y, θi) for any given
value of y. Repolarization levels relative to the normal-ized amplitude of the AP are now reported on the hori-zontal axis, whereas corresponding values for duration of repolarization are reported on the vertical axis. In order to compare the entire set of APs, regardless of the stimulation index ith, identical repolarization levels were obtained, by interpolating f−1(y, θi) over a fixed set of y values.
The assessment of the prolongation/shortening of the xi(n) is achieved by using a parametric model, i.e. the
affine transformation. In other words, when considering the observations in the continuous time:
xi(t) = rep(
t − di
αi
) (5)
the imposed monotonicity allows the derivation of the cor-responding inverse function:
ti= αirep−1(xi(ti)) + di= αirep−1(y) + di (6)
Here, rep(t) stands for a reference repolarization function and play the role of f (n; θi) in the continuous time
do-main. It appears that the scaling factor αi is now a
mag-nitude factor when using the inverse function. Combining all the possible values of tiwe get a vector formulation of
relation (6):
where t stands for the sampled rep−1(y), which is un-known but common to all observations, and 1I represents the unit vector. It has been shown in [4] that the estimation of the αis, dis and t can be performed by using a Singular
Value Decomposition (SVD) of matrix T = [t1· · · tI]. In
our case, in order to refer to the first sweep of the stimula-tion ensemble we compute the normalizastimula-tion ˜αi= αi/α1.
For a given cell, all the successive ˜αi convey a
con-densed information on the dynamic behavior of the repo-larization along the stimulations. A linear regression com-puted over this series of data provides us a global trend through the slope inspection. Indeed, a negative slope means a shortening of the repolarization profile, and con-versely a positive one corresponds to a prolongation. In-deed, the analysis has not been performed over the entire repolarization phase but distinguishing the early and late parts. The analysis has been performed on the early and the late repolarization phase, each referring to the range [0-60]% and [60-95]%, respectively.
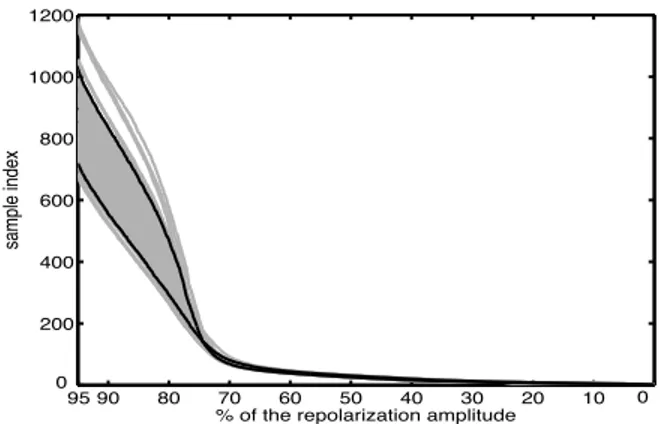
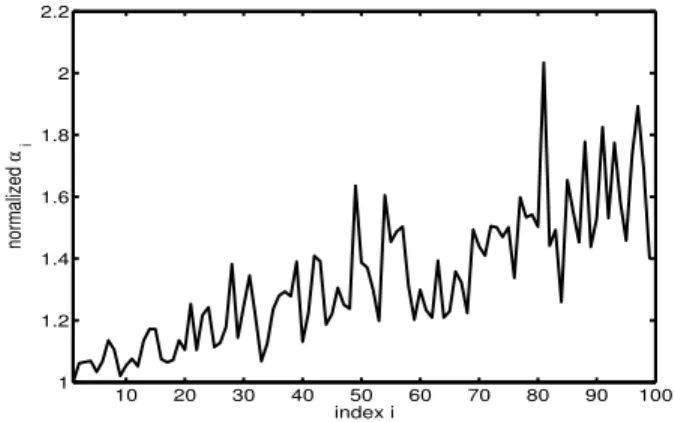
In order to illustrate the global processing applied to a given diabetic cell (#23), a single result of the smoothing algorithm imposing the monotonicity is given in fig. 1. The corresponding inverse functions (7) for all the repo-larizations of the same cell are given in fig. 2 where the shortening effect is clearly visible. Finally, the normalized scaling ˜αiis computed by using the model (5) and the
pro-posed method. The outcome of this computation over the range [60-95]%, given in fig. 3, is in good agreement with the visual inspection of fig. 2
0 200 400 600 800 1000 1200 1400 0 0.1 0.2 0.3 0.4 0.5 0.6 0.7 0.8 0.9 1 Sample index a.u.
Figure 1. The superimposed original (grey line) and monotonic smoothed (black line) repolarization together with a zoomed portion (cell #23)
4.
Results
As a first result, in both control and diabetic groups pro-longation and shortening of the AP were observed. In ad-dition to the results from cell #23, where a shortening ef-fect is clearly visible, the cell #13 from the diabetic group has been also processed and exhibits an opposite behavior,
95 90 80 20 10 0 0 200 400 600 800 1000 1200 70 60 50 40 30
% of the repolarization amplitude
sample index
Figure 2. Ensemble (grey lines) of the 100 inverse functions computed from the repolarization phases (cell #23). The upper and lower black lines correspond respectively to the first and last (100th) repolarizations. Note that the horizontal axis corresponds to the magnitude of the repolariza-tions 10 20 30 40 50 60 70 80 90 100 0.5 0.6 0.7 0.8 0.9 1 1.1 index i normalized α i
Figure 3. A clear example of the normalized ˜αi = αi/α1values
computed over the late phase, for the cell corresponding to fig. 2 (cell #23). The trend exhibits a negative slope corresponding to a progressive shortening of the repolarizations
as visible in fig. 4 and 5. Unlike the previous example of cell #23, the duration of repolarization prolonged with subsequent stimulations. Such behavioral discrepancy is observed regardless the population.
A Wilcoxon signed rank test has been run over the slope values of the linear regression of both groups in order to analyze the randomness of this behavior. The slope has been evaluated on both the early and late phase of the repo-larization, as previously mentioned. For the diabetic group (p<0.001) a negative median value different than zero is found only for the late phase. It means that globally the re-polarization shortens along the stimulations. For the con-trol group such result is not found (p>0.05) regardless of the phase of the repolarization. Additional analyses have been performed only from the 31th stimulation in order to limit the impact of some transient responses and to focus the conclusion on the steady state behavior. Similar out-comes have been obtained, reinforcing the drawn
conclu-sions. 95 90 80 20 10 0 0 500 1000 1500 2000 2500 70 60 50 40 30
% of the repolarization amplitude
sample index
Figure 4. Ensemble (grey lines) of the 100 inverse functions computed from the repolarization phases (cell #13). The lower and upper black lines correspond respectively to the first and the 97th repolarizations. Note that the horizontal axis corresponds to the magnitude of the repolarizations
10 20 30 40 50 60 70 80 90 100 1 1.2 1.4 1.6 1.8 2 2.2 index i normalized α i
Figure 5. A clear example of the normalized ˜αi = αi/α1values
computed over the late phase, for the cell corresponding to fig. 4 (cell #13). The trend exhibits a positive slope corresponding to a progressive prolongation of the repolarizations
5.
Discussion and conclusion
In this work we derived a methodology to automati-cally process the AP repolarization phase of cardiomy-ocytes from control and diabetic mice. The aim was to track the variation of the repolarization duration through its time scale and along the stimulations sequence. First, an amplitude normalization has been applied prior to the smoothing of the observations. This smoothing is specific because it accounts for the assumed monotonicity of the repolarization, permitting the computation of its inverse function. Finally the scale has been evaluated by using an SVD of all the inverse function. Our investigation demon-strated that an intrinsic variability of the scale with various trends can be observed in each cell population. Addition-ally, cells isolated from diabetic mice exhibited a statisti-cally relevant shortening of the late repolarization phase,
in contrast to the control ones. The early repolarization phase did not present any relevant shortening/prolongation behavior in each group of cells.
Previous studies have corroborated a link between changes in potassium currents and the diabetic condition in rodent models [6, 7]. Prolongation of AP early repolar-ization has also been observed [8] in diabetic rats. This evidence may explain the different response of the electri-cal recovery of diabetic cells to paced stimulation, which could be due to the attenuation of Kv currents with respect to physiological conditions. AP profile has been assessed at each repolarization level throughout the stimulation pro-tocol, thus accurately rendering duration dynamics as in [5]. Further investigation about the ionic basis (in partic-ular, Kv currents) modulating AP duration trends should be performed. The method presented open promising per-spectives to automatic AP profile evaluation and feature extraction for several applications, e.g. detection of AP alternans and drug screening.
References
[1] Tomaselli GF, Beuklemann DJ, Calkins HG, Berger RD, Kessler PD, Lawrence JH, Kass D, Feldman AM, Marban E. Sudden car-diac death in heart failure: The role of abnormal repolarisation. Circulation. 1994;90:25342539.
[2] Cabasson A, Meste O, Blain G and Bermon S. Quantifying the PR interval pattern during dynamic exercise and recovery. IEEE Trans Biomed Eng., 2009;56:2675-83.
[3] Lawson CL and Hanson RJ. Solving least squares problems. En-glewood Cliffs, N.J., Prentice-Hall; 1974.
[4] Meste O, Cabasson A, Fresiello L, Trivella MG, Di Molfetta A, et al. ECG analysis during continuous-flow LVAD. Computing in Cardiology, Sep 2014.
[5] Meo M, Meste O, Signore S, Sorrentino A, Cannata A et al. Reduc-tion in Kv Current Enhances the Temporal Dispersion of the AcReduc-tion Potential in Diabetic Myocytes: Insights from a Novel Repolar-ization Algorithm. Circulation Arrhythmia and Electrophysiology, under review.
[6] Lopez-Izquierdo A, Pereira RO, Wende AR et al. The absence of insulin signaling in the heart induces changes in potassium chan-nel expression and ventricular repolarization. American journal of physiology Heart and circulatory physiology. 2014;306:H747-54. [7] Shimoni Y, Firek L, Severson D and Giles W. Short-term diabetes
alters K+ currents in rat ventricular myocytes. Circulation research 1994;74:620-8.
[8] Nobe S, Aomine M, Arita M et al. Chronic diabetes mellitus pro-longs action potential duration of rat ventricular muscles: circum-stantial evidence for impaired Ca2+ channel. Cardiovasc Research 1990;24(5):381-9.
Address for correspondence: Pr. Olivier MESTE
Laboratoire I3S - CNRS - UNS 2000 route des Lucioles
06903 Sophia Antipolis cedex, FRANCE E-mail address: olivier.meste@unice.fr