Frequency stability of a dual wavelength
quantum cascade laser
I
LIAS
ERGACHEV,
1,2,*R
ICHARDM
AULINI,
1T
OBIASG
RESCH,
1S
TÉPHANEB
LASER,
1A
LFREDOB
ISMUTO,
1A
NTOINEM
ÜLLER,
1Y
VESB
IDAUX,
3T
HOMASS
ÜDMEYER,
4 ANDS
TÉPHANES
CHILT41Alpes Lasers SA, Avenue des Pâquiers 1, CH-2072 St-Blaise, Switzerland
2University of Basel, Department of Chemistry, Klingelbergstrasse 80, CH-4056 Basel, Switzerland 3Institute for Quantum Electronics, ETH Zurich, CH-8093 Zurich, Switzerland
4Laboratoire Temps-Fréquence, Université de Neuchâtel, CH-2000 Neuchâtel, Switzerland
Abstract: We characterized the dual wavelength operation of a distributed Bragg reflector
(DBR) quantum cascade laser (QCL) operating at 4.5 μm using two independent optical
frequency discriminators. The QCL emits up to 150 mW fairly evenly distributed between two
adjacent Fabry-Perot modes separated by≈11.6 GHz. We show a strong correlation between
the instantaneous optical frequencies of the two lasing modes, characterized by a Pearson
correlation coefficient of 0.96. As a result, we stabilized one laser mode of the QCL to a N2O
transition using a side-of-fringe locking technique, reducing its linewidth by a factor 6.2, from 406 kHz in free-running operation down to 65 kHz (at 1-ms observation time), and observed a simultaneous reduction of the frequency fluctuations of the second mode by a similar amount, resulting in a linewidth narrowing by a factor 5.4, from 380 kHz to 70 kHz. This proof-of-principle demonstration was performed with a standard DBR QCL that was not deliberately designed for dual-mode operation. These promising results open the door to the fabrication of more flexible dual-mode QCLs with the use of specifically designed gratings in the future.
OCIS codes: (140.5965) Semiconductor lasers, quantum cascade; (140.3425) Laser stabilization. References and links
1. J. Faist, C. Gmachl, F. Capasso, C. Sirtori, D. L. Sivco, J. N. Baillargeon, and A. Y. Cho, “Distributed feedback quantum cascade lasers,” Appl. Phys. Lett. 70, 2670–2672 (1997).
2. P. Fuchs, J. Friedl, S. Höfling, J. Koeth, A. Forchel, L. Worschech, and M. Kamp, “Single mode quantum cascade lasers with shallow-etched distributed Bragg reflector,” Opt. Express 20, 3890–3897 (2012).
3. R. Maulini, M. Beck, J. Faist, and E. Gini, “Broadband tuning of external cavity bound-to-continuum quantum-cascade lasers,” Appl. Phys. Lett. 84, 1659–1661 (2004).
4. P. Jouy, C. Bonzon, J. Wolf, E. Gini, M. Beck, and J. Faist, “Surface emitting multi-wavelength array of single frequency quantum cascade lasers,” Appl. Phys. Lett. 106, 071104 (2015).
5. J. Jágerská, P. Jouy, A. Hugi, B. Tuzson, H. Looser, M. Mangold, M. Beck, L. Emmenegger, and J. Faist, “Dual-wavelength quantum cascade laser for trace gas spectroscopy,” Appl. Phys. Lett. 105, 161109 (2014).
6. M. Süess, P. Hundt, B. Tuzson, S. Riedi, J. Wolf, R. Peretti, M. Beck, H. Looser, L. Emmenegger, and J. Faist, “Dual-Section DFB-QCLs for Multi-Species Trace Gas Analysis,” Photonics 3, 24 (2016).
7. A. Hugi, G. Villares, S. Blaser, H. C. Liu, and J. Faist, “Mid-infrared frequency comb based on a quantum cascade laser,” Nature 492, 229–233 (2012).
8. F. Cappelli, G. Villares, S. Riedi, and J. Faist, “Intrinsic linewidth of quantum cascade laser frequency combs,” Optica 2, 836–840 (2015).
9. S. Ginestar, “Fabrication and characterisation of a dual-mode DFB laser for radio over fibre applications,” Ph.D. thesis, Université des Sciences et Technologie de Lille (2009).
10. S.-C. Chan, S.-K. Hwang, and J.-M. Liu, “Radio-over-fiber transmission from an optically injected semiconductor laser in period-one state,” Phys. Simul. Optoelectron. Devices XV 6468, 646811 (2007).
11. R. Martini and E. Whittaker, “Quantum cascade laser-based free space optical communications,” J. Opt. Fiber Commun. Rep. 2, 279–292 (2005).
12. R. Diaz, S.-C. Chan, and J.-M. Liu, “Lidar detection using a dual-frequency source,” Opt. Lett. 31, 3600–3602 (2006).
13. J. Sun, Y. Dai, X. Chen, Y. Zhang, and S. Xie, “Stable Dual-Wavelength DFB Fiber Laser With Separate Resonant Cavities and Its Application in Tunable Microwave Generation,” IEEE Photonics Technol. Lett. 18, 2587–2589
(2006).
14. G. Carpintero, E. Rouvalis, K. Lawniczuk, M. Fice, C. C. Renaud, X. J. Leijtens, E. A. Bente, M. Chitoui, F. Van Dijk, and A. J. Seeds, “95 GHz millimeter wave signal generation using an arrayed waveguide grating dual wavelength semiconductor laser,” Opt. Lett. 37, 3657–3659 (2012).
15. A. Calvar, M. I. Amanti, M. Renaudat St-Jean, S. Barbieri, A. Bismuto, E. Gini, M. Beck, J. Faist, and C. Sirtori, “High frequency modulation of mid-infrared quantum cascade lasers embedded into microstrip line,” Appl. Phys. Lett. 102, 181114 (2013).
16. G. Chen, C. G. Bethea, R. Martini, P. D. Grant, R. Dudek, and H. C. Liu, “High-speed all-optical modulation of a standard quantum cascade laser by front facet illumination,” Appl. Phys. Lett. 95, 101104 (2009).
17. L. Tombez, J. Di Francesco, S. Schilt, G. Di Domenico, J. Faist, P. Thomann, and D. Hofstetter, “Frequency noise of free-running 4.6µm distributed feedback quantum cascade lasers near room temperature,” Opt. Lett. 36, 3109–3111 (2011).
18. S. Schilt, L. Tombez, C. Tardy, A. Bismuto, S. Blaser, R. Maulini, R. Terazzi, M. Rochat, and T. Sudmeyer, “An experimental study of noise in mid-infrared quantum cascade lasers of different designs,” Appl. Phys. B 119, 189– 201 (2015).
19. O. Cathabard, R. Teissier, J. Devenson, and A. N. Baranov, “InAs-based distributed feedback quantum cascade lasers,” Electron. Lett. 45, 1028–1030 (2009).
20. A. Wittmann, Y. Bonetti, M. Fischer, J. Faist, S. Blaser, and E. Gini, “Distributed-Feedback Quantum-Cascade Lasers at 9µm Operating in Continuous Wave Up to 423 K,” IEEE Photonics Technol. Lett. 21, 814–816 (2009). 21. A. Sadeghi, P. Q. Liu, X. Wang, J. Fan, M. Troccoli, and C. F. Gmachl, “Wavelength selection and spectral narrowing
of distributed Bragg reflector quantum cascade lasers up to peak optical power,” Opt. Express 21, 31012–31018 (2013).
22. S. J. Orfanidis, Electromagnetic Waves and Antennas (Rutgers University, 2016).
23. G. Villares, A. Hugi, S. Blaser, and J. Faist, “Dual-comb spectroscopy based on quantum-cascade-laser frequency combs,” Nat. Commun. 5, 5192 (2014).
24. A. Bismuto, Y. Bidaux, S. Blaser, R. Terazzi, T. Gresch, M. Rochat, A. Muller, C. Bonzon, and J. Faist, “High power and single mode quantum cascade lasers,” Opt. Express 24, 10694–10699 (2016).
25. P. Welch, “The use of fast Fourier transform for the estimation of power spectra: A method based on time averaging over short, modified periodograms,” IEEE Trans. Audio Electroacoustics AU-15, 70–73 (1967).
26. G. Di Domenico, S. Schilt, and P. Thomann, “Simple approach to the relation between laser frequency noise and laser line shape,” Appl. Opt. 49, 4801–4807 (2010).
27. F. Cappelli, G. Campo, I. Galli, G. Giusfredi, S. Bartalini, D. Mazzotti, P. Cancio, S. Borri, B. Hinkov, J. Faist, and P. De Natale, “Frequency stability characterization of a quantum cascade laser frequency comb,” Laser Photonics Rev. 10, 623–630 (2016).
28. G. E. Villanueva, P. Perez-Millan, J. Palaci, J. L. Cruz, M. V. Andres, and J. Marti, “Dual-Wavelength DFB Erbium-Doped Fiber Laser With Tunable Wavelength Spacing,” IEEE Photonics Technol. Lett. 22, 254–256 (2010). 29. R. Blanchard, S. Menzel, C. Pflügl, L. Diehl, C. Wang, Y. Huang, J.-H. Ryou, R. D. Dupuis, L. Dal Negro, and
F. Capasso, “Gratings with an aperiodic basis: Single-mode emission in multi-wavelength lasers,” New J. Phys. 13, 113023 (2011).
1. Introduction
Quantum cascade lasers (QCLs) constitute a versatile source of coherent radiation in the mid-infrared spectral range owing to their unique combination of high output power, spectral properties, and ease of tuning. Most of the applications of QCLs to-date, such as sensitive trace gas monitoring using various spectroscopic techniques, have relied on single-mode emitters. Single-mode emission is typically achieved with the use of a wavelength-selective grating engraved in the QCL chip. The most common structures are distributed feedback (DFB) gratings [1] and distributed Bragg reflectors (DBR) [2]. Spectroscopic gas sensors based on single-mode QCLs can be very sensitive, but are most often capable of detecting only a single species, as a result of their limited tuning range. Multi-species detection can be realized with the use of external-cavity QCLs with a large tuning range [3] or by integrating an array of slightly detuned lasers in a single platform [4], but at the cost of a higher complexity, reduced tuning speed or higher price.
The development of QCLs capable of emitting at two or more wavelengths simultaneously has received a significant attention in the last years. Dual-wavelength QCLs emitting in two distinct spectral ranges have been demonstrated for spectroscopy applications [5, 6]. However, the two wavelengths were emitted in two distinct gain sections in this case, so that the emitted
modes were completely independent. In contrast, broadband multi-mode QCLs with a properly
managed dispersion can generate a frequency comb spectrum by non-linear effects (four wave
mixing) taking place within the QCL active region [7]. As a result of energy conservation in
this parametric process, the different modes are precisely equidistant. Therefore, their frequency
fluctuations are strongly correlated [8], even if the modes are not phase-locked as in a standard frequency comb produced by a mode-locked laser. QCL combs have been a breakthrough towards the realization of broadband high-resolution mid-infrared spectrometers, and have opened new perspectives for multi-species gas detection. QCL combs also simultaneously carry a radio frequency (RF) signal (i.e., the comb mode spacing) in addition to the optical frequencies of the lasing modes.
Simpler laser systems simultaneously emitting at only two close wavelengths are attractive for a number of applications, such as the transmission of radio frequency (RF) signals over optical fibers [9, 10] or in free space [11], light detection and ranging (LIDAR) [12], or RF generation [13, 14]. Their interest lies in the fact that they simultaneously provide an optical (≈100 THz) and an RF signals (≈10 GHz). A different approach to simultaneously transmit optical and RF signals in the mid-infrared is by amplitude modulation of a QCL. This can be achieved by a direct modulation of the laser current [15] or using a modulated external illumination of the QCL facet [16]. However, this comes at the price of an increased complexity.
A dual wavelength laser is more advantageous, as it naturally carries the desired RF signal. DFB or DBR QCLs are typically designed for single-mode operation. However, this is not easy to achieve, and a dual-mode or few-mode optical spectrum is often observed above a certain output power. These modes are separated in the frequency domain by multiples of the free spectral range (FSR) of the laser resonator. For a QCL with a typical chip length between 1 and
10 mm and a refractive index of≈3, the FSR lies between 5 and 50 GHz.
Dual-mode operation of a QCL has not been investigated so far, and many questions remained open about its applicability, such as the achievable mode spacing tunability and stability. In this article, we present the first noise analysis and frequency stabilization of a dual-mode QCL. A single-mode QCL has a typical linewidth in the MHz range [17], resulting from internal electrical fluctuations that induce temperature variations within the laser active region [18]. These temperature variations finally result in fluctuations of the QCL optical frequency. From the origin of these fluctuations, one can expect that they will perturb in a very similar way adjacent Fabry-Perot modes, for which dispersion is negligible compared to the situation of
modes spaced by tens of cm−1located on each side of the spectrum of a typical multi-mode QCL
without a grating. In this work, we show that the frequency fluctuations in dual-mode QCLs are indeed strongly correlated. Consequently, one mode can be used to measure the instantaneous frequency of the other one and to stabilize both at the same time.
2. Laser fabrication
Dual-mode operation is typical for DFB QCLs [19,20] due to the uncertainty in the cavity length resulting from the cleaving process and to the possibility for a second mode to start lasing on the other side of the grating spectrum. In this work, we employed a DBR design, which can also operate non-single-mode [21]. As illustrated in Fig. 1, two Fabry-Perot modes close to the center of the grating spectrum can experience nearly the same reflectivity and lase, therefore, simultaneously.
The lasers designed to emit in the 4.5-μm range were processed in a buried heterostructure
configuration with a ridge width of 9.0μm. A distributed Bragg mirror section with a length
of 0.75 mm and a grating period of 0.7515μm was processed. Then a Fabry-Perot section was
cleaved at a length of 3.75 mm (out of the grating), resulting in a total device length of 4.5 mm. A gold layer was deposited on top of the structure to form a single electrical contact, used to pump the two sections with a uniform current density. Both facets were left uncoated. The lasers
−150 −100 −50 0 50 100 150 Offset frequency, GHz 20 30 40 50 60 70 Reflectivit y, % DBR spectrum
Fabry-Perot mode locations
Fig. 1. Reflectivity spectrum of a DBR (calculated as described in [22]) with the locations of the Fabry-Perot modes (grey lines) separated by the cavity FSR of≈10 GHz.
were mounted epitaxial side up on copper submounts.
3. Characterization of dual-mode QCLs
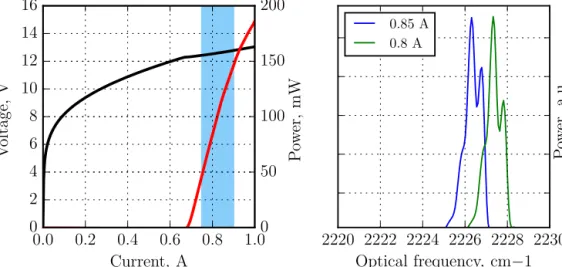
QCLs capable of operating in a dual-mode regime have been selected and characterized. As a first step, standard light-current-voltage (LIV) curves have been recorded and the emission
spectrum has been measured at different operating currents using a Fourier-transform infrared
(FTIR) spectrometer. In the selected QCL, a transition from single-mode to dual-mode emission
occurs at room temperature (20◦C) at a current of 740 mA. The emission remains bi-modal up
to 900 mA (maximum dual-mode output power= 150 mW), then additional modes start to lase.
In comparison, the threshold current is 680 mA and the roll-over current is 1050 mA (Fig. 2). Only the light emitted from the front facet, corresponding to the Fabry-Perot section, has been considered in these measurements. In all subsequently presented data, the laser was operated at
20◦C and within the current range of dual-mode operation.
The stability of the dual-mode operation of the laser (absence of pulsations, self-frequency modulation, etc) has been assessed by observing the emitted optical power using a fast photodiode (Vigo PVMI-4TE-8 with 250 MHz bandwidth) connected to a digital oscilloscope. A first measurement was made on the total output power (i.e., for the combination
of the two modes), showing 1.4×10⁻³ of relative root mean square (RMS) noise in the
frequency span from 200 Hz to 1 MHz. After that, one of the two modes was filtered out by
tuning it to a strong absorption line of N2O at 2227.04 cm−1 (a 10-cm gas cell filled with
2 mbar of N2O was used for this purpose) and the optical power of the only remaining mode
was detected, showing a comparable relative RMS noise of 1.3×10⁻³ in the same frequency
span.
The exact spacing of the two optical modes has been investigated by detecting their RF beat-note that appears as an AC component in the laser voltage [23]. This detection scheme circumvents the need of a very fast detector (at least 12 GHz for the present laser) that would be required to optically detect the beat signal. The RF signal has been extracted from the QCL using a bias tee (Aeroflex 8800SMF-12). A special RF probe in the shape of a press contact
was made to efficiently couple the weak RF signal from the laser standard copper mount into a
0
.0 0.2 0.4 0.6 0.8 1.0
Current, A
0
2
4
6
8
10
12
14
16
V
o
ltage
,
V
0
50
100
150
200
Po
we
r,
m
W
2220 2222 2224 2226 2228 2230
Optical frequency, cm
−1
Po
we
r,
a
.u
.
0.85 A 0.8 AFig. 2. Left: LIV curves of the selected QCL at 20◦C. The blue area indicates the current range of a stable dual-mode operation. Right: typical corresponding dual-mode spectra measured with an FTIR spectrometer at a resolution of 0.06 cm−1.
gain of 38 dB (Pasternack PE15A3259), and was measured with an electrical spectrum analyzer (HP 70000 series).
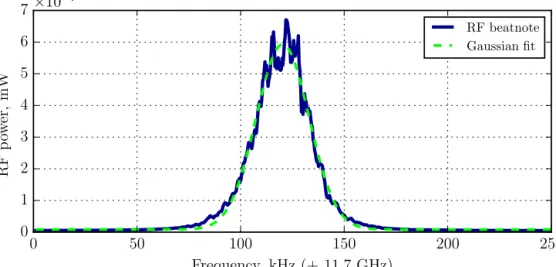
At an observation time of 100 s (100 averages of a 1-s sweep), the linewidth of the RF sig-nal was around 30 kHz (Fig. 3) at all considered currents in the range of dual-mode operation, much narrower than the typical MHz range linewidth of the optical modes of a QCL measured at
10-100μs observation times [17]. The measured beat frequency of 11.7 GHz corresponds to an
effective resonator length of 4.1 mm assuming a refractive index ≈ 3.1, which indicates that the optical mode penetrates slightly into the grating section, in accordance with [24]. The possibility to tune the frequency spacing between the two laser modes was investigated by measuring the beat-note frequency while changing the laser bias current (Fig. 4). From these
measure-ments, a tuning rate of 0.9 MHz/mA was assessed. It is almost three orders of magnitude lower,
than the co-tuning rate of the whole optical spectrum with current, which was estimated to be
≈ 600 MHz/mA from the characterization done before with an FTIR spectrometer.
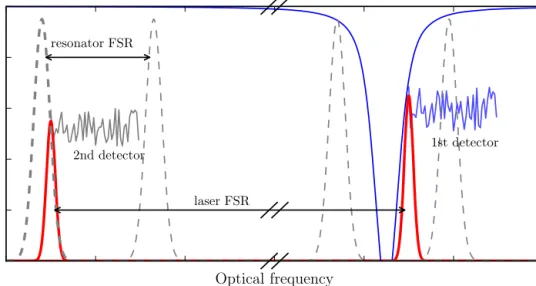
In order to further investigate the noise of the two modes and their correlation, we used two fast photodiodes and two optical frequency discriminators allowing the independent and simultaneous measurement of the frequency noise of each mode (Fig. 5). The optical set-up
is shown in Fig. 6. The output beam of the QCL was first split by a 50/50 beam splitter after
a collimating aspheric lens ( f = 1.873 mm) and the two resultant beams were sent to two
distinct frequency discriminators. The first discriminator was made of the aforementioned N2O
gas cell and its absorption line at 2227.04 cm−1. The laser current was adjusted such that one
mode was tuned to the side of the absorption line, where it got discriminated, i.e., the frequency fluctuations of this mode were converted into intensity fluctuations by the steep slope of the absorption line. The resulting power fluctuations were detected by the photodiode in the cell transmission signal. The second mode was fully transmitted through the gas cell and also contributed to the photodiode signal, but only with its intensity noise, which was negligible compared to the converted frequency noise of the discriminated mode.
In the second arm, a tunable frequency discriminator was required to be able to discriminate the second mode. A scanning Fabry-Perot interferometer of medium finesse (1-GHz FSR, 5-MHz resonance width) was used for this purpose. An additional lens with a focal length
0 50 100 150 200 250 Frequency, kHz (+ 11.7 GHz) 0 1 2 3 4 5 6 7 RF p o w er, mW ×10−7 RF beatnote Gaussian fit
Fig. 3. Electrical beat-note of a free-running dual wavelength QCL measured between its electrodes, averaged over 100 sweeps (100 s total observation time); resolution bandwidth: 1 kHz, measured linewidth: 30 kHz. 1.167 1.168 1.169 1.170 1.171 1.172 Frequency, Hz ×1010 −80 −70 −60 −50 −40 RF p o w er, dBm 746 mA 752 mA 759 mA 767 mA 777 mA 794 mA 740 750 760 770 780 790 800 Current, mA 0 10 20 30 40 50 60 F requency , MHz +1.166×10⁴
Fig. 4. Continuous tuning of the frequency spacing between the two optical modes with the laser current. Left: recorded RF spectra at various currents; right: tuning curve extracted from the peak locations.
Optical frequency T rans m is si on and las er p o w er 2nd detector 1st detector laser FSR resonator FSR
Fig. 5. Scheme of principle of the simultaneous measurement of the frequency fluctuations of the two optical modes of the QCL using two distinct frequency discriminators: the frequency noise of the first laser mode (red peak on the right) is discriminated by a gas absorption line (shown in solid blue), whereas the frequency noise of the second one (red peak on the left) is measured using an optical resonator (shown in dashed grey). The respective linewidths are not to scale for illustrative purpose.
laser was reduced to a non-disturbing level by inserting a reflective attenuator in this branch. A
second slightly different photodiode (Vigo PVI-4TE-5) measured the light transmitted through
the resonator. The Fabry-Perot interferometer was tuned via a piezoelectric transducer (PZT) holding one of the cavity mirrors in order that the second QCL mode was located on the side of a resonance, approximately at its half height. The two modes were clearly identified by their
slightly different amplitude.
Laser
BS
Cavity
MCT 1
gas cell
MCT 2
attenuator
M2
M1
L1
L2
Fig. 6. Experimental workbench. M1, M2 - mirrors, L1, L2 - lenses with 1.87 mm and 100 mm focal lengths, BS - non-polarizing beam splitter, MCT 1, MCT 2 - fast optical detectors.
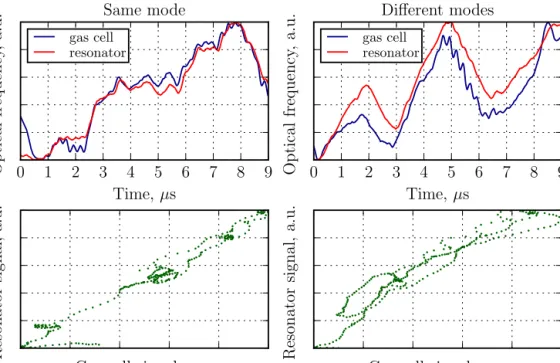
With these two optical frequency discriminators, two independent signals were obtained, each of them measuring the instantaneous frequency of one of the modes. For verification and calibration, the resonator was first tuned such that the same laser mode was discriminated in both optical branches (i.e., by the gas absorption line and the Fabry-Perot resonance, respectively). The electrical signals of both optical detectors were recorded by a fast digital oscilloscope
at 10 ns resolution (Fig. 7). Both signals were filtered by a first order digital low-pass filter
with a -3 dB cut-off frequency of 200 kHz in order to compensate for the different frequency
response of the discriminators. The Pearson correlation coefficient R = 0.98 calculated for the
two normalized 9-μs long time series of 900 points each proves the equivalence of the two
considered discriminators. Then, the resonator was tuned such that the two optical branches
discriminated different laser modes. The barely smaller calculated value of R = 0.96 confirms
the high correlation occurring between the frequency fluctuations of the two optical modes (Fig. 7, right).
0
1
2
3
4
5
6
7
8
9
Time,
µs
O
p
tica
l
frequency
,
a
.u.
Same mode
gas cell resonator0
1
2
3
4
5
6
7
8
9
Time,
µs
O
p
tica
l
frequency
,
a
.u.
Different modes
gas cell resonatorGas cell signal, a.u.
Resonator
signal,
a.u.
Gas cell signal, a.u.
Resonator
signal,
a.u.
Fig. 7. Upper left: instantaneous frequency of the same optical mode discriminated with both the gas cell (blue curve) and the optical resonator (red curve): R= 0.98. Upper right: instantaneous frequencies of the two different modes simultaneously observed with the two optical discriminators: R= 0.96. Bottom: scatter plots of the red curve versus the blue one from the corresponding upper plots visualizing the correlation.
4. Stabilization
We have used a side-of-fringe locking method to stabilize one of the two laser modes to a N2O
absorption line and studied the resulting behavior of the second mode. As a result of the high correlation between the instantaneous optical frequency of the two modes shown in the previous experiment, this stabilization is expected to lead to a simultaneous locking of the second mode. A PI (proportional-integral) controller was added to the aforementioned setup and the absorption
spectroscopy signal, offset by a controlled voltage, was used as an input error signal. The output
signal of the PI controller was applied as feedback to the QCL current.
As a first qualitative evaluation of this stabilization, we scanned a resonance of the Fabry-Perot cavity in the second optical branch through one or the other QCL mode, when the laser was free-running or stabilized to the gas absorption line in the first optical branch. The corresponding results are shown in Fig. 8. Here also, the two modes were clearly identified by
weaker mode (left plot) was directly stabilized to the gas absorption line, the stronger one (right plot) experienced a clear noise reduction, despite it was not directly locked to an optical reference. This confirms the assumption of the noise correlation between the two modes. In the stabilized case, the width of the observed spectra corresponds to the linewidth of the Fabry-Perot
resonance (≈5 MHz), as the laser linewidth is much narrower as a result of the noise reduction.
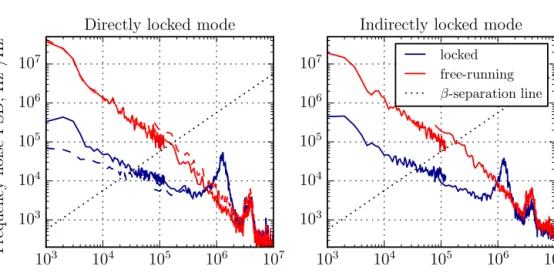
For a more quantitative evaluation of the effect of the stabilization on the two optical modes,
we have determined their frequency noise power spectral density (FN-PSD) in free-running and locked conditions. This was realized by roughly tuning the resonator such that the considered QCL mode was discriminated by the side of a cavity resonance and by recording the resulting fluctuations of the cavity transmission in the time domain. Welch’s periodogram method [25] was then applied to the recorded time traces to calculate the corresponding FN-PSD. For the free-running QCL, the optical modes were not locked to any specific point on the gas absorption line or cavity resonance. Therefore, they experienced a frequency drift (resulting in particular from external temperature variations) that rapidly shifted the analyzed mode out of the linear range of the cavity frequency discriminator. As a result, we have continuously recorded the time trace on the oscilloscope and have post-processed the data to take into account only those time ranges for which the analyzed mode was in the correct frequency range, corresponding to the steepest slope of the frequency discriminator (which was assessed from the cavity transmission signal). A similar reduction of the FN-PSD for the two modes is shown in Fig. 9. The correctness of our data processing was verified for the main laser mode by a comparative measurement of its FN-PSD obtained using the gas cell discriminator (dashed colored curves in Fig. 9), which is not affected by this drift due to its much broader linear range. The excellent agreement between the noise spectra obtained both for the free-running and for the locked mode validate this measurement. The corresponding linewidths of the optical modes (at 1-ms observation time)
estimated using the concept of the β-separation line [26] is reduced from 406 kHz (free-running)
to 65 kHz (locked) for the directly-locked mode, and from 380 kHz (free-running) to 70 kHz (locked) for the indirectly-locked mode. The corresponding linewidth narrowing factors are 6.2 for the directly-locked mode and 5.4 for the indirectly-locked mode.
5. Conclusion
This work presents a study of the frequency noise correlation between the two optical modes of a dual wavelength QCL, a topic that has not been studied in details before to the best of our knowledge. Our results demonstrate the excellent stability of the intermodal spacing, which is important both for applications of dual-mode QCLs and for the general understanding of this operation regime. We have shown in particular that the frequency noise of the two laser modes was strongly correlated, a property that has enabled us to simultaneously reduce the noise of the two modes by locking only one of them to an optical reference. A linewidth narrowing by a factor 5.4 was thus achieved for the indirectly-locked mode, which is similar to the factor 6.2 obtained for the directly-locked mode (at 1-ms observation time). The behaviour of a dual-mode QCL under current locking can be compared to the one of QCL combs, where it has been
demonstrated, that action on the effective refractive index reduces the common noise of laser
modes [27]. However, it should be noted, that, whereas in QCL combs all modes are linked together via the four-wave mixing, there is no such process in dual-mode lasers, therefore the
correlation mechanism of their modes is different and needs a separate study that is out of the
scope of this work.
In this work, we used a standard DBR QCL that was not deliberately designed for dual-mode operation. In the future, dual wavelength QCLs can be made more flexible in terms of tuning by the use of more complicated gratings as reported for near-infrared lasers [28, 29]. Along this line, higher-order multi-mode operation (triple-mode or more) can be made possible, as well as dual-mode QCLs with a larger mode separation. It will be worth to extend the present study to
-7.5 -5.0 -2.5 0.0 2.5 5.0 7.5 Offset frequency, MHz O ptica l p o w er, a .u.
Directly locked mode
-7.5 -5.0 -2.5 0.0 2.5 5.0 7.5 Offset frequency, MHz
Indirectly locked mode
Fig. 8. Profiles of the two modes of a dual wavelength QCL measured with a tunable Fabry-Perot resonator during a piezo scan for the free-running (red) and stabilized (blue) QCL, along with a Gaussian fit (dashed black). The transmission profile of the resonance observed with the locked laser is limited by the≈5-MHz resonance width (i.e., by the finesse) of the Fabry-Perot resonator. The optical linewidth of the QCL modes is narrower. The mode on the left was used in the stabilization. The power scale is arbitrary, but the same for both modes. The different curves have been shifted vertically for the clarity of the plots.
10
310
410
510
610
7Fourier frequency, Hz
10
310
410
510
610
7F
requency
n
oise
PSD
,
Hz
2/Hz
Directly locked mode
10
310
410
510
610
7Fourier frequency, Hz
10
310
410
510
610
7Indirectly locked mode
locked free-running β-separation line
Fig. 9. Frequency noise power spectral density (PSD) of both modes measured with the optical resonator, in the free-running (red) and stabilized (blue) cases. The dashed lines show the corresponding spectra obtained from the gas cell discriminator for cross-check, which are available only for one mode (directly-locked mode). The β-separation line used for linewidth estimation [26] is shown by the dashed line. Slight discontinuities of some curves at≈ 100 kHz result from some limitations of digital sampling and from the fact that these curves were obtained from distinct data sets.
such lasers, to investigate if a similar noise correlation occurs among the modes.
Funding
European Commission Seventh Framework Programme (FP7 GA 607491 COMIQ); Swiss National Science Foundation (SNSF).
![Fig. 1. Reflectivity spectrum of a DBR (calculated as described in [22]) with the locations of the Fabry-Perot modes (grey lines) separated by the cavity FSR of ≈ 10 GHz.](https://thumb-eu.123doks.com/thumbv2/123doknet/14935625.665758/4.918.182.729.142.410/reflectivity-spectrum-calculated-described-locations-fabry-perot-separated.webp)