Susceptibility testing of Haemophilus influenzae—
an international collaborative study in quality assessment
S. F. Yeo", E. Akalln*, S. Arikan', R. Auckenthaler% T. Bergan', K. Dornbusch', A. J. Howard, W. Hryniewiczf, R. N. Jones*, G. Kouparf, N. J. Legakls', J. McLaughnV, C. Ozkuyumcu*, A. Perdvar*, I. Phillips', D. Reeves", R. Spencer*, R. E. Warren* and
J. D. Williams'*
'London Hospital Medical College, London, UK;bHaceteppe University, Ankara, Turkey; 'University Hospital of Geneva, Switzerland; 'University of Oslo, Norway;'' Karolinska Hospital, Stockholm, Sweden; fBangor Public Health Laboratory, Gwynedd, UK; 'National Institute of Hygiene, Warsaw, Poland; ''University of Iowa, Iowa, USA; 'University of Athens Medical School, Athens, Greece; 'University of New Mexico Medical Center, Albuquerque, NM, USA; kRoyal Liverpool University Hospital, Liverpool, UK; 'United Medical & Dental School, London, UK; "Southmead Health Services, Bristol, UK; "Public Health Laboratory, Bristol, UK; "Royal Shrewsbury Hospital, Shrewsbury, UK.
In order to compare the prevalence of antibiotic resistance in different geographical areas, it is necessary to ensure that agreement is achieved between laboratories on the assignment of strains to 'susceptible' and 'resistant' categories. An international quality assessment study, involving 15 laboratories in eight countries, was performed to investigate the standard of performance of the susceptibility testing of Haemophilus influenzae. One hundred and fifty strains of H. influenzae were distributed from the London Hospital Medical College (LHMC) to all laboratories who were asked to test the susceptibility of the strains to ampicillin, chloramphenicol, tetracycline, trimethoprim, cephalosporins and ciprofloxacin. Laboratories were also asked to provide the details of methodology to test the susceptibility. Significant discrepancy between the LHMC and the participating laboratories appeared in the detection of resistance to ampicillin (especially /J-lactamase-negative strains resistant to ampicillin) as well as the assignment of susceptibility and resistance to chloramphenicol, tetracycline and trimethoprim. Often these reflected the use of inappropriate breakpoints which led to erroneous assignment of susceptibility. Other variations including disc content, medium and supplement, inoculum as well as failure to measure zone sizes properly also led to some repeating anomalies.
Introduction
Despite great attention to susceptibility test methods of Haemophilus influenzae, discrepancies between laboratories in the detection of resistance still exist. Some discrepancies were due to variation in methods, others were due to variation in 'Corresponding author: Department of Medical Microbiology, The London Hospital Medical College, Turner Street, London El 2AD, UK.
363
364 S. F. Yeo et al.
susceptibility guidelines (Philpott-Howard, Seymour & Williams, 1983; Snell, Brown & Phua, 1986; Snell, 1994).
A study of//, influenzae susceptibility by Philpott-Howard et al. (1983) involving 25 laboratories in the UK found good agreement between London Hospital Medical College (LHMC) and participating laboratories in the assignment of almost all susceptible strains but high discrepancy levels in the assignment of resistance to ampicillin, tetracycline and trimethoprim. A National External Quality Assessment Study (NEQAS) organised to investigate the standard of performance of susceptibility testing with six H. influenzae strains in 417 laboratories in the UK indicated high rates of error of both the resistant and susceptible strains (Snell et al., 1986).
The present study was organised to assess the ability of laboratories in different countries to identify susceptible and resistant strains of H. influenzae and to identify factors affecting the results. Of the 15 laboratories enrolled, six were from the UK, two from the USA, two from Norway and one each from Greece, Poland, Sweden, Switzerland and Turkey. Strains for study were selected on the basis of possession of known mechanisms of resistance. A large number of strains was used in order to 'hide'] resistance within a group of fully susceptible strains. Apart from ampicillin-resistance in strains not producing /J-lactamase, which are still subject to debate over the level at which assignment to 'resistant', should be made, all strains could be assigned with some confidence to a 'susceptible' or 'resistant' category.
Materials and methods
Bacterial strains
One hundred and fifty H. influenzae strains (mixed, with fully-susceptible and those with known mechanisms of antibiotic resistance) were selected from our 1991 collection (Powell et al., 1991), and forwarded to participating laboratories on slopes of chocolate agar. H. influenzae strains ATCC491002 (susceptible), and two ampicillin-resistant H. influenzae (/?-lactamase-positive, W10311, and -negative, 518),were included for internal quality assurance.
Test methods in participating laboratories
The participating laboratories were required to perform the susceptibility testing in their own routine way. The agents tested were ampicillin, chloramphenicol, tetracycline, trimethoprim, ciprofloxacin and whichever cephalosporins they tested routinely.
Report form and questionnaire
A result sheet with a list of the strains and the six antimicrobial agents, and a questionnaire on the methods (inoculum size, interpretation, disc content of antimicrobial agents) accompanied the strains.
Data analysis
All data were entered on to an Apple Macintosh Classic II computer and analysed with the computer package Statview II. The participants' results, recorded as 'suceptible' or 'resistant' were regarded as 'in agreement' if the results were the same as those
of the LHMC and as 'in disagreement' if different. Results recorded as 'intermediate' were included in the resistant group. The zone diameters measured in the participating laboratories were also recorded and forwarded to the LHMC for analysis.
Results
Susceptibility test methods used by participating laboratories
The methods used by the 15 participating laboratories are shown in Table I. One laboratory, laboratory E, used the broth dilution method whereas the others routinely used disc diffusion tests. Among those laboratories using disc diffusion tests, two used Stake's method with an H. inftuenzae control strain (laboratories G and H).
Five participating laboratories in the UK used diagnostic sensitivity test agar (DST) supplemented with either lysed horse blood and NAD or chocolatized horse blood and isovitalex. In other European countries, supplemented Mueller-Hinton and IsoSensitest agars were commonly used whereas two laboratories in the USA used supplemented haemophilus test agar.
All the UK laboratories used discs containing 2/ig ampicillin, 10/zg chloramphenicol, 10/ig tetracycline, but the contents of the trimethoprim, cephalosporins and ciprofloxacin discs used varied with each laboratory. Higher content ampicillin, chloramphenicol and tetracycline discs were commonly used in the laboratories outside the UK.
Techniques for the preparation and estimation of inocula were variable with no two laboratories following identical procedures.
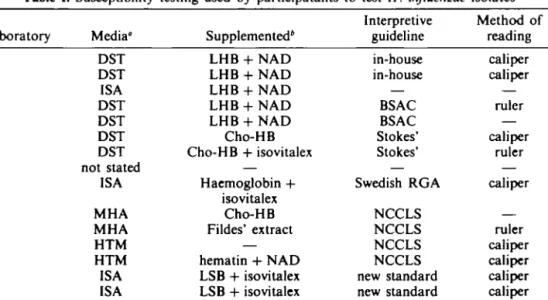
Table I. Susceptibility testing used by participatants to test H. influenzae isolates
Laboratory A B C D E G H I J L M N O P R K Media" DST DST ISA DST DST DST DST not stated ISA MHA MHA HTM HTM ISA ISA not stated Supplemented4 LHB + NAD LHB + NAD LHB + NAD LHB + NAD LHB + NAD Cho-HB Cho-HB + isovitalex — Haemoglobin + isovitalex Cho-HB Fildes' extract — hematin + NAD LSB + isovitalex LSB + isovitalex — Interpretive guideline in-house in-house — BSAC BSAC Stokes' Stokes' — Swedish RGA NCCLS NCCLS NCCLS NCCLS new standard new standard — Method of reading caliper caliper — ruler — caliper ruler — caliper — ruler caliper caliper caliper caliper — •DST, Diagnostic sensitivity test agar; ISA, IsoSensitest agar, MHA, Mueller-Hinton agar; HTM, haemophilus test medium.
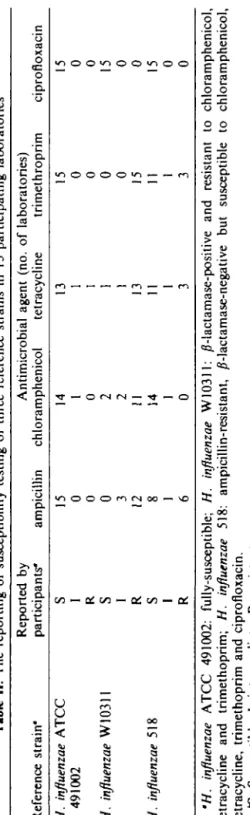
Tabl e II . Th e reportin g o f susceptibilit y testin g o f thre e referenc e strain s i n 1 5 participatin g laboratorie s Referenc e strain ' H. influenzae ATC C 49100 2 H. influenzae W1031 1 H. influenzae 51 8 Reporte d b y participants " S I R
s
I R S I R ampicilli n 15 0 0 0 3 12 8 1 6 Antimicrobia l agen t (no . chloramphenico l tetracyclin e 14 1 0 2 2 11 14 1 0 13 1 1 1 1 13 11 1 3 o f laboratories ) trimethropri m 15 0 0 0 0 15 11 1 3 ciprofloxaci n 15 0 0 15 0 0 15 0 0 (/ ) ** } ns
'H. influenzae ATC C 491002 : fully-susceptible ; H. influenzae W10311 : /?-lactamase-positiv e an d resistan t t o chloramphenicol , tetracyclin e an d trimethoprim ; H. influenzae 518 : ampicillin-resistant , /?-lactamase-negativ e bu t susceptibl e t o chloramphenicol , tetracycline , trimethopri m an d ciprofloxacin . *S , Susceptible ; I , intermediate ; R , resistant .Susceptible results for quality control reference strains
Despite variations in inhibition zone diameters recorded by participating laboratories, categorisation of the susceptibility of the three reference strains of H. influenzae was generally correct, with the exception of ampicillin against the intrinsically ampicillin-resistant H. influenzae strains (Table II). Only six laboratories reported these organisms correctly as resistant, of which five used 2/ig ampicillin discs. A minority of laboratories reported strain W10311 incorrectly as chloramphenicol and trimethoprim susceptible and strain 518 as tetracycline and trimethoprim resistant. All these laboratories used 30/^g discs.
Since different cephalosporins were used by different participating laboratories, results for these antimicrobials are not shown in Table II. Nevertheless, all laboratories reported both strains ATCC491002 and W10311 to be cephalosporin-susceptible whereas variable results were reported with the intrinsically ampicillin-resistant strains (518). Three laboratories using cefuroxime discs and one using cephalothin discs reported this strain as showing intermediate resistance, whereas the remainder reported it as susceptible to either cefuroxime, cefotaxime or ceftriaxone. AJ1 three reference strains were reported as susceptible to ciprofloxacin by all participating laboratories.
Susceptibility test results recorded at participating laboratories
Although 150 H. influenzae strains were distributed, some isolates were not viable upon subculture in some laboratories. Consequently, different numbers of strains were tested at each centre.
Inhibition zone diameters of each antimicrobial agent recorded in participating centres were plotted on separate histograms. Since laboratory E was using the dilution method, only the results from the other 14 laboratories were used to plot the histograms. Susceptibility breakpoints used by all except two participating laboratories for each of the antimicrobial agents are shown by solid lines. The other two laboratories used Stokes' method.
Ampicillin
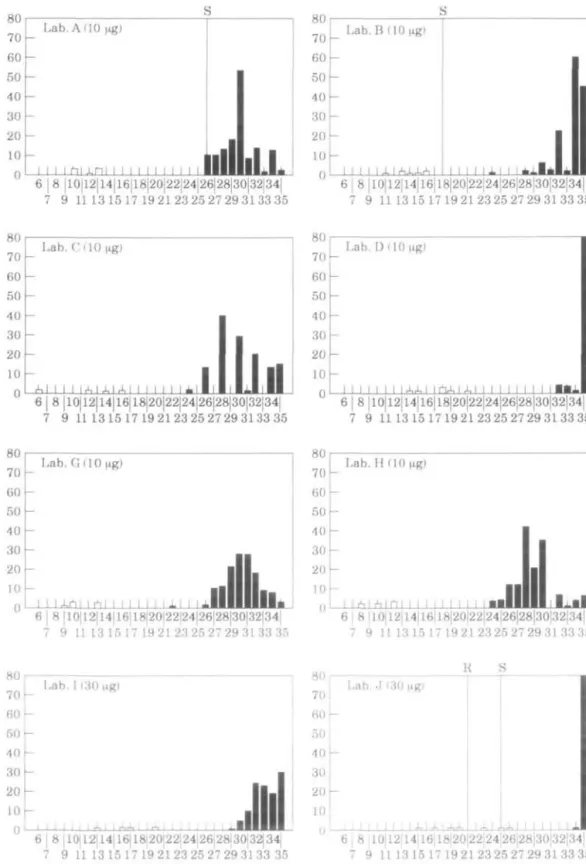
Table III summaries the discrepancies between the LHMC and participating laboratories in the reporting of susceptibility to ampicillin. Figure 1 shows histograms depicting the inhibition zones obtained with ampicillin discs from each reporting laboratory.
For the ampicillin-susceptible strains, eight of the laboratories (B, E, G, H, I, J, L and N) reported results in full concordance with the LHMC and five others (C, D, M, O and R) showed only one or two cases of interpretative disagreement. In some laboratories, for example, laboratory R, two ampicillin-susceptible strains were recorded as resistant owing to the diminished zone sizes recorded by this laboratory. The reason for this was unknown but presumably due to inoculum size. Of the susceptible strains, 54% were reported as intermediate by laboratory P. This is because the susceptible breakpoint used by this laboratory was > 3 m m larger than that used by any of the other laboratories except laboratory J. The fact that so many strains overall were passed as 'intermediate' in laboratory P was because of the wide separation of resistant and susceptible breakpoints.
Tabl e III . Reportin g o f ampicilli n susceptibilit y i n eac h laboratory " Laborator y (no . o f strains ) A (150 ) B (150 ) C (140 ) D (150 ) E(150 ) G (145 ) H (148 ) 1(116 ) J ("48 ) L (138 ) M (128 ) N (149 ) 0(149 ) P (149 ) R(95 ) K (149 ) Dis c conten t 0*g ) 2 2 2 2 —' 2 2 10 10 10 10 10 10 10 10 10 reporte d 10 0 (56 ) 10 0 (56 ) 9 8 (51 ) 9 8 (55 ) 10 0 (56 ) 10 0 (53 ) 10 0 (55 ) 10 0 (46 ) 10 0 (54 ) 10 0 (51 ) 9 5 (39 ) 10 0 (55 ) 9 8 (55 ) 4 6 (26 ) 9 5 (40 ) 91 (51 ) Amp-S * S reporte d R/I ' 0 0 2(1 ) 2(1 ) 0 0 0 0 0 0 5(2 ) 0 2(1 ) 5 4 (30 ) 5(2 ) 9(5 ) Amp-R reporte d S 0 2(1 ) 2(1 ) 0 2(1 ) 2(1 ) 0 11 (4 ) 0 4(2 ) 8(4 ) 6(3 ) 8(4 ) 0 10(3 ) 26(13 ) 0 + ve f reporte d R 10 0 (50 ) 9 8 (49 ) 9 8 (45 ) 10 0 (50 ) 9 8 (49 ) 9 8 (49 ) 10 0 (50 ) 8 9 (31 ) 10 0 (50 ) 9 6 (45 ) 9 2 (44 ) 9 4 (47 ) 9 2 (46 ) 10 0 (49 ) 9 0 (27 ) 7 4 (37 ) Amp-R reporte d S 0 82 (36 ) 5 5 (23 ) 11 (5 ) 8 9 (39 ) 7 4 (31 ) 3 7 (16 ) 9 1 (32 ) 6 8 (30 ) 8 7 (35 ) 6 9 (27 ) 9 3 (41 ) 7 9 (34 ) 2 3 (10 ) 10 0 (23 ) 7 0 (30 ) /J-ve ^ reporte d R/ I 10 0 (44 ) 18(8 ) 4 5 (19 ) 8 9 (39 ) 11 (5 ) 26(11 ) 6 3 (27 ) 9(3 ) 3 2 (14 ) 13(5 ) 31 (12 ) 7(3 ) 21 (9 ) 7 7 (34 ) 0 30(13 ) Th e numbe r represent s percentag e (%) ; thos e i n parenthese s represen t th e numbe r o f isolates . *Ampicillin-susceptible . 'Ampicillin-resistant , /Mactamase-positive . 'Ampicillin-resistant , 0-lactamase-negative . "5 , susceptible ; R/I , eithe r resistan t o r intermediate . 'Laborator y E use d dilutio n method . Vi
t
Laboratories other than I and K, were ;>90% efficient in detecting the resistance of the /?-lactamase-positive strains. There was however frequent disagreement between the LHMC and the participating laboratories in the categorisation of strains considered at the LHMC to have intrinsic resistance to ampicillin. The participating laboratories reported anywhere from 11% to 100% of these strains as susceptible; laboratories using lug ampicillin discs reported 11% to 82% as susceptible and those using 10//g reported 23% to 100% as susceptible. Overall, laboratories using 2/ig ampicillin discs were more likely to detect intrinsic resistance than those using 10/ig discs (P < 0.05).
In some laboratories, apart from disc content, the adoption of inappropriate breakpoints was responsible for the failure to detect intrinsic resistant. This was apparent in laboratories B, J and N. For instance, 75% of resistant strains would have been reported correctly if the susceptibility guidelines of laboratory B were adjusted to 21mm rather than 18mm. For laboratory P, the wide gap between susceptible and resistant breakpoints resulted in most strains, with or without intrinsic resistance, being classed as 'intermediate'. Among the other laboratories, the distribution of ampicillin zones for the ampicillin-susceptible and -resistant strains overlapped.
Chloramphenicol
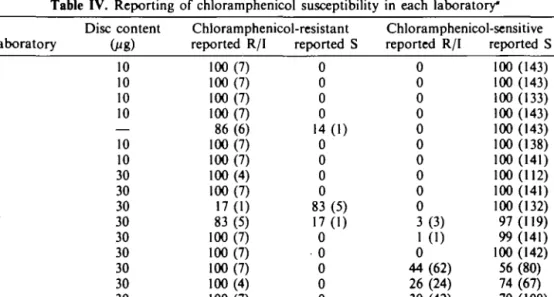
Seven of the 150 H. influenzae strains were resistant to chloramphenicol and produced chloramphenicol-acetyltransferase (CAT). Results for chloramphenicol susceptibility and zone distribution recorded in the participating laboratories are shown in Table IV and Figure 2. Results reported by eight laboratories were in concordance with the LHMC and two further laboratories had only one discordant result each. As for the laboratories which failed to report results in agreement with the LHMC, the adoption of inappropriate interpretive guidelines was apparent in laboratories K, L, P and R. For laboratories K, P and R, the breakpoints detected all resistant strains, but the breakpoints were inappropriate because they also included most of the susceptible
Table IV. Reporting of chloramphenicol susceptibility in each laboratory*
Laboratory A B C D E G H I J L M N O P R K Disc content (MS,) 10 10 10 10 — 10 10 30 30 30 30 30 30 30 30 30 Chloramphenicol-resistant reported R/I 100 (7) 100(7) 100(7) 100(7) 86(6) 100(7) 100(7) 100(4) 100(7) 17(1) 83(5) 100 (7) 100(7) 100(7) 100(4) 100(7) reported S 0 0 0 0 14(1) 0 0 0 0 83(5) 17(1) 0 0 0 0 0 Chloramphenicol-sensitive reported R/I 0 0 0 0 0 0 0 0 0 0 3(3) 1 (1) 0 44(62) 26 (24) 30 (42) reported S 100 (143) 100 (143) 100(133) 100 (143) 100 (143) 100(138) 100 (141) 100(112) 100(141) 100(132) 97 (119) 99 (141) 100 (142) 56(80) 74(67) 70 (100) •Other details as in footnote to Table III.
370 S. F. Yeo et al. 6 | 8 |10|12|14|16|18|20|22|24|26|28|30|32|34| 7 9 111315 17 192123252729313335 6 | 8 |10|12|14|16|18|20|22|24|26|28|30|32|34| 7 9 11 1315 17 1921 2325 27 29 31 33 >35 S
£
3 6 j 8 |10|12|14|16|18|20|22|24|26|28|30|32|34| 7 9 111315 17 19 2123 25 27 29 3133 35 30 20 10 -Lab. D (2[Minn
Q
Jlln.
M l 6 | 8 |10|12 14|16|18|2O|22|24|26|28|3O|32|34 7 9 1113 15 17 19 2123 25 27 29 3133 35 6 | 8 |10|12|14|16|18|20|22|24|26|28|30|32|34| 7 9 1113 15 17 19 2123 2527 29 3133 35 6 I 8 |10|12|14|16|18|20|22|24|26|28|30|32|34| 7 9 111315 17 192123252729313335 R S R 6 | 8 |10|12|14|16|18|20|22|24|26|28|30|32|34 7 9 1113 15 17192123252729313335 6 | 8 |10|12|14|16|18|20|22|24|26|28|30|32|34| 7 9 1113 15 17 192123252729313335 Zone diameter6 | 8 |10|12|l4|l6|18|20|22]24|26|28|30|32|34| 7 9 11 13 15 17 19 2123 25 27 29 31 33 35 40 r R S 30 20 10 -Lab. M HO ugi ni i i i n.m l o i n ii • • i 6 j 8 |10|12jl4|16|l8|20|22|24|26|28|30|32|34| 7 9 111315 17192123252729313335
I
5 40 30 20 10 u E Lab. N (10 ug)-ni I mrinnOnnllr
6 8|10|12|14|16|l{i|20|22|24|26|28|30|32|34|nflH
Jlll.1..
7 9 1113 15 17 192123252729313335 R S 6 | 8 |10|l2|14|16|l8|20|22|24|26|28|30|32|34 7 9 1113 15 17 19 2123 25 27 29 3133 35 6 8 |10|12|14|16|18|20|22|24|26|28|30|32|34| 7 9 1113 15 17 19 2123 25 27 29 3133 35 6 I 8 |10|12|14|16|18|20|22|24|26|28|30|32|34| 7 9 1113 15 17192123252729313335 R S 6 I 8 |10|l2|14|16|18|20|22|24|26|28|30|32|34| 7 9 1113 15 17 192123252729313335 Zone diameterFigure 1. Inhibition zones (mm) of ampicillin for the central laboratory (Lab. A) and each laboratory. • , Ampicillin-susceptible; 0 , ampicillin-resistant, /?-lactamase-positive; D. ampicilhn-resistant, ^-lactamase-negative.
372 S. F. Yeo et al. 80 70 60 50 40 30 20 10 n u ] Lab. A (10 ng) -i -i -i -i h -i -i n -i -i -i -i -i -i -i -i -i I -i 11
ml
ill.
6 j 8 |10|12|14|16|18|20|22|24|26|28|30|32|34 7 9 1113 15 17 19 2123 25 27 29 3133 35 6 | 8 |10|12|14|l6jl8|20|22|24|26|28|30|32|34| 7 9 11 13 15 17 19 21 23 25 27 29 31 33 35 80 70 60 50 40 30 20 10 0 Lab. C (10 \ig) •M I I I I A 1 1 1 A l M i l llilill
6 | 8 |10|12|14|16|18|20|22|24|26|28|30|32|34| 7 9 111315 17 192123252729313335 80 70 60 50 40 30 20 10 Lab. D (10 I I I XX I I r V , I 1 I I I I I I I 1 1 W X 6 | 8 |10|12|14|16|l8|20|22|24|26|28|30|32|34 7 9 1113 1517192123252729313335 80 70 60 50 40 30 20 10 0 Lab. G (10 tig) I lr*1 I I i M I 1 I I I I I J. I 6 | 8 |10|12|14|16|18|20|22|24|26|28|30|32|34| 7 9 111315 17192123252729313335 80 70 60 50 40 30 20 10 0 Lab. H (10 |ig) I I r M r h i n i I I 6 I I I I 8 j 10| 12jl4| 16| 18|20|22|24|26|28|30|32|34| 7 9 1113 15 17 19 2123 25 27 29 3133 35 6 | 8 |10|12|14|16|18|20|22|24|26|28|30j32|34| 7 9 1113 15 17 19 2 1 2 3 25 27 29 3 1 3 3 35 R S Lab. J (30 ug) I r U I 1 I I 6 | 8 |10jl2|14|l6|l8|20|22|24|26|28|30|32|34 7 9 1113 15 17 19 2 1 2 3 25 27 29 3 1 3 3 35 Zone diameter80 70 60 50 40 30 20 10 0 R Lab. L 130 I I 1 I M 1 JL I rS I J- I I I 1 1 1 1
I
l.l
80 70 60 50 40 30 20 10 0 6 8 |10|12|14|16|18|20|22|24|26|28|30|32|34 7 9 1113 1517 192123252729313335 R Lab. N (30 _LL I 1 14,4,1^4,4,1 14,1 6 | 8 |10|12|14|16|18|20|22|24|26|28|30|32|34 7 9 1113 15 17 192123252729313335 80 70 60 50 40 30 20 10 0 Lab. P (30 I I I I I I I I I J.1A6 I J-Ll-LJ....III
1.1
6 | 8 |10|12|14|16|18|20|22|24|26|28|30|32|34| 7 9 1113 15 17 19 2123 25 27 29 3133 35 80 70 60 50 40 30 20 10 f\ U R i Lab. M (10 ugl -I l l l l l l -I -I J . -I 1 -I -I l l l l l JU •1
.1
6 | 8 10|12jl4|l6|l8|20|22|24|26|28|30|32|34| 7 9 111315 17 192123252729313335 80 70 60 50 40 30 20 10 0 80 70 60 50 40 30 20 10 0 R S Lab. O (30 II II I I I A I AXJLi. I I I J_L4«JU_
6 8 |10|l2|14jl6|18|20|22|24|26|28|30|32|34| 7 9 111315 17192123252729313335 R Lab. R (30 I I I I I I I I 14.4, I 111 1 1 1 I XI 6 | 8 |10|12|l4|16|18|20|22|24|26|28|30|32|34| 7 1113 15 17 192123252729313335 80 70 60 50 40 30 20 10 0 Lab. K (30 I l l l .LAJ.fi I K SJlllL.
6 8 [10|12|14|16|18|20|22j24|26)28|30|32(34| 7 9 1113 15 17 19 2123 25 27 29 3133 35 Zone diameter374 S. F. Yeo tt al.
strains as susceptible. In laboratory J, a zone diameter of 25mm was adopted as the breakpoint despite the 26mm zone produced. Laboratories using 30/ig chloramphenicol discs made significantly more errors, including the false reporting of susceptible and resistant results, than those using 10//g discs (P < 0.05).
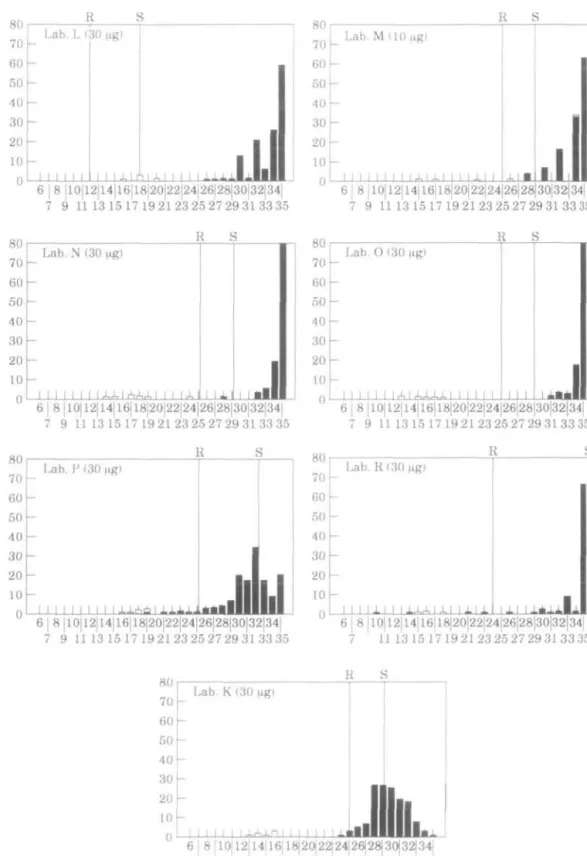
Tetracycline
Discrepancies in reporting tetracycline-susceptibility between the LHMC and the participants are shown in Table V. Three laboratories reported all results in concordance with the LHMC, whereas five showed only one or two discordant results. On average, laboratories using 10/ig discs made significantly fewer errors than those using 30/ig discs {P < 0.05). Laboratories using supplemented DST agar showed a significantly lower error rate, including the false reporting of susceptibility and resistance, than those using other media (P < 0.05). Inappropriate interpretive guidelines were also apparent in some laboratories, where either resistance was reported as susceptible or vice versa (Figure 3). Furthermore, the zone sizes produced by some of the resistant strains overlapped with those of the susceptible strains. This was a particular problem with laboratories using 30fig discs. Among those using doxycycline, laboratories P and R detected resistance in all of the strains recorded as resistant by the LHMC, but greatly overestimated susceptibility amongst those found susceptible by the LHMC: 74% of which were categorised as intermediate by laboratory P and 89% of which were reported as intermediate by laboratory R.
Trimethoprim
Table VI shows the susceptibility of trimethoprim reported by participating laboratories, while the histograms in Figure 4 show the zone distribution.
Table V. Reporting of tetracycline susceptibility in each laboratory*
Laboratory A B C D E G H I J L M N O* P* R* K Disc content 0«g) 10 10 10 10 — 10 10 30 30 30 30 30 30 30 30 30 Tetracycline-resistant reported R/I 100 (19) 90 (17) 100 (19) 90 (17) 100 (19) 94 (17) 100 (18) 85(11) 100 (17) 50(8) 94 (15) 100 (19) 89 (16) 100 (19) 100 (8) 32(6) reported S 0 10(2) 0 10(2) 0 6(1) 0 15(2) 0 50(8) 6 ( 1 ) 0 11 (2) 0 0 68 (13) Tetracycline-sensitive reported R/I 0 0 0 0 1 (1) 0 0 0 0 0 15(17) 13(17) 8(10) 74 (96) 89 (77) 2 ( 2 ) reported S 100 (131) 100 (131) 100 (121) 100 (131) 99 (130) 100 (127) 100 (130) 100 (103) 100 (131) 100 (122) 85 (95) 87 (113) 92 (121) 26 (34) 11 (10) 98 (128) •Other details as in footnote to Table III.
Table VI. Reporting of trimethoprim susceptibility in each laboratory*
Disc content Trimethoprim-resistant Trimethoprim-sensitive Laboratory Medium* (jig) reported R/I reported S reported R/I reported S A B C D E G H I J L M N 0 P R K DST' DST' ISA' DST' DST' DST' DST' NS ISA MHA' MHA HTM HTM ISA' ISA' NS 1.25 2.5 2.5 1.25 — 2.5 2.5 1.25 5 5 1.25 1.25 1.25 2.5 5 1.25 100 (47) 85 (40) 80 (36) 89 (42) 100 (47) 93 (42) 98 (45) 90 (37) 89 (42) 80 (35) 27(11) 85 (40) 89 (42) 98 (46) 90 (29) 66 (31) 0 0 15(7) 20(9) 10(5) 0 0 7(3) 2(1) 10(4) 11 (5) 20(9) 73 (30) 15(7) 11 (5) 2(1) 10(3) 34 (16) 0 0 0 0 0 0 1 (1) 3(3) 1 (1) 0 0 0 0 0 0 0 0 0 0 o 0 0 0 72 (73) 10(6) 1 (1) 100 (103) 100 (103) 100 (95) 99 (102) 97 (100) 99(99) 100 (102) 100 (75) 100(101) 100 (94) 100 (87) 100 (102) 100 (102) 28 (29) 90 (57) 99 (101) "Other details as in footnote to Table III.
*See Table I for the abbreviations; NS, not stated. 'Added lysed blood.
Despite the fact that laboratories using DST agar supplemented with lysed horse blood gave significantly better results in the detection of resistance than those using other media (P < 0.05), some of the discrepancies could be attributed to the use of inappropriate breakpoints. This was apparent in laboratories B, M and K where ;> 15% of the resistant strains were reported as susceptible. Although most of the laboratories reported the susceptible strains correctly, 73/102 of thetrimethoprim-susceptible strains were misreported by laboratory P.
Cephalosporins
Despite the varieties of cephalosporins and disc contents tested, there was a constant pattern of mean inhibition zone sizes recorded with cephalosporin discs at nine participating laboratories: inhibition zone sizes for intrinsically ampicillin-resistant strains were significantly smaller than those for the ampicillin-susceptible and /?-lactamase-producing strains (/* < 0.01). Among these laboratories, six used cefuroxime, two used cefotaxime and one cephalothin. Nevertheless, there was always some overlap between the zones for the ampicillin-susceptible and intrinsically ampicillin-resistant strains. This overlap was least prominent in four laboratories (B, G, H and J) using cefuroxime, but tended to be greater in laboratories using cefotaxime, ceftriaxone and cefalothin discs (Figure 5).
Ciproftoxacin
Figure 6 shows the wide variation in the distribution of inhibition zone sizes even when the same disc content was used. The modal MIC of ciprofloxacin was 0.015mg/L, all strains were inhibited by ^0.06mg/L of this antimicrobial agent, and all were assumed
376 S. F. Yeo et al. 50 40 30 20 10 0 6 | 8 |10|l2|14|l6|18|20|22|24|26|28|30|32|34| 7 9 1113 15 17 19 2123 25 27 29 3133 35 6 8 |10|12|14|16|18|20|22|24|26|28|30|32|34 7 9 1113 15 17 19 2123 25 27 29 3133 35 50 40 30 20 10 0
s
Lab. C (10 I I I I I X I X 1 | J - I l l I • I • 1 1 1 I I±I 6 I 8 |10|12|14|16|18|20|22|24|26|28|30|32|34| 7 9 1113 15 17 19 2123 25 27 29 3133 35 50 40 30 20 10 n Lab. D (10 |xg) -rh 1 1 -rh^nnriAn 11 1 1 j .nil
1
iLiii.
6 | 8 |10|12)14|16|18|20|22|24|26|28|30|32|34 7 9 111315 17192123252729313335 6 | 8 |10|12|14|16|18|20|22|24|26|28|30|32|34| 7 9 1113 15 17 19 2123 25 27 29 3133 35 6 | 8 |10|12|14)16)18|20|22|24|26|28|30|32|34 7 9 1113 15 17 19 2123 25 27 29 3133 35 50 40 30 20 10 0 Lab. I (30 i i i i i i i i i 6 I 8 |10!12|14|16|18|20|22|24|26|28|30|32|34| 7 9 1113 1517 192123252729313335 50 40 30 20 10 K Lab. J (30 i , I In
,i 1111nnrui 6 | 8 |10|12|14|l6|l8|20|22|24|26|28|30|32|34| 7 9 1113 15 17 192123252729313335 Zone diameter50 40 30 20 10 0 Lab. 14, [ R i 1. (30 I \ X X iQx i i • i x
1.
1
[\
6 | 8 |10|12|14|16|18|20|22|24|26|28|30|32|34| 7 9 11 13 15 17 19 2123 25 27 29 3133 35 R 6 | 8 |10|12|14|16|18|20|22|24|26|28|30|32|34| 7 9 1113 1517 192123252729313335 S 3 6 | 8 |10|12|14|16|18|20|22|24|26|28|30|32|34j 7 9 1113 15 17 19 2123 25 27 29 3133 35 6 | 8 |10|12|14|16|18|20|22|24|26|28|30|32|34| 7 9 1113 15 17 19 2123 25 27 29 3133 35 6 | 8 |10|12|14|16|18|20|22|24|26|28|30|32|34| 7 9 1113 15 17192123252729313335 50 40 30 20 10 0 R S Lab. R (30 |xg) 6 | 8 |10|12 14|16|18|20|22|24|26|28|30|32|34| 7 9 1113 15 17192123252729313335 6 | 8 |10|12|14|16|18|20|22|24|26|28|30)32|34| 7 9 1113 15 17 192123252729313335 Zone diameter378 50 40 30 20 10 0 Lab. A (1.25 I I I A l
LhllllliL
50 40 30 20 10 0 6 | 8 |10|12|14|16|18|20|22|24|26|28|30|32|34| 7 9 1113 15 17 192123252729313335 R S. F. Yeo et al. 50 40 30 20 10 0 Lab. C (2.5 I I I n l l IHill
rS I eb I Bz
6 | 8 |10|12|14|16|18|20|22|24|26|28|30j32|34| 7 9 1113 15 17 19 2123 25 27 29 3133 35 6 | 8 |10|12|14|16|18|20|22|24|26|28|30|32|34| 7 9 1113 15 17 192123252729313335 50 40 30 20 10 -1 •—} —1—1— Lab. I (1.25 HR) 1 1 1 1 1 1 1 r ^ 1 I 1 1 1 1LUIIHIIIIII-I
6 I 8 |10|12|14|16|18|20|22|24|26|28|30|32|34| 7 9 1113 15 17 19 2123 25 27 29 3133 35 Lab. B (2.5 I I I I 1 A I A I I I ,r*iA I A I A 6 I 8 |1O|12|14|16|18|2O|22|24|26|28|3O|32|34| 7 9 1113 15 17 192123252729313335 50 40 30 20 -10 h 0 Lab. D( 1.25 1...Lllll
6 I 8 |10|l2|14|16|18|20|22|24|26|28|30|32|34| 7 9 1113 15 17 19 2 1 2 3 25 27 29 3 1 3 3 35 50 40 30 20 10 0 50 40 30 20 Lab. H (2.5 If] I I I AA I I A I AX I1IJ1L.
6 I 8 |10|12|14|16|18|20|22[24|26|28|30|32|34| 7 9 1113 15 17 192123252729313335 R S Lab. J (5 Dl 6 I 8 |10|12)14|16|18|20|22)24|26|28|30|32|34| 7 9 1113 15 17 19 2123 25 27 29 3133 35 Zone diameter50 40 30 20 10 0 50 40 30 20 10 R R S Lab. 1. (5 I Xr1i[Tl.r1i I X I
IJiJ
6 | 8 |10|12|14|16|18|20|22j24|26]28|30|32|34) 7 9 1113 15 17 19 2123 25 27 29 3133 35 R L a b . N ( 1 . 2 5 jig) A I I I ArM I I-•••lilllIlL
E 9 6 j 8 |10|12|14|16|18|20|22|24|26|28|30|32|34| 7 9 1113 15 17 19 2123 25 27 29 3133 35 80 70 60 50 40 30 20 10 0 Lab. P (2.5 I I I I 1 I 1 1 I I 1 1 1 I I 6 | 8 |10|12|14|16|18|20|22|24|26|28|30|32|34| 7 9 1113 15 17 192123252729313335 50 40 30 20 10 Lab. M (1.25 ngi i n 11 J i 1111 n i n i U 6 | 8 110| 12| 14| 16| 18|20|22|24|26|28|30|32|34| 7 9 1113 1517 192123252729313335 50 40 30 20 10 0 5 0 4 0 3 0 2 0 10 0 R S Lab. O( 1.25 (ig) I I I I A I l 6 I 8 |10 12 14|16|18|20|22|24|26|28|30|32|34| 7 9 1113 15 17192123252729313335 R S Lab. R (5 ( I I I I A I A * I I X I l l l l I • • • 6 | 8 |10|12|14|16|18|20|22|24|26|28|30|32|34 7 9 1113 15 17 192123252729313335 50 40 30 20 10 0 R Lab. K( 1.25 6 | 8 |10|12|14|16|18|20|22|24|26|28|30|32|34| 7 9 1113 15 17 192123252729313335 Zone diameter380 50 40 30 20 10 0 Lab. A (cefuroxime 5 \n%) 15|17|19|21|23|25|27|29|31|33|35|37|39|41j43|45 16 18 20 22 24 26 28 30 32 34 36 38 40 42 44 XJ. I I I 1 I I I 15|17|19|2l|23|25|27|29j31|33j35j37|39|41|43|45 16 18 20 22 24 26 28 30 32 34 36 38 40 42 44 15|17|19|21|23|25|27|29|31|33|35|37|39|41|43|45 16 18 20 22 24 26 28 30 32 34 36 38 40 42 44
Lab. B (oefuroxime 30 pig)
i M 11
,1ml.
i B i i i i i i i 15|17|19|21|23|25|27|29|31|33|35|37|39|41|43|45 16 18 20 22 24 26 28 30 32 34 36 38 40 42 44 50 15|17|19|21|23|25|27|29|31|33|35|37|39|41|43|45 16 18 20 22 24 26 28 30 32 34 36 38 40 42 44 15|17|19|21|23|25|27|29|31|33|35|37|39|41|43|45 16 18 20 22 24 26 28 30 32 34 36 38 40 42 44 50 40 30 20 10 0 Lab. M (cefuroxime 30 \xg) 15|17|19|21|23|25|27|29|31|33|35|37|39|41|43|45 16 18 20 22 24 26 28 30 32 34 36 38 40 42 44 15|17jl9|2l|23|25|27j29|31|33|35|37|39|41|43|45 16 18 20 22 24 26 28 30 32 34 36 38 40 42 44 Zone diameter50 40 30 20 10 0 15|17|19|21|23|25|27|29|31|33|35[37|39|41|43|45 16 18 20 22 24 26 28 30 32 34 36 38 40 42 44 15|17|19|21|23|25|27|29|31|33|35|37|39|41j43|45 16 18 20 22 24 26 28 30 32 34 36 38 40 42 44 50 40 30 20 10 0 £ s 7. 15|17|19|21|23|25|27|29|31|33|35|37|39|41|43|45 16 18 20 22 24 26 28 30 32 34 36 38 40 42 44 15|17|19|21|23|25|27|29|31|33|35|37|39|41|43|45 16 18 20 22 24 26 28 30 32 34 36 38 40 42 44 15|17|19|21|23|25|27|29|31|33|35|37|39|41|43|45 16 18 20 22 24 26 28 30 32 34 36 38 40 42 44 15|17|19|21|23|25|27|29|31|33|35|37|39|41|43|45 16 18 20 22 24 26 28 30 32 34 36 38 40 42 44 15|17|19|21|23|25|27|29|31|33|35|37|39|41|43|45 16 18 20 22 24 26 28 30 32 34 36 38 40 42 44 Zone diameter
|21|23|25[27|29|31[33|35|37|39|41|43|45 20 22 24 26 28 30 32 34 36 38 40 42 44 |21|23|25|27|29|31|33|35|37|39|41|43|45 20 22 24 26 28 30 32 34 36 38 40 42 44 |2l|23|25|27|29|3l|33|35j37|39|41|43|45 20 22 24 26 28 30 32 34 36 38 40 42 44 L a b . D f l I I I I I I I I I I - - III |21|23|25|27|29|31|33|35|37|39|41|43|45 20 22 24 26 28 30 32 34 36 38 40 42 44 |21|23|25|27|29|31|33|35|37|39|41|43|45 20 22 24 26 28 30 32 34 36 38 40 42 44 50 40 30 20 10 -Lab. H (1 \ig) 1 1 1 1 1 1 1 * 1 1
1
Illl111ll1 111 |21|23|25|27|29|31|33|35|37|39|41|43|45 20 22 24 26 28 30 32 34 36 38 40 42 44 |21|23|25|27|29|3l|33|35|37|39j41j43|45 20 22 24 26 28 30 32 34 36 38 40 42 44 21|23|25j27j29|31|33|35|37|39|41|43|45 20 22 24 26 28 30 32 34 36 38 40 42 44 Zone diameterLab. M (5 fig) l I i i i i* i i i I i 1 . |2l|23|25|27|29|3l|33|35|37|39j4l|43|45 20 22 24 26 28 30 32 34 36 38 40 42 44
• I
21|23|25|27|29|31|33|35|37|39|41|43|45 20 22 24 26 28 30 32 34 36 38 40 42 44 |21|23|25|27|29|3l|33|35|37|39j41|43|45 20 22 24 26 28 30 32 34 36 38 40 42 44 |21|23|25|27|29|31|33|35|37|39|41|43|45 20 22 24 26 28 30 32 34 36 38 40 42 44 50 40 30 20 10 0 |21|23|25|27|29j31|33|35|37|39|41|43|45 20 22 24 26 28 30 32 34 36 38 40 42 44 121123125127129131133 j 35137139141 [ 43145 20 22 24 26 28 30 32 34 36 38 40 42 44 50 40 30 20 10 0 Lab. K (5 ng) H I M * X * I I1
llm 1 1 1 1 1 1 1 1 |21|23j25|27]29|31|33|35|37|39|41|43|45 20 22 24 26 28 30 32 34 36 38 40 42 44 Zone diameter384 S. F. Yeo et al.
to be susceptible by the LHMC. However, disc testing at the LHMC showed that three strains gave zone sizes of < 33mm compared to a modal zone size of 39mm for all other strains. All participating laboratories reported these strains as susceptible even though reduced zone sizes were also recorded by them.
Discussion
It is apparent that susceptible and resistant strains will not be distinguished by a laboratory if either (a) the zone distribution for the groups of strains overlap, or (b) if the breakpoints used are inappropriate. Factors which may result in zones of susceptible and resistant strains overlapping in one laboratory but not in another included the inoculum size, the medium, the disc strenth, the incubation conditions and the accuracy with which the zones were measured.
Many sources of inter-laboratory variation in the detection of resistance can be identified, but, since no laboratories followed identical procedures, the identification of single factor responsible for causing erroneous results is difficult. The inoculum size is one factor. Inoculum size, although not specifically evaluated in the present study, is particularly important when testing susceptibility of H. influenzae. Inoculum density is critical if reproducible results are to be obtained. Most workers standardise the inoculum by "experience" and "judgement". Although comparison with McFarland standard is usually recommended, Lapointe & Lavallee (1987) noted a wide range of colony counts when the turbidity of bacterial suspensions were adjusted to match a 0.5 McFarland standard. Fernandes et al. (1987) also demonstrated significant problems in standardising the inoculum by adjusting a bacterial suspension visually to match a McFarland turbidity standard, and small changes in inoculum size may alter the zone diameters by at least 3—4mm. It is important, therefore, to adjust the inoculum carefully to allow high reproducibility.
Although the measurement of zone diameters appears to be an easy task, it is a potential source of error and may affect the final interpretation of results. In the present study, some laboratories only recorded even numbered zone diameters. Apparently the zone radius was measured and doubled. This is inherently inaccurate since the centre of the disc must be judged. Moreover, any errors in measurement of radii are doubled when these values are converted into diameters.
Despite the fact that many laboratories claimed to follow recommended methodologies and interpretive guidelines, e.g. NCCLS, some clearly failed to perform susceptibility testing in accordance with the methods and guidelines described. For example, laboratory L, although claiming to use the NCCLS methods, had quoted different breakpoints to laboratories M, N and O, which also claimed to use these methods. Since the susceptibility testing of H. influenzae is highly method-dependent, using only the recommended or prescribed breakpoint is unsatisfactory, the methodology must be followed in full.
Misreporting of susceptibility and resistance was common, even when zones for groups of strains were clearly distinguished as was, for example, generally the case with ampicillin, chloramphenicol, tetracycline and trimethoprim. These reflected the use of inappropriate breakpoints. Ideally, interpretive breakpoints should aim to separate the normal susceptible from the insusceptible or resistant populations. Results observed in the present study showed that, in many cases, despite the resistant and susceptible
populations having been clearly distinguished, some of the strains were reported wrongly because of an inappropriate breakpoint. Categorisation could in many cases be improved considerably if the breakpoints were adjusted to accomodate the local results. Since different methods were used in each laboratory, it would be better to decide the interpretive breakpoint by looking at their own results where the most appropriate cut-off occurs to distinguish the susceptible and resistant strains.
Only a few laboratories failed to identify ampicillin-susceptible and /Mactamase-positive H. influenzae. However, discrepancies between the LHMC and participating laboratories arose frequently with regard to the intrinsically ampicillin-resistant strains. The use of 2/ig ampicillin discs more readily identified intrinsic ampicillin-resistance than did the 10/ig discs. These results agree with those reported by Doern, Daum & Tubert (1987) and Powell & Williams (1988).
Failure to detect chloramphenicol resistance is often reported (Philpott-Howard et al., 1983; Snell, Perry & Brown, 1991; Snell, 1994). They observed that failure to detect chloramphenicol resistance by disc diffusion methods was quite common, but that error rates were minimised by the use of low content discs (10/ig). The results in the present study are in agreement with the findings of these authors, namely that the accurate detection of chloramphenicol resistance is faciliated by the use of low content (10/ig) rather than higher content discs (30/ig) (P < 0.05).
Philpott-Howard et al. (1983) noted that the detection of resistance to tetracycline was influenced by the medium used, whereas no association between disc content and detection of tetracycline resistance was established. The present study, however, showed both the use of DST agar and low content discs were associated with more accurate results (P < 0.05).
In a NEQAS survey, Snell (1994) revealed a 19% error rate of laboratories in detecting the susceptibility of H. influenzae to trimethoprim. In the present study, error rates ranged from 1% to 30% for the detection of resistant strains and 1% to 73% for susceptible strains. The present study showed that significantly more correct results were obtained by laboratories using DST agar supplemented with lysed blood than those using other media (P < 0.05).
Mean inhibition zone sizes of some cephalosporins discs were significantly reduced for intrinsically resistant strains compared with those for ampicillin-susceptible and /J-lactamase-positive strains. This was particularly apparent when cefuroxime was used. Cefuroxime discs may, perhaps, provide a useful indication for the detection of intrinsic resistance to ampicillin.
Distribution of inhibition zone diameters around ciprofloxacin discs varied considerably with each of the participating laboratories. However, laboratories using 1/ig and 5/ig discs reported smaller and normal distribution of zones than those using 10/ig discs. Although no ciprofloxacin-resistant strains were available to include in this exercise, three strains against which the MICs were low, nevertheless gave small zone sizes. These require further study.
In conclusion, problems still exist in many countries in the performance of susceptibility testing of H. influenzae. Most of the errors found were associated with the failure to assign the strains correctly. Considerable reduction in some of these error rates could be achieved simply by changing the methodology or adjusting the interpretive breakpoints. Recommendation, based upon this study and also on previous studies (Philpott-Howard et al., 1983; Snell et al., 1986) are: (1) it is unnecessary for all laboratories to perform the tests in the same way but tests need to be performed
386 S. F. Yeo et al.
in a reproducible manner. (2) The methods should be capable of differentiating accurately between susceptible and resistant strains. (3) Lower content antibiotic discs should be used. (4) Inocula should be made in a manner to allow high reproducibility. (5) Zone diameters should be measured precisely. (6) If a particular system for antimicrobial susceptibility testing is adopted this cannot be confined to interpretive breakpoints, but the prescribed methodology has to be precisely followed. (7) Interpretive breakpoints can be generated by the techniques employed in an individual laboratory and not solely based upon tabulated guidelines since different methods are used in each laboratory.
References
Doern, G. V., Daum, G. S. & Tubert, T. A. (1987). Ampicillin disk diffusion susceptibility testing of Haemophilus influenzae. Journal of Clinical Microbiology 25, 1675-8.
Fernandes, P. B., Hardy, D., Bailer, R., McDonald, E., Pinter, J., Ramer, N. et al. (1987). Susceptibility testing of macrolide antibiotics against Haemophilus influenzae and correlation of in vitro results with in vivo efficacy in a mouse septicemia model. Antimicrobial Agents
and Chemotherapy 31, 1243-50.
Lapointe, J. R. & Lavallee, C. (1987). Antibiotic interaction of amoxycillin and clavulanic acid against 132 /J-lactamase-positive Haemophilus isolates: a comparison with some other oral agents. Journal of Antimicrobial Chemotherapy 19, 49-58.
Philpott-Howard, J., Seymour, A. & Williams, J. D. (1983). Accuracy of methods used for susceptibility testing of Haemophilus influenzae in United Kingdom. Journal of Clinical
Pathology 36, 1105-10.
Powell, M., Fah, Y. S., Seymour, A., Yuan, M. & Williams, J. D. (1992). Antimicrobial resistance in Haemophilus influenzae from England and Scotland in 1991. Journal of Antimicrobial
Chemotherapy 29, 547-54.
Powell, M. & Williams, J. D. (1988). Detection of ampicillin resistant Haemophilus influenzae in United Kingdom laboratories. Journal of Clinical Pathology 41, 716-9.
Snell, J. J. (1994). Problems in susceptibility testings—findings of UK NEQAS for microbiology.
Journal of Antimicrobial Chemotherapy 33, 1—4.
Snell, J. J., Brown, D. F. J. & Phua, T. J. (1986). Antimicrobial susceptibility testing of
Haemophilus influenzae: trial organised as part of United Kingdom national external quality
assessment scheme for microbiology. Journal of Clinical Pathology 39, 1006-12.
Snell, J. J., Perry, S. F. & Brown, D. F. J. (1991). Detection of chloramphenicol resistance in
Haemophilus influenzae. Journal of Clinical Pathology 44, 77.
{Received 21 October 1994; returned 9 January 1995; revised 13 February 1996; accepted 18 April 1996)