Cost-effective approach to automated resource management using real time
sensing and networking by
Nedzad Lomigora
B.S. (Mech.) (High Hons.), Illinois Institute of Technology (1997) Submitted to the Department of
Mechanical Engineering
in Partial Fulfillment of the Requirements for the Degree of
Master of Science at the
Massachusetts Institute of Technology January 1999
@ 1997 Massachusetts Institute of Technology All rights reserved
Signature of Author_
Department of Mechanical Engineering January 25, 1999
Certified by
-Dr. David Brock Thesis Supervisor
Accepted by
Professor Ain A. Sonin Mechanical Engineering Chairman, Department of Graduate Committee
Cost-effective approach to automated resource management using real time
sensing and networking by
Nedzad Lomigora
Submitted to the Department of Mechanical Engineering on January 28, 1999, in partial fulfillment of the requirement for the degree of
Master of Science Abstract
Approximately 50% of the operating funds in heavy manufacturing are tied up in
inventory. Reducing this cost can be achieved by automating the inventory management. This thesis develops a cost-effective approach to automated resource management using real time sensing and networking. The enabling technology for automated inventory management is based primarily on real time sensing and standard network protocols and languages. With techniques developed in this thesis, all classes of resources, including discrete and continuous objects, can be managed with less labor than the traditional approaches.
Thesis Supervisor: David L. Brock
Acknowledgements
I would like to start with my advisor, Dr. Brock, who has sparked the fire in this thesis with his deep vision and brilliant ideas. The freedom he provided helped me to pursue my ideas confidently.
I can not say enough about my partner, and the best friend Ozgu, who motivated me to achieve beyond my expectations. Working with Ozgu was the best experience I bring from MIT. There was not a single project that two of us could not handle while
working together.
Sanjay, my new friend, thank you for your support and hospitality. Thank you for helping me in choosing my career after MIT. You made me realize that professors can be as friendly and as fun as my fellow students can.
I would like to thank my parents and my sister, who never stopped loving and supporting me and were my motivation through these years. Their courage and suffering through the times of war in Bosnia gave me enormous energy and pushed me beyond my limits to succeed.
Finally, and above all, I would like to thank to a person I owe the most for my success. She helped me become who I am now with her unselfish gift of love, sacrifice and endurance. Karen Lynn Swyers, thank you for your patience, laughter, and
happiness you brought to my life. Nobody else in my life had so much confidence in me as you did. You know me better than I know myself. This thesis is my gift to you with all my heart.
Table of Contents ABSTRACT ... 3 ACKNOWLEDGEMENTS ... 5 TABLE OF CONTENTS ... 6 LIST OF FIGURES ... 9 1 INTRODUCTION ... 11 1.1 M O TIV A TIO N ... 11 1.2 ENABLING TECHNOLOGY ... 11 1.3 CLASSES OF INVENTORY...13 1.4 TH E PRO BLEM ... 13 1.5 RESEARCH CONTRIBUTION ... 15 1.6 SCOPE OF THESIS ... 16
2 BACKGROUND - ENABLING TECHNOLOGIES...19
1.7 THE INTERNET...19
1.8 EMERGING COMMUNICATIONS TECHNOLOGIES ... 20
1.8.1 Wireless Internet Connection - Bluetooth ... 21
1.8.2 Miniature Data Tracking Devices - iButton ... 22
1.9 RADIO FREQUENCY IDENTIFICATION (RFID) TECHNOLOGY ... 22
1.10 OBJECT DESCRIPTION LANGUAGE (ODL) ... 23
1.10.1 Simplicity and Ease of Use ... 24
1.10.2 Physically Based Object Descriptions ... 24
1.10.3 User Based Object Descriptions ... 24
1.10.4 Object Information Maintenance ... 25
1.10.5 O bject M odels ... 25
1.10.6 A ctive Objects ... 26
1.10.7 ELECTRONIC ID (EID) ... 26
1.10.8 B it count ... 27
1.11 INTERNET MACHINES ... 28
3 A COST OPTIMAL MODEL FOR AUTOMATED INVENTORY MANAGEMENT USING THE WORLD WIDE WEB ... 31
3.1 ASSUMPTIONS AND CONSTRAINTS ... 32
3.1.1 Economic Analysis and Dynamic Demand ... 33
3.1.2 Determining the Reorder Point ... 36
3.1.3 Calculation of the Dynamic Demand Rate ... 40
3.1.4 Automatic Inventory Process via World Wide Web ... 43
4 EFFICIENT SENSOR CONFIGURATION FOR RESOURCE MEASUREMENT
OVER THE W ORLD W IDE WEB ... 47
4.1 SENSOR SUBSTITUTION ... 48
4.2 SINGLE BIT SENSOR ANALYSIS ... 49
4.3 GENERAL APPROACH TO SENSORY SUBSTITUTION ... 53
4.4 IMPROVING THE ACCURACY OF SINGLE BIT SENSOR MEASUREMENT ... 59
4.5 APPROACH TO SENSORY SYNTHESIS ... 60
4.6 CHAPTER SUMMARY ... 64
5 IMPLEMENTATION ... 67
5.1 AUTOMATIC INVENTORY OF SOFT DRINKS VIA WORLD WIDE W E B ... 6 8 5.2 EXPERIMENTAL SETUP ... 68 5.2.1 Softw are ... 69 5.2.2 Hardware ... 69 6 CONCLUSIONS ... 71 REFERENCES ... 73 APPENDIX ... 75
A. 1 STOCHASTIC PROBABILITY MODEL ... 75
List of Figures
Figure 1.1: Enabling technology comprising of basic hardware: tag, tag reader and
computer connected to a network ... 12
Figure 2.1: Instant dinner cooked by the microwave ... 30
Figure 2.2: Detailed information flow in the microwave ... 30
Figure 3.1: Time intervals used in calculating the dynamic demand ... 41
Figure 3.2: Demand rate calculated as the inventory changes ... 42
Figure 3.3: Probability distribution for no stockout ... 43
Figure 3.4: Automatic Inventory Management Process description ... 45
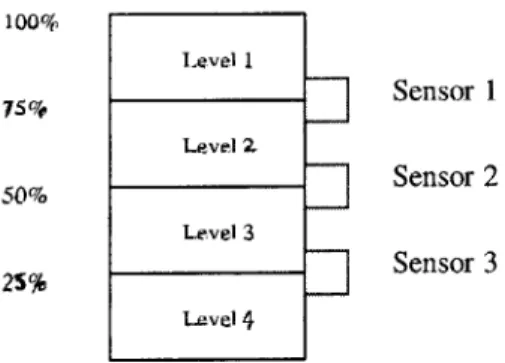
Figure 4.1: Fuel tank and sensor measuring four different fuel levels ... 48
Figure 4.2: Multi-sensor array can replace a single two-bit sensor ... 50
Figure 4.3: Multi-sensor array attached to the fuel tank measuring only one level, B < level <A ... 53
Figure 4.4: Solution space for R = [0,1] and number of sensors = [1,10] ... 56
Figure 4.5: Maximum of 40 sensors used to replace the higher resolution sensors ... 58
Figure 4.6: Matrix of single bit sensors ... 58
Figure 4.7a: Process Monitoring Scheme featuring sensor synthesis ... 59
Figure 4.7b: Multiple sensors used to measure level of the fuel in a tank ... 60
Figure 4.8: Definition of an area A used to determine if sensor
j
supports sensor i ... 62Figure 4.9: Definition of Pi(/xi) used to determine synthesized estimate for a state V ariab le ... 64
Figure 5.1: Experimental setup featuring the feedback loop ... 68
Figure 5.2: Software used for automated inventory management ... 69
Chapter 1 Introduction
This thesis develops a cost-effective approach to automated resource management using real time sensing and networking. The enabling technology for automated
inventory management is based primarily on real time sensing and standard network protocols and languages. With techniques developed in this thesis, all classes of
resources, including discrete and continuous objects, can be managed with less labor than the traditional approaches.
1.1 Motivation
Inventory management has always been a critical component of an efficient supply chain. Today's new business practices are forcing firms to operate with even leaner inventories and staff while providing higher supply availability and speed of delivery. The inventory of finished items awaiting final sale, or in process between stages of manufacture, or in raw materials, etc., accounts for a large amount of the money required to run the economy. For example, approximately 50% of the operating funds in heavy manufacturing are tied up in inventory which is why so much effort is being put into reducing this investment.
1.2 Enabling Technology
Currently, the real time sensing can be achieved by a typical Radio Frequency Identification (RFID) system shown in the Figure 1.1. It consists of a tag, a reader, and some sort of data processing equipment, such as a computer. The reader sends a request for identification information to the tag. The tag responds with the respective
information, which the reader then forwards to the data processing device. The tag and reader communicate with one another over a radio frequency (RF) channel. In some systems, the link between the reader and the computer is wireless. This technology
together with other existing technologies allow for every consumer object that has a tag to distribute information about itself over the World Wide Web (WWW). That
information can be communicated to all other objects or devices connected to the WWW.
Standard Network protocol and languages
ID information Request ID R ID information E A D E R The Database containing information about an object the tag is attached to
Request/Retrieve Information
Server
An object
Figure 1.1: Enabling technology comprising of basic hardware: tag, tag reader and computer connected to a network.
This integrated technology allows us to track inventory automatically.
Information about objects flows seamlessly across different platforms and industries. All the objects we are using in the daily life could be connected through the WWW. One common standard could be used for description of all manufactured items from coke cans to the airplanes. We are developing a special language, the Object Description Language (ODL), for this purpose. Information about all kinds of products would be available to users. These include manuals, instructions or product labels, just to name few.
In manufacturing, for example, the inventory problem could be analyzed in terms of a batch size to be produced. Some of the names used in scientific literature and industry that formulate this problem would be the Christmas tree problem, or the
newsboy problem, or formally, the single period inventory control problem. When selling Christmas trees, the businessman has to decide in advance how many trees to order because he can not replenish the supply. Furthermore, she can not make money on any unsold trees. The approach to solving a typical problem like this one is to model a demand, D, as a random process since the size of a batch, M, clearly depends on the demand.
1.3 Classes of Inventory
Automated inventory management would not be sufficient for some classes of inventory such as fluids or particles, because they are measured in continuous rather than discrete values. In order to keep track of these types of inventory, precise and cost effective measurements are required. These measurements would relate to the state of a process, machine or a particular component in a larger system. Today, high-resolution sensors are expensive for some simple applications such as keeping track of quantity of a matter. For example, it probably would not be cost effective to use high-resolution, sensors to keep track of the amount of milk in a milk container. It would be really convenient to be able to measure quantities of some food items, but because the cost is important constraint in such attempts, the ideas fail to become reality in every day's life.
1.4 The Problem
Today's practice of managing inventory is a mixture of manual and automated systems. Electronic Data Interchange (EDI) and Universal Product Codes (UPC) code are examples of standards used to track inventory [14, 15]. Bar code scanners are used to get information from objects and commonly seen in retail stores and distribution centers. Although software and electronics for inventory management is becoming more
sophisticated, the main deficit is wide variety of standards and formats used in inventory control, as well as, the manual labor needed to keep the track of the inventory. For
example, inventory can be tracked automatically provided all the data about the products is available. However, currently there is no efficient and cost effective way to the following:
Data Collection -collect the data about inventory without using human labor and
Communication -communicate the data with other distributors, manufacturers or consumers without converting to different data formats across different platforms and protocols.
Industry and academia are primarily focused on making software for inventory control more efficient, but not on fundamentally improving the way inventory management is performed or the format of inventory data is presented.
Tracking inventory such as milk, oil, or other liquids require precision sensors. Precision sensors are usually sensitive to changes in the environment and could be damaged due to unpredictably changing conditions. The size of high-resolution sensors often presents a difficulty when attaching them to various configurations. Using high resolution, high-cost sensors to keep track of quantity of such items such as milk, salad dressing, bread, etc., is not practical for the following reasons:
Cost -the cost of such attempt is too high (e.g. using a sensor of sufficient accuracy may cost more than the product itself. Furthermore, the cost of the lost information would not be significant compared to the cost of the sensor)
Geometry - the mounting and size of such sensors is impractical
Computation -actual use of sensor would require additional data processing and data storage equipment not readily available in shape and form that would suit
1.5 Research Contribution
This thesis improves management of physical inventory by implementing cost-effective techniques, which use the real-time measurement and standard networking protocols and languages. Already existing miniature and inexpensive tags attached to inventory provide a way to locate, identify and count objects, eliminating the need for manual labor and shortening the time to gather data. Making this set of operations more effective would incur large savings of time and labor.
One of the most important contributions of this thesis is a mathematical model for automatic Web ordering, which provides a more efficient and precise way of managing inventory. The demand of inventory is treated as a dynamic variable, which allows for better estimates of the reorder point. Another significant contribution is the
determination of the number of sensors for measuring continuous classes of inventory.
The methods and tools that are developed and presented in this thesis have the following characteristics:
Modeling Ease -The theoretical principles underlying each of the approaches used in this thesis are relatively simple and would be very easy to model for a particular inventory control problem.
Encompassing Many Problems - Use of RFID-based technology could be done in many different ways. This technology is more efficient in data retrieval, data storage and data exchange than current technologies. Although today's technology and RFID-based technology use the same hardware, the latter is more ubiquitous because it offers the implementation of a new standard. Some of the fields that could benefit from tag technology are preventive maintenance, product design, telerobotics and service industries, to name few.
Compatible with existing technologies -One of the main advantages of the tag
technology is its compatibility with existing technologies. To start using this technology, there is no need for any dramatic engineering advances, but only specific
implementations using existing technology.
Automatic inventory control developed in this thesis integrates some of the common techniques used for inventory control today such as stochastic demand estimates
[12]. In automatic inventory, a model of future demand is first developed and used to calculate the probable supply quantity needed to meet this demand, as well as the way to determine the reorder point (the point at which the new order is placed). The information about objects resides on the Web. The access restrictions should be implemented to ensure that confidential information is accessed by only authorized users.
For non-discrete inventory tags are not a good way of tracking. Sensory tags measure continuous quantities and communicate this information over the network. Once the quantity is known, the same mathematical model for automatic inventory could be used. Another result in this thesis is optimization of low-cost placement. The common denominator for comparing the measurements of single bit sensors and higher resolution sensors was the reliability of measurements for each type of sensors. Results show that it makes sense to replace expensive sensors with cheaper ones, which maintain the same functionality and reliability.
1.6 Scope of Thesis
Chapter 2 presents a new technology that integrates RFID technology with other technologies into WWW. This technology was evaluated through comparison with other similar technologies. Object Description Language and Universal Identifier are defined as integral components of tag technology. Chapter 3 develops a mathematical and practical model to be used for automatic inventory control via WWW. Chapter 4
addresses the potential of using cheap, single-bit sensors to replace high cost high-resolution sensors. Not only discrete objects, but also quantities such as liquid levels could be tracked using this new technology. Reliability was the same for both types of
sensors. Chapter 5 shows an implementation of the theory on two examples. Chapter 6 summarizes the significant results and presents future work.
Chapter 2
Background - Enabling Technologies
This thesis brings together a number of powerful, emerging technologies and extends these technologies for the purposes of resource management. The enabling technologies presented in this thesis rely heavily on the use of World Wide Web
(WWW). However, in the future there might be another communication medium that would be as applicable to enabling technologies as it is WWW today. The most
important contribution of this thesis is theoretical work. World Wide Web and enabling technologies are contemporary means for applying the ideas developed here.
2.1 The Internet
The Internet is truly revolution in communication. Today, people can instantly access and distribute information - text, picture, sound, and video - through a simple, intuitive interface. The World Wide Web (WWW) is both source and storage for vast quantities of human knowledge. The Web allows direct communication with other people and broadcast messages to millions. As advanced as the Internet is, however, it has left out the largest area of human endeavor - the physical world.
Physical objects could be described using a general markup language readable by a Web browser. Currently, there were numerous standards for communicating object descriptions such as File Transfer Protocol (ftp), gopher, Hypertext Markup Language (HTML), and the Extensible Markup Language and most recently, the Extensible Query Language. Currently, our technology uses Extensible Markup Language and the most popular Web markup language is Hypertext Markup Language (HTML) [17]. The HTML language has been powerful asset to Web development, but it lacks the capability for specialization, which restricts its growth. The entire HTML is already defined and in the case a user has a specialized task, such as transmitting the hospital records via Web in an easily readable way, HTML is not a good choice. HTML formats how you present a Web page's data, and it is not designed to work with what that data represents.
The extensible Markup Language (XML) is used to support development of our technology by offering an open and flexible structure for creating and storing the
information about the objects in various formats. This is contrary to HTML and its rigid format [17]. By letting users define their own elements, XML enables them to structure a document, as they want it, without having to restructure their data to fit a predefined markup language. In order to advance the development of a unique standard for identifying, manipulating and integrating objects, devices and information on the Internet, a new language and a protocol are being developed at the time of this thesis.
One of the advantages of this new technology is its ubiquity and application to numerous industries. There are some technologies that are based on use of tags already. It is fair to assume that these technologies would use the standard in the future in order to become integrated.
2.2 Emerging Communications Technologies
Although not fully developed, there are some technologies that integrate the physical world to the Internet. Web controlled cameras, the NASA Sojurner robot, and Internet traffic control software are some common examples. However, this current technology does not have vision nor a broad and flexible technical base to fully take an advantage of opportunities that Internet offers. Some of the newer technologies that move closer to our vision are miniature data tracking and collecting devices from iButton and wireless Internet connection such as Bluetooth. These technologies are considered as some of the most related and by exploring their technical base and their reach it would be clear what are their limitations that could be surpasses with use of tag technology.
2.2.1 Wireless Internet Connection -Bluetooth
Bluetooth is the codename for a technology specification for small form factor, low-cost, short range radio link between mobile PCs, mobile phones and other portable devices. The Bluetooth Special Interest Group is an industry group consisting of leaders in the telecommunications and computing industries that are driving development of the technology and bringing it to market.
Bluetooth technology will enable users to connect a wide range of computing and
telecommunications devices easily and simply, without the need to buy, carry, or connect cables. It delivers opportunities for rapid ad hoc connections, and the possibility of
automatic, unconscious, connections between devices. It will virtually eliminate the need to purchase additional or proprietary cabling to connect individual devices. Because Bluetooth can be used for a variety of purposes, it will also potentially replace multiple cable connections via a single radio link.
This new technology is fabulous on the hardware side but it does not offer much on the protocol side that would integrate various devices with ease. The technology also
concentrates only on the information transmitted but not on the format of information nor the source and the destination of the information flow. It can not, for example, allow other devices that are not Bluetooth software and hardware compatible to transmit and receive information. This technology can not provide for tracking an inventory remotely unless each piece of the inventory is supplied with Bluetooth-like device, which is impractical to do because of the cost.
The tag technology will bridge the gap between fancy devices and very simple objects, such as inventory in storage or food products. Anything ranging from the ball bearings to the airplanes can be "tagged" and tracked down remotely.
2.2.2 Miniature Data Tracking Devices-iButton
The iButton is a 16mm computer chip housed in a stainless steel can. The iButton can be worn by a person or attached to an object for up-to-date information at the point of use. The steel button is rugged enough to withstand harsh outdoor environments; it is durable enough for a person to wear everyday on a digital accessory like a ring, key fob, wallet, watch, or badge.
There are a variety of buttons with different features. Each starts with a guaranteed-unique registration number engraved in the silicon. Some buttons add computer memory to store typed text or digitized photos; information can be updated as often as needed with a simple, momentary contact. Other buttons contain a real-time clock to track the number of hours a system is turned on for maintenance and warranty purposes; a temperature sensor for applications where spoilage is a concern, such as food transport; a transaction counter that allows the button to be used as a small change purse; or complete cryptographic circuitry to secure Internet transactions.
The fact that iButtons can be used to store data rises questions of possible security violation or data loss to the loss or destruction of the actual iButton device. One of the reasons the new tag technology would be so robust is that the information is not
necessarily stored on the actual tracking device, such as in the case of iButton, but rather distributed on the World Wide Web. WWW offers multiple layers of security and probability that the information can be lost is very small considering existence of mirror sites with duplicate of the same data. iButtons use software built by many different companies, using different standards. For this reason, the interchange of information can not be seamless.
2.3 Radio Frequency Identification (RFID) Technology
This thesis presents an existing novel language and protocol for describing physical objects [13]. The intention of this language is to facilitate the integration of physical
things - both natural and man-made - into the World Wide Web. This integration will be accomplished twofold: through telesensing and teleoperation, and through tagged
information on the objects.
The importance of this standard is clear when considering the diversity and
magnitude of industries that may be effected. Although Universal Product Codes (UPC) and Electronic Data Interchange (EDI) currently exist, they are relatively industry specific, and are geared primarily for the manufacturers, distributors, and retailers. The information that they provide is not inclusive because they do not, for example, include material safety data sheets (MSDS), service manuals, operating instructions, replacement parts, packaging geometry, mechanical characteristics, advertisements, expiration dates, shipping requirements, parts lists, service centers, manufacturing methods, etc.
2.4 Object Description Language (ODL)
A universal Object Description Language (ODL), which effectively bridges
industries and which is used by manufacturers, retailers, and customers, would be of great benefit for everyone [13]. The basic idea would be to mark objects with a Universal Identifier (UI), which references an ODL Web page. The ODL format would most likely be a derivative of the Extensible Markup Language (XML), or, perhaps, an
implementation of the Resource Description Framework (RDF).
It would be appropriate to have a language that can be sanctioned by a standards body (W3C, ISO). This is because ODL would have important for commerce,
manufacturing, retailers and customers. Although the actual implementation seems to be difficult to achieve, the commonality of physical entities and their general method of creation, distribution, and consumption, imply the possibility of a universal standard.
2.4.1 Simplicity and Ease of Use
New Object Description Language (ODL) should be very general, easily
extensible and widely used. ODL should be a base line for creating a rich standard that allows use by humans and machines. Making sure that both machines and humans can make use of the language, many different databases should be utilized to create a single ODL file, the idea that is very far reaching. Although it would be nice to have first ODL version very general, it is not as practical to do so. Much as the original Hypertext Markup Language (HTML) was simple but limited, the same is expected for the first implementation of the Object Description Language (ODL). This later approach will help generate interest and motivate users to recognize the language as a standard.
2.4.2 Physically Based Object Descriptions
The general approach for describing objects may be from a truly physical perspective; in other words, a description of the type and arrangement of atoms. One could describe object based on geometry, composite geometry, molecular composition and mechanical properties. Object descriptions of this type would be similar to the Virtual Reality Modeling Language (VRML), in which objects are represented as
Boolean combinations of basic and polyhedral solids. Surface properties, textures, lights, links, sounds, animation, and viewpoint, are added to these fundamental descriptions to enrich the visual appearance. Similarly, ODL would have rich information content.
2.4.3 User Based Object Descriptions
From a completely different perspective, object may be modeled as the
manufactures, retailers, and customers see them; that is, as product name, lot number, quantity, invoice, price, sales tax, weight, volume, size, related products, expiration data,
product usage, nutritional information, safety data, etc. This later description is more immediately useful to the makers and users of objects. The physically based object descriptions, however, may be needed for visualization and, perhaps, for use with automated equipment (automated inventory equipment and robotics, for example). The advantage of this physical object description is in its inherently clever way of object manipulation. If an object could "tell" a machine what to do with it, the efforts to produce better results in fields of synthetic vision and object recognition would be challenged.
2.4.4 Object Information Maintenance
Whatever approach is adopted, however, should be accessory to people who work with the information. The makers of shampoo should not be expected to produce
description data for their bottles. That job should be left to bottle manufacturer. On the other side, information on related products should be expected from the same
manufacturer (such as conditioners, hair sprays, dyes, baby shampoo, etc.),
advertisements, usage, ingredients, safety data, liquid volume, suggested retail price, local retailers, and, perhaps, pointers to the bottle manufacturer, which then contains geometry information on the bottle itself. Makers of food products may have ingredient
lists, such as "salt, corn syrup solids, sugar, monosodium glutamate, ... ,". These ingredients would point to generic information sites that describe them. These
manufactures would further be motivated to create links to recipe sites, which use their product, and, in turn, these would link to other food products.
2.4.5 Object Models
In addition to static information, objects may also have dynamic information or simulation models. The bacterial content of milk, moisture content of a plant, or surface wear on a machine, all depend on the characteristics of the object, as well as the operating
environment. These object models are critical for many classes of physical systems, and should be included in any object description language.
These simulation algorithms should be defined with sufficient detail to allow compatibility and consistency between disparate algorithms. For example, there should be clear distinction between models, which are continuous or discrete, statistical or
analytic, periodic, or event based, and elemental or aggregate. In addition to the general nature of the algorithm, significant detail for the input and output variables, value limits, stability, reliability, accuracy, etc. should also be provided. Further, providing
administrative data, such as author, date, organization, purpose, description, etc. should be possible. The object models should facilitate manual construction of simulation systems, while at the same time accommodating automated search engines. Eventually, that automatic construction of synthetic environment though intelligent acquisition and assembly of simulation components from the Internet is expected.
2.4.6 Active Objects
In the near future, Internet Devices, that is machines monitored and controlled from the Internet, may be the largest users of ODL files. ODL files would contain instructions on how the objects should be operated on by an automatic device. For example, an instant dinner may encode cooking instructions for microwave or convection
oven. Automobile subassemblies could encode handling instructions for both gantry and serial link robots. Providing these operating instructions for both human and machine could result in simpler and more efficient machines.
2.5 Electronic ID (EID)
The Universal Product Code (UPC) has for years provided a standard for
as embedded processors, radio frequency identification, infrared sensing, acoustic
recognition and direct imaging) now allow more information to be stored with each item. However, rather than storing extensive information with each object, it is more efficient to simply store a reference to an information resource. In other words, the Electronic Identification (EID) would contain a pointer to a Web page, which contains a complete
object description. In this way, large amounts of data, from multiple, disparate sources, could be linked to an object.
Although the full object description would be stored remotely, it is still
importance to contain some information directly on the object. This information may include the legacy UPC codes, product classification information, privacy and security data, individual object references, health and safety data, etc.
2.5.1 Bit count
The Universal Identifier must, at a minimum, uniquely identify every individual object. As a reference, the UPC code contains 12 digits: 6 for the manufacturer, 5 for the product, and 1 for parity. Since the UPC is a base 10 code, this implies a maximum of
106 manufacturers and 105 products -- certainly not enough to represent every object. As another reference, typical RFID systems encode more than 64 bits of data (of order 1019 possible identifiers) and 96 bits (0(28)) and 128 bits (0(38)) are common. This would certainly be sufficient to identify every manufactured object. Consider if we were to uniquely identify every square centimeter on the surface of the earth (including oceans), that we would need only 1019 identifiers.
In addition to uniquely identifying objects, the EID should include some information about the object -- particularly privacy and security data. It would also be extremely helpful to store some classification information, through which bit masking operations
could quickly determine some object characteristics. If this were the only consideration, the EID I would store the maximum number of bits possible. While this may be
technically feasible, increasing the number of bits on the object generally increases the cost and reduces the bandwidth in which the tag can be read.
2.6 Internet Machines
The Internet machines would be characterized by their intelligence being uploaded from the Internet. This uploading capability would make machines more flexible and easy to reconfigure. The Internet is becoming a host to many physical entities that use the Internet to communicate to other entities. A far reaching idea it is not, because there is already a movement at MIT to develop a new standard protocol and
language for object description and communication. Research that led to the idea of unique object identification using tags originated through work on robotics. Virtual reality environment for robots should allow for the robots to manipulate objects through remotely controlled interfaces. The problem with the approach is the cost and level of sophistication of current technology used to help in performing manipulation task. Vision algorithms and stereo vision techniques are both expensive and experimental and prove to put too much overhead to obtaining the cost effective solution for putting plain machinery to the Internet in massive quantities. If every 3 DOF robot would be required to have expensive object recognition tools for performing the simplest tasks such as moving objects in the space with ability to orient them successfully, than the cost of the manufacturing facility that would implement such a technology would be to great to allow implementation.
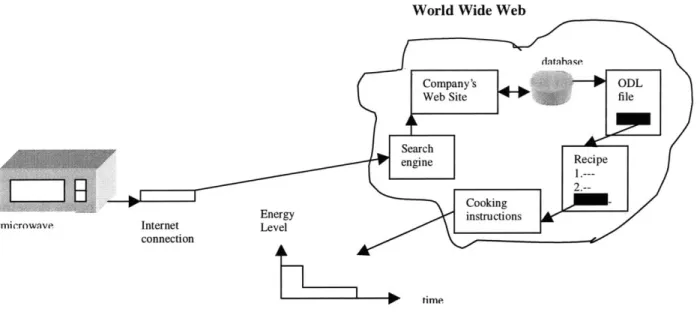
Imagine a microwave that cooks your dinner automatically. Microwave would use the tag to look up for dinner's ODL file on the web site of the company that produces it, extract from the file the instructions about the time to cook and the power level to use (low/medium/high) during the time interval, and finally set itself based on the
instructions. This application would be one of the simplest ones yet conveying a very powerful idea that passive objects could navigate devices and "tell" them what to do a concept not explored in depth in robotics research today. Tag technology could be
further combined with sensory technology to facilitate automatic ordering via web as well as preventive maintenance of various systems and devices. This thesis proposes the alternative to using expensive sensors to be cheap and miniature single bit-sensors. The reason is two-fold: reduced cost for sensors and increased measurement ability. This thesis quantifies the difference when using single-bit sensors as an alternative to high resolution sensors.
Some of the most immediate commercial applications that are being developed based on tag technology are Web kitchen of the future under DISC at MIT and automatic inventory control of beverages. The Web kitchen project proposes to build a kitchen where almost all the electrical appliances would be connected to the Internet and also to use tag readers for tracking kitchen inventory. All objects in the kitchen would have a tag attached to track their quantity, location and their quality. Tag readers and cheap force sensors would be distributed all around the kitchen. If instant meal was placed in the oven or microwave, tag attached to a meal box would point to ODL file that contains cooking instructions for microwave. Figure 2.1 shows how the basic components of the tag technology would work together. Frozen dinner could simply "tell" microwave how to cook it. Cooking instructions would come from the Web after the microwave has read the tag and use that tag to locate these instructions on the Web. The cooking instructions
World Wide Web
Energy
microwave Internet Level
connection
time
Figure 2.1: Instant dinner cooked by the microwave. Microwave uses cooking instructions from the World Wide Web.
Microwave processes related to tag technology
tag
Energy
Microwave Control Binaryencoder
source
L
J
=LunitFigure 2.2: Detailed information flow in the microwave.
Instant dinner
Web
Chapter 3
A Cost Optimal Model For Automated Inventory Management Using The World Wide Web
This chapter presents a cost effective and engineering approach to automated inventory management. One of the results of this chapter is an automatic inventory model based on the calculated dynamic demand. Calculating dynamic demand helps the actual estimate of reorder point to be more accurate. Two existing mathematical
components were implemented in this cost effective engineering approach. One is the Poisson or random process distribution analysis and other is profit analysis based on the
size of the order and the demand.
The motivation for developing the cost effective approach to inventory
management in this thesis was to reduce the inventory costs associated with holding cost and the cost of penalty of stockout [12]. Holding cost consists of such things as paying interest on the money invested in the goods in inventory, paying for housing the items and insuring them against fire and theft, the cost of obsolescence when the goods are in inventory are superseded by improved designs or they spoil or go out of style, etc. Although figures differ from one case to another, the average holding cost is in the range of 30-40% per year of the cost of the item. The cost of the stockout is associated with money lost due to the customer dissatisfaction or with the extra work needed to special order or backorder to try to keep customers satisfied. There are other costs associated with monetary penalties when a production must come to a halt because there is a shortage of a critical component.
The direct approach of balancing costs associated with inventory is cumbersome. Fortunately, there is another approach that does not depend on this potentially
complicated cost analysis and that is the engineering approach. Engineering approach looks at the inventory problem based on a feel for the problem. The approach involves a scientific reasoning independent of trends in the market, personal bias, various financial
interests from parties involved with the inventory management process, etc. In short, the engineering solution is robust and resilient to the human influence.
This chapter starts with introduction of demand as a random variable that can be modeled using Poisson process. Other variables of interest are the reorder point, t, and the quantity of items ordered, N. The expected profit is then calculated based on the given probability of demand not exceeding the supply as well as the expected demand (obtained from the previous experience). This economic analysis is used to determine the supply quantity every time the new order is placed. Further findings concentrate on determining the reorder point by calculating the probability of no stockout while using the dynamic or variable demand approach. The chapter than concludes with an algorithm that describes the entire automatic inventory process.
3.1 Assumptions and Constraints
In order to make the automated inventory management an attractive alternative to current methods of inventory control, the implementation cost has to be reasonably low, and the savings in implementing new technology should be much larger than the cost. The time savings obtained using this new approach should be greater compared to time savings using current technology. The tags that exist today are easy to attach, relatively low-cost compared to the objects they are attached to, easily readable remotely, durable, etc. The following are some assumptions to help in understanding of the results.
Assumptions
e The demand was assumed to be a random variable with a Poisson's distribution.
" The price for the item is always greater than the cost of the item (very important for implementing the cost model)
* The expected profit from the sales could be calculated using the expected value theorem
* The actual count of the inventory is known instantaneously (real-time sensing)
" Order for new supply is processed instantaneously after it is received (no time delay)
e Orders can be placed at any time (this does not guarantee that the supplier is going to be responsive at any time as well)
" Profit (S), Cost (C) and Salvage Value (V) are constant variables that are set by outside considerations (these values depend on particular business or industry)
e Probability of no stockout is kept constant and other variables are calculated based on this value
3.1.1 Economic Analysis and Dynamic Demand
Economic analysis underlying the decision about the size of the order to be made is known as a single period inventory control problem [12]. For example, an
entrepreneur selling Christmas trees has to decide in advance how many trees to stock so that she maximizes the profit in case that some of the trees remain unsold. The size of the order, N, is clearly dependent on the actual demand, D. The demand is obviously a random variable. The probability distribution of random variable D is by definition Poisson and calculated as
D(d)= d= 0,1,2,...;
d!
where
X = expected demand, X=E(D) d = demand
There is a good reason, both empirical and theoretical, for assuming the distribution is Poisson.
The economic analysis depends on the factors such as: cost per item for the entrepreneur, C, the price for the item, S, and the salvage value, V. These three constants are set by outside considerations. The profit for given demand D = d is calculated as
hd
{
Sd -CN +(N -d)V, O ! d < N,(S -C)N, d > N.
(3.2)
The expected value of the function h(X) of the random variable is by definition
tEh(xj)px(x,),
E[h( X )]=
f h(x)fx(x)dx,
dependent on whether X is discrete or continuous. Here h(x) is an arbitrary function; the only requirements are that it be a real function of a real variable and that the sum or integral converge absolutely.
Now, the expected profit is calculated using expected value theorem as follows
N N
E[h(D)] = Q(N) = (S -V) dpD (d) - N(C -V) PD (d) + N(S -C) 0 PD(d)
d=O d=O d=N+1
and Q(N) was used to emphasize the dependence on N, the order size, that is the parameter to be optimized. The optimum N is one that maximizes Q(N). To find the optimum we can, starting with N=0, increase N to N+1 to see if Q(N) is increased and continue to do so until there is no improvement.
AQ(N) = Q(N+1) -Q(N),
= (S - V)(N+ 1)pD (N+1)+ V[(N+l)pD (N +1)
+ Pr(D N)] + S[-NpD (N +1) + Pr(D > N + 1)] - C,
= (S - C) -(S -V)Pr(D N).
The result is the following expression which suggests that N is to be increased as long as
Pr(D!
- ) NS -C
Pr(D N)= PD(d) <
d=O
S-(3.4)
This inequality tells us that N should be picked as the smallest integer for which the inequality is not true anymore. Let's illustrate the use of this expression through an example. Let's assume that the demand, X, is X=5. Table 2.1 shows the distribution function for this particular case and was extracted from the table for the Poisson distribution in Appendix 1. Starting with C=$100 and S=$1000 assume that salvage value is V=0. Than, (S-C)/(S-V)=0.9; from the table it can be seen that the profit will be maximized if N=8 of the items are in the inventory.
Poisson Distribution Function for X = 5 d FD(d) 0 0.007 1 0.040 2 0.125 3 0.265 4 0.440 5 0.616 6 0.762 7 0.867 8 0.932 9 0.968 10 0.986
If there is an alternative market where V=$50 than (S-C)/(S-V)=0.9474 and N=9 is the optimum inventory.
3.1.2 Determining the Reorder Point
It is common practice in economics to model a problem of random demand using so-called two-bin system [18,19]. The two-bin system is characteristic for two distinct bins, bin P and bin S. Bin P is used to supply the customers until the last item from this bin is taken. After the last item was taken there are two things that happen: 1) shift to the
secondary bin, bin S, to respond to demand, and 2) order a new supply of the goods. The idea of the two-bin system is ubiquitous because it is so natural. The two-bin system here
is modified in this thesis to fit a to a single-bin system that is treated as the secondary bin, bin S. The reorder point is calculated as each item is taken from a single bin system
taking into consideration the risk associated with the probability of the stockout. The probability of the stockout is set voluntarily by a manager. The moment that this
probability falls below the threshold value determines the reorder point and at that point the new order is placed.
The elapsed time t between when the order is placed and when it is received is called the lead-time. If the demand during the lead-time is exactly g per unit time than the amount of stock m is calculated as m = gt. This stock is used up entirely during the lead-time. In real life, p is a random variable and the demand is modeled as Poisson process. Consider keeping gasoline in your automobile: the gas gauge showing fuel on "low" is reasonable operating rule to start looking to replenish the supply. Early models of one of the popular imported cars actually had two gas tanks, a main tank (bin P) and a reserve tank (bin S), and no gas gauge. The driver was expected to drive the car using its main tank until it ran out and then switch to the reserve tank; than, knowing that only a limited amount of gasoline remained in the reserve tank, the driver should think of replenishing the supply. Another example of using a two-bin concept is buying groceries and deciding if there is enough groceries of type A to last until the next time you decide
to go shopping. The name for the point when the action is taken is called the reorder point.
A very important protection against stockout is called the safety stock. The safety stock is the amount by which the m (m = p t) exceeds the average demand
safety stock = ss = m - gt. (3.5)
There are two possibilities to consider in choosing m. One, if m smaller than the average demand, p , the safety stock will vanish before the lead-time has elapsed. The penalty of running out of items during a lead-time ranges from a minor problem to a major one. The affect of stock out should be reduced to money terms in order to compare it with the
situation when there is left over product in stock. Left over products can induce inventory carrying costs. The cost associated with the stock out can come from the monetary value placed on the disappointment of a customer, cost of special order or backorder to try to keep the customer happy and/or monetary penalties associated with halting the production facility because there was a shortage of some critical part.
It is evident that the cost analysis can be very complicated and overbearing. Another approach to finding the right quantity of goods for protection against stockout is the engineering approach. This approach assumes that given the initial number of items in stock, N, the next thing to do is to calculate the reorder point, t, at which the new
quantity of items is ordered. The assumption made before should be emphasized again: the entire bin is modeled the same way as the secondary bin, bin S. The probability of using up bin S Po(t) is calculated as in equation 3.6 [12].
j=m
)-(3.6) where
j
= the number of items removed from the inventorym= the safety stock, or equivalently, m = N and
j
mEquation 3.6 says that the probability of the stockout is equal to the probability that the demand,
j,
is greater or equal the number of items in stock, m. The demand in this case could be any number greater than or equal to m, which is shown as a sum in equation 3.6.If the demand during the lead time is satisfied, than technically there is no
unsatisfied demand. The actual probability of the stockout would therefore be calculated as
P, (, )=m+
-It is easy now to calculate the probability of no stockout as
( plr ) e-'u
Pr(no stockout) = 1- P, (r) = P0(r ) = I
(3.7)
where
= average demand in items per time unit t = reorder point in time units
m = number of items at the reorder point
It would be useful if the probability of no stock out is chosen in advance so lets assume further that this is known. Now that the Pr(no stock out) is known, the average demand can be calculated as inventory is decreasing. The lead time is usually fixed since it measures the time it takes to send and receive message and the time needed to transport the merchandise to the desired location and both of these intervals can be assumed to be constant over time. The initial demand, or so called expected demand X = E(D) is used for initial value of average demand, g. Later demands are calculated dynamically. For all practical purposes, t is usually given in some integer units of time such as hours or
days and less often in minutes or seconds, but theoretically any time unit could be used. Equation 3.6 can be written as
_ 7/p (vp) ____ ____4n
Pr(no stock out) = e "[ + + ++ ]
1 2! 3! M!
(3.8)
Iterating R to satisfy the equation 3.7 is done each time the inventory count decreases by one, or in some cases by more than one if one customer purchases more than one item, or
different customers purchase items at the same time. Once the right hand side of equation 3.7 falls below the value on the left-hand side, than the new order is placed.
This assures that the probability of no stock out is kept constant as one of the important objectives.
3.1.3 Calculation of the Dynamic Demand Rate
The reason for using dynamic demand rate is the fact that demand rate changes unpredictably in most of the situations and therefore it is not always correct to assume that the demand is constant. A good example is selling newspapers. Demand for news is higher when there is a very interesting issue publicized but other than that the quantity of newspaper produced is estimated based on statistical analysis of average demand for newspaper per day. The inventory model based on an average demand would not be capable to adjust to a change in the demand quickly. This is true because the model for the demand should be developed based on another statistical analysis and that analysis would by nature take more time to produce a new demand rate since involves data collecting process from various newspaper distributors. However, the inventory model based on assumption of a dynamic demand is well prepared to address the changes in demand and order bigger supply if the demand suddenly increases with already predetermined probability of no stockout.
The dynamic demand rate is calculated as follows:
(j - l)U(m) +
--/I(MAt .
(3.9) where
j
= 1,2, ... , m.1
p(m)=
Ati
where g(m) = demand rate at the time when the m-th item was removed from the inventory
Ati = the time passed prior to first element being removed
From equation 3.8 demand rate is independent of reorder point, t. The variable
j
has a random distribution and represents the items withdrawn from the inventory at time tj. The inventory starts with m items. Each time an item is taken out the inventory, the timeinterval Atj is measured using the equation = tj - tj-1. Figure 3.1 shows how the actual demand is calculated.
Niirmher nf themq sold
rn-5--- At6 -Mn-4--- --- ---At5 tim 11m At2 t3 t4 -5
Figure 3.1: Time intervals used in calculating the dynamic demand
Averaging demand is a natural way to go about this because averaging helps reduce the probability of ordering items prematurely. Premature ordering could be caused by the sudden increase in demand in a short period of time. If not averaged over a long period
of time, this increase in the demand would appear to be the actual demand. An example to support this idea could be found in situation where a user buys a large quantity in a short period of time (bulk). If the inventory ordering system is too sensitive to this sudden impulse of demand and it is not taking the overall demand frequency into consideration, it could start ordering new items long before the old supply got off the shelves. In the best case scenario, at the time the new order comes in there will be
shortage of storage space to place the items and that could make a part of the order to be returned and penalties to be paid.
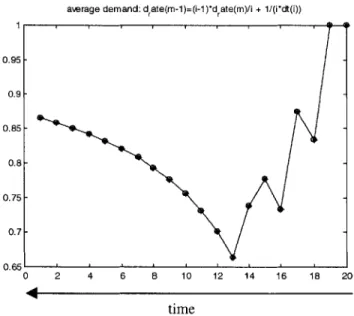
The plot for demand rate, g, is shown on Figure 3.2. Unit for demand is
[items/time] = (1/time unit). Note sharp changes in demand. These changes are actual corrections due to the averaging mode of estimating the demand. The curve for the demand really depends on the actual situation and Figure 3.2 is not a typical curve.
average demand: drate(m-1)=(i-1)*dr ate(m)/i + 1/(i*dt(i))
0 2 4 6 8 10 12 14 16 18 20
time
Figure 3.2: Demand rate calculated as the inventory changes.
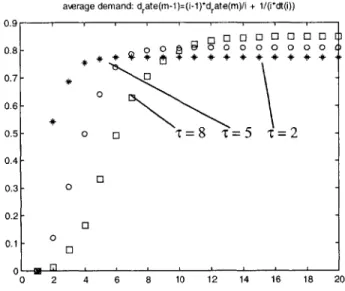
awerage demand: drate(m-1)=(i-1)*drate(m)/i + 1/(i*dt(i)) 0.9 -0.8 - o = 8 = 0 =-0.48- -0.7 - -0 0.6-0.5- 0 0 T=8 c=t= 0.4 0.3- 0 0.2-0 0.1 0 0 2 4 6 8 10 12 14 16 18 20
Figure 3.3: Probability distribution for no stockout. Stock count is m = 20, the demand rate varies and is calculated as an average.
From Figure 3.3, for t = 2 probability of no stock out is below 0.8. If 0.8 was the cutoff value of Probability(no stockout), than the lead time should be adjusted to bring Pr(no stock out) 0.8. Note that the highest number on horizontal axis equals 20, which
corresponds to the beginning of the process where the stock is full just before the demand starts. For t = 5, the new order should be placed when the inventory falls below 8 items. At that point, the Pr (no stock out) < 0.8. For t = 8, the new order should be placed when the inventory falls below 10 items. The conclusion is that the longer the leading time the greater the probability that items will be run out of stock. This is logical because the greater the lead time, the greater probability that someone will be demanding items in
from a stock.
3.1.4 Automatic Inventory Process via World Wide Web
After laying out the necessary theoretical framework, the automatic inventory management can be implemented. The overall process can be represented using figure 2.1. Note that placing the new order must be done using the Internet.
The process starts with setting the expected demand to be the current demand. The current demand is used to calculate the number of items, m, needed to make the greatest profit. Once m is found, a new order is placed (via the Internet). The process loops in place until the new order arrives. After the order is in, the probability of no stockout is chosen and set as a constant. The actual probability of no stockout, based on m, t and g, is than calculated and compared to the constant value set earlier. If the actual probability is smaller than the constant value, than the expected demand is calculated based on the current demand and the model of demand that includes demand history. Than the cycle is repeated. If the actual probability is greater or equal than the constant
value, than the number of items in stock is updated. Given the updated number of items in stock, the dynamic demand is calculated. With new value for the dynamic demand, the process is returned to the point of calculating probability of no stockout. This concludes the entire process.
Model of demand that includes demand
history used for estimating the expected demand X = E(D) no no yes (j -1)p(m)+At yes At
3.2 Chapter Summary
This chapter developed a cost effective engineering approach to inventory management. In doing so, the probability of no stockout was set by a user and used as a constant to calculate the reorder point. The demand was assumed to be dynamic. Once the reorder point was determined, the actual quantity to order was calculated based on the
optimal profit model. At the conclusion of this chapter, some graphical data were shown and also the algorithm used to implement the process is demonstrated.
Chapter 4
Efficient Sensor Configuration for Resource Measurement Over The World Wide Web
The result of this chapter shows explicitly how many single-bit sensors are needed to replace the higher-resolution sensor achieving the same or better reliability. The common denominator used to compare the single-bit sensors with the higher resolution sensors was the reliability of the sensory measurement.
Automating the inventory management system using only tags attached to objects would not suffice for some classes of inventory such as fluids and particles because fluids
and particles are measured in continuous values. For example, a milk carton with a tag could be useful when the empty gallon is thrown out so that the automatic inventory
system detects that milk is missing from a refrigerator and orders a new supply. The problem with this approach is that it takes time to replenish the milk supply and in the
meantime milk is still needed. One way of solving this problem is to have a sensor that could tell the amount of milk left in a gallon and send that data to the automatic inventory management system. This way the order of milk could be placed while there is still some milk left in that gallon. By the time the entire gallon of milk is used, the new gallon comes in. The sensor that measures the quantity of milk should be very cheap relative to the price of milk. This brings a new way of thinking about sensors. The trade off to producing a very low cost sensor would be very low resolution because resolution is proportional to the price.
Besides low resolution, cheap sensors should be fairly small and light to attach it to the milk gallon or other consumer products. Smaller components are more expensive because they require more precision. Should the resolution remain the same while shrinking the size of a sensor its price would automatically jump up. An example of extremely cheap and small sensor would have only one bit of resolution and would be easily attachable to many different surfaces due to its size and design.
4.1 Sensor Substitution
The results of this chapter convey that when the high resolution sensors have a low reliability it would be better to replace them with low resolution sensors. That can improve their reliability and decrease the cost. For higher reliability, high resolution sensors the replacement is not the best solution. The following assumptions were made in solving this problem:
e Sensor measurements are independent
e Reliability of two bit sensor is R
" All the single bit sensors are equally reliable, r = rl = r2 = r3
* There is always greater number of good sensors than the bad ones
The relation between reliability and number of sensors is developed based on comparisons made to determine advantages and disadvantages of having one high-resolution sensor versus many low-high-resolution sensors. Sensor substitution was applied to measure fuel level in a tank.
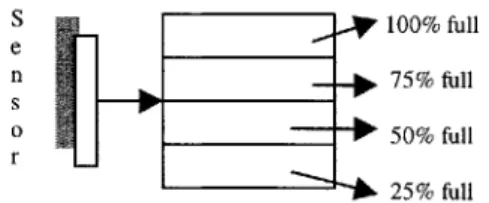
Example: Fuel Measurement
Suppose in Figure 5.1 we had a 2-bit sensor, which measures four different fuel levels. S e n S 0 r 100% full 75% full 50% full 25% full


![Figure 4.4: Solution space for R = [0,1] and #sensors = [1,10]](https://thumb-eu.123doks.com/thumbv2/123doknet/14504193.528432/56.918.196.805.635.1011/figure-solution-space-r-sensors.webp)
![[PDF] Le langage XHTML cours pdf](data:image/gif;base64,R0lGODlhAQABAIAAAP///wAAACH5BAEAAAAALAAAAAABAAEAAAICRAEAOw==)