Journal of Physics: Conference Series
PAPER • OPEN ACCESS
Experimental analysis of the wake dynamics of a
modelled wind turbine during yaw manoeuvres
To cite this article: S Macrì et al 2018 J. Phys.: Conf. Ser. 1037 072035
View the article online for updates and enhancements.
Related content
Validation of large-eddy simulation of scaled waked wind turbines in different yaw misalignment conditions
C Wang, J Wang, F Campagnolo et al.
-Wake Conference 2015
Andrew Barney, Jens Nørkær Sørensen and Stefan Ivanell
-Actuator Line Method Simulations for the Analysis of Wind Turbine Wakes Acting on Helicopters
Manuel Bühler, Pascal Weihing, Levin Klein et al.
1234567890 ‘’“”
The Science of Making Torque from Wind (TORQUE 2018) IOP Publishing
IOP Conf. Series: Journal of Physics: Conf. Series 1037 (2018) 072035 doi :10.1088/1742-6596/1037/7/072035
Experimental analysis of the wake dynamics of a modelled
wind turbine during yaw manoeuvres
S Macrì1, O Coupiac2, N Girard2, A Leroy1, S Aubrun3,
1Univ. Orléans, INSA-CVL, PRISME EA4229, 45072 Orléans, France
2Engie Green, Le Monolithe, 59 rue Denuzière, 69285 Lyon Cedex 002, France 3Ecole Centrale de Nantes, LHEEA, 1 rue de la Noë, 44321 Nantes, France
E-mail: stefano.macri@univ-orleans.fr
Abstract. This work focuses on the dynamic analysis of a modelled wind turbine wake during
yaw manoeuvres. Indeed, in the context of wind farm control, misalignment of wind turbines is envisaged as a solution to reduce wind turbine wake interactions, by skewing the wake trajectory. To optimize the control strategies, the aerodynamic response of the wake to this type of yaw manoeuvres, as well as the global load response of the rotor disc of the downstream wind turbine, must be quantified. As a first approach, the identification of the overall system is performed through wind tunnel experiments, using a rotor model based on the actuator disc concept. A misalignment scenario of the upstream wind turbine model is imposed and the wind turbine wake deflection is dynamically captured and measured by the use of Particle Imaging Velocimetry.
1. Introduction and work objectives
This work focuses on the analysis of dynamic wind turbine misalignment. Generally this condition is considered as undesired (lack of the control system or fast variation of the wind direction) but voluntary misalignment could be also used to improve the overall wind farm power yield. The wind farm configuration always shows a compromise between a minimal distance between wind turbines to increase the number of generators for a given area and a maximal distance between wind turbines to reduce the production loss due to wake interactions. Farm control is becoming always more crucial in wind energy and voluntary misalignment is one of the strategies being investigated [1-3]. Indeed, the appropriate misalignment of a wind turbine can improve the rate of production and the lifetime of the downstream one. Applying this solution though needs a better comprehension of the consequences of this kind of maneuvers in terms of wake interactions. The present paper illustrates an experimental modelling of the misalignment process. This operation was reproduced in a wind tunnel under static and dynamic variations of the yaw angle and its effects in term of wake deviation at a fixed downstream distance were investigated. Based on an aerodynamic approach, this work aims to isolate and to investigate the wake deviation due to the yaw misalignment of a rotor disc. Homogenous flow conditions and a rotor model based on disc actuator concept were chosen for the first steps of the study. The static wake deviation due to a static yaw angle is studied for different wind speeds, and then the dynamic wake deviation is analyzed during yaw maneuvers.
2
1234567890 ‘’“”
The Science of Making Torque from Wind (TORQUE 2018) IOP Publishing
IOP Conf. Series: Journal of Physics: Conf. Series 1037 (2018) 072035 doi :10.1088/1742-6596/1037/7/072035
2. Approach and methods
The condition of dynamic misalignment is reproduced in the Eiffel-type wind tunnel at PRISME laboratory by generating a homogenous and isotropic turbulent flow (HIT). The squared test section of the wind tunnel has a width and a height of 0.5 m and a length of 2 m. The turbulence is generated by a grid at the end of the convergent. The experiments were performed under HIT conditions. Even if this kind of inflow is not realistic (wind turbines are immersed in an atmospheric boundary layer characterized by a turbulent shear flow) this idealized inflow was chosen in order to study the effect on the wake of dynamic misalignment independently of any other sources of wake distortion. Based on the actuator disc concept, broadly used in literature [4-7], the models of wind turbines used in this work are 0.1 m diameter porous discs. The disc porosity is defined as the ratio of the empty surface to the total surface of the disc. Two different porosities are compared in order to evaluate the influence of the induction factor in dynamic misalignment. The disc is located at the center of the test section. The model of the upstream wind turbine is placed at x=0.5 m downstream of the turbulence grid. The turbulence intensity of the freestream flow measured at the upstream disc location is about 4.8% while at the downstream location is about 4%.
The influence of the misalignment on the wake is studied at 3.5 diameters downstream of the disc by the use of stereo Particle Image Velocimetry (Stereo PIV 2D-3C) (Fig.1).
Figure 1: Experimental configuration
The PIV system consists of a Nd: Yag laser Evergreen 200 (2 x 200 mJ) emitting pulse with wavelength 532 mm, and 2.5 Hz emission rate for non-synchronized acquisition. The light sheet is oriented in order to cross transversally the test section 3.5 diameters downstream of the wind turbine model. Seeding particles are micro-sized olive oil droplets sprayed by a PIVTEC seeding system. Images are acquired with two LaVision Imager LX cameras (4032 px × 2688 px) and a 105 mm lens equipped with 532 nm wavelength filter. The time delay between the both images is set according to the three different wind speeds treated 3-6-12 m/s at 210 µs, 105 µs and 52 µs, respectively. The final resolution is one vector every 1.7167 mm with a multi pass decreasing size (64 px × 64 px, 32 px × 32 px) interrogation window with an overlap of 50%. 3C velocity reconstruction by combination of images from both cameras gives a trapezoidal 2D field of (base 1=0.3 m, base 2=0.2 m, height=0.2 m). For the static conditions 1,000 image pairs are recorded, in order to compute the ensemble-averaged velocity statistics. For dynamic configurations, conditional averages are performed according to the
1234567890 ‘’“”
The Science of Making Torque from Wind (TORQUE 2018) IOP Publishing
IOP Conf. Series: Journal of Physics: Conf. Series 1037 (2018) 072035 doi :10.1088/1742-6596/1037/7/072035
time delay after the start of the yaw manoeuver. About 250 images are therefore recorded for each time delay.
According to Benedict and Gould [8], uncertainty estimation can be done assuming that the wind speed fluctuations follow a normal law. In this way, it is possible to define the uncertainty of the mean wind speed ε𝑢 and of its standard deviation εσ
ε𝑢= Z.Iu √𝑁𝑏 (1) εσ= Z √2𝑁𝑏 (2)
Where Z corresponds to the confidence interval applied to the relative precision (eg Z=1.96 for confidence interval of 95%), Nb is the number of averaged images, Iu is the turbulence intensity. Assuming with a conservative approach Nb=220 and a maximal turbulence intensity Iu=12% measured in the wake region, the relative precisions on wind speed and standard deviation are:
εu≃ 1.58% εσ≃ 9.3%
These experiments have been designed taking as a reference a wind turbine of 80 m of diameter, a yaw variation of 30° in 60s (0.5 °/s speed) and a wind speed of 12 m/s. According to this full scale conditions, the yaw variation takes 9𝜏₀, where 𝜏₀ is the aerodynamic time scale based on the inflow velocity and disc diameter (𝜏₀ = 𝐷
𝑈∞). So wind tunnel experiments, corresponding to a reduction scale
of 1:800, are performed taking into account this similarity law.
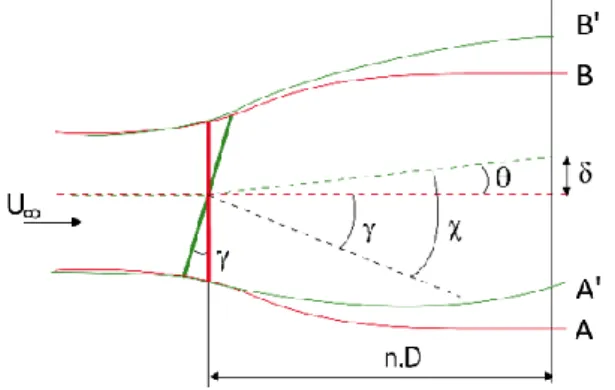
The yaw variation was investigated by analyzing the wake deviation angle θ at different time steps of the misalignment process. The angle θ is obtained by the difference between the skew angle χ and the yaw angle γ (Fig.2).
Figure 2: Representation of the skew angle χ, the yaw angle γ and the deviation angle θ. (n.D = number of diameters downstream of the wind turbine)
Stereo PIV measurements provided 3 wind speed fields each one normalized with the freestream velocity 𝑈∞ . In order to assess the wake deviation, the method used by Parkin et al. [9] is applied to the averaged wind speed profiles. The edges of the wake are defined as the local wind velocity U is lower than 96% of the freestream velocity 𝑈∞. Then the wake deviation is calculated by the estimation
of the distance δ between the position of the middle of the segment [AB] in the case of γ=0° and the position of the middle of the segment [A'B'] in the misaligned case in exam. The deviation δ is then calculated along a crosswise one dimensional speed profile at the middle of the wake. The skew angle θ is then obtained through geometrical considerations:
4
1234567890 ‘’“”
The Science of Making Torque from Wind (TORQUE 2018) IOP Publishing
IOP Conf. Series: Journal of Physics: Conf. Series 1037 (2018) 072035 doi :10.1088/1742-6596/1037/7/072035
θ = arctan ( δ
𝑛.𝐷) (3)
According to the vector resolution of 1.7167 mm (δ resolution) and the way how the wake deviation θ is determined, it is possible to assess a measurement uncertainty on wake deviation measurements of θ=±0.28°.
3. Static misalignment results
In this section the results of the static misalignment will be presented for three freestream flow conditions and for two disc porosities (Tab.1). Measurement performed at yaw angles between 0° and 30° by step of 10° are shown. The induction factor, is estimated for yaw = 0° condition by the relation:
a=1
2(1 − 𝑈𝑤𝑎𝑘𝑒
𝑈∞ ) (4)
This assumption is applicable because in the region of the PIV measurements (3.5 D downstream) the pressure has already recovered to the atmospheric value as shown in [10].
The parameter Δθ
𝛥𝛾 represents the slope of the curve θ = f(γ) for γ between 10° and 20°. This criterion
was chosen to compare static with dynamic configurations presented in this work.
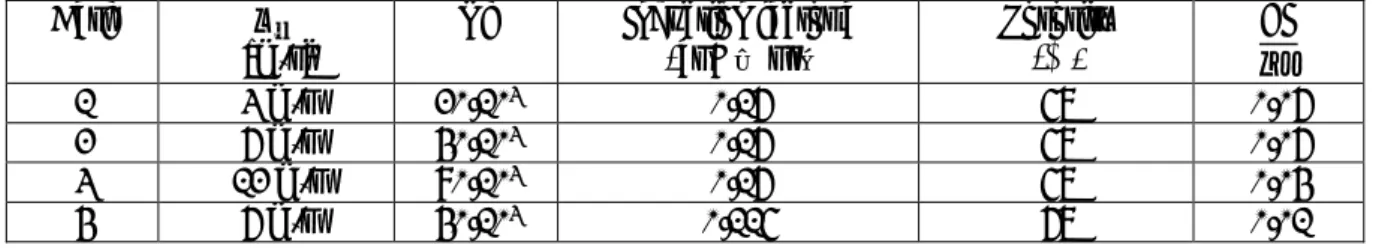
Case 𝑈∞ [m/s] Re Induction factor a (at γ = 0°) Porosity (%) Δθ 𝛥𝛾 1 3 m/s 20.103 0.16 57 0.06 2 6 m/s 40.103 0.16 57 0.06 3 12 m/s 80.103 0.16 57 0.04 4 6 m/s 40.103 0.115 67 0.01
Tab 1: Configurations for static misalignment
Figure 3 shows the time averaged streamwise velocity fields for the static case 2 without misalignment and with a 30° static misalignment. In the misalignment configuration, an asymmetry in the field is visible. The streamwise velocity deficit is skewed in the opposite direction to the yaw misalignment. In the aligned configuration, slight counter-rotating vortical structures are visible in the region of interaction between the disc and the mast model. In the misaligned configuration these structures are also skewed. This distribution could suggest that the wake flow will evolve further downstream towards the typical kidney shape velocity distribution associated to two counter-rotating vortical structures as observed by Howland et al.[11] using a drag disc model, and by Bastankhah and Porté-Agel [6] using a rotating turbine model as well. For the sake of brevity only one example is shown, but the same asymmetry was found for the other cases.
1234567890 ‘’“”
The Science of Making Torque from Wind (TORQUE 2018) IOP Publishing
IOP Conf. Series: Journal of Physics: Conf. Series 1037 (2018) 072035 doi :10.1088/1742-6596/1037/7/072035
Figure 3: Streamwise velocity field and normal velocity vectors (for γ=0° (left), γ=30° (right)). Static case 2, the black line represents the disc area projection. To better identify the vectors on the
graphs, the vector mesh resolution is 1/3 of the actual field mesh resolution.
The experimental results for the deviation angle θ due to a static misalignment are also compared with the misalignment predicted by the theoretical law (θ = 0.6𝑎γ)[12].Knowing the induction factor, it is possible to assess the deviation angle due to an imposed misalignment. This comparison is shown in figure 4.
Figure 4: Deviation angle θ in function of the yaw angle γ downstream of the disc (x/D = 3.5). Taking into account the measurement uncertainty, it is reasonable to assume that there is no Reynolds dependency of the results. Focusing on the first three cases with the same induction factor but different Re, the discrepancies between them are lower than the uncertainty. Though it must be noticed a difference between the theoretical law and the experimental results. Indeed, the experimental results
6
1234567890 ‘’“”
The Science of Making Torque from Wind (TORQUE 2018) IOP Publishing
IOP Conf. Series: Journal of Physics: Conf. Series 1037 (2018) 072035 doi :10.1088/1742-6596/1037/7/072035
seem to have a nonlinear dependence between θ and γ. This discrepancy was already found by Parkin et al.[9]. Moreover Espana [13] shows that the turbulence intensity has a relevant role in that condition together with the downstream location. Indeed, while increasing the turbulence intensity (keeping constant the other conditions), the discrepancy between the theoretical law and the experimental results increases. The same trend is visible just increasing the downstream location of the measurements.The wake deviation angle θ can be predicted by the use of wake deviation models. In figure 4 the experimental results are also compared with the wake deviation model defined by Jimenez et Al. [14]. θ =cos 2γsinγ 𝐶𝑡 2 (1+𝛽𝑥 𝐷) 2 (5)
This model shows a nonlinear behavior of the wake deviation angle that seems to be more in agreement with the experimental results.
In this model the deviation angle is dependent on thrust coefficient 𝐶𝑡 (at γ = 0°), the yaw angle, the distance from the wind turbine x and the diameter D, while 𝛽 is a tunable parameter with a range of values between 0.09 and 0.125 (here 0.125 fits the best). To compare the experimental results to that model, it was chosen to assess the thrust coefficient using the global momentum theory as in [10,15]. For cases 1-3, it was found a 𝐶𝑡 of 0.47 while for case 4, 𝐶𝑡 is 0.33. Using the theoretical law obtained
with the actuator disk concept 𝐶𝑡=4a(1-a) considering the induction factor as in eq. 4, the 𝐶𝑡 are respectively 0.54 for cases 1-3 and 0.40 for case 4. The discrepancy between the two methods is on the same order of magnitude as values reported in a previous work [15].
4. Dynamic misalignment results
The aerodynamic time scale τ₀, has been chosen as time reference for the dynamic misalignment analysis. Knowing that the yaw maneuver will take 9𝜏₀, acquisition time has been set to 15τ₀ in order to have the necessary lag to take into account the advection delay. Due to the measurement technique (no time-resolved PIV), it is not possible to have a continuous measure of the deviation process, but just a discrete measure of the skew angle at chosen time steps, through a synchronized acquisition. To evaluate the wake deviation dynamics over different cases (summarized in Table 2), an investigation protocol and specific metrics were defined. It was chosen to estimate the slope 𝑑θ
𝑑𝜏 by a linear fitting of
the discrete measurements in the region where this gradient is maximal. When the time resolution is not sufficient to clearly identify the beginning and the end of the phenomenon, the start 𝜏𝑠𝑡𝑎𝑟𝑡∗ =
𝜏𝑠𝑡𝑎𝑟𝑡
𝜏₀ and the end 𝜏𝑒𝑛𝑑
∗ = 𝜏𝑒𝑛𝑑
𝜏₀ of the wake deviation are assessed crossing the curve determined by
the linear fitting with the static value of θ for γ = 0° (no misalignment) and γ =30° (maximal misalignment). With the same method, the start 𝜏𝑠𝑡𝑎𝑟𝑡_𝑚∗ and the end 𝜏
𝑒𝑛𝑑_𝑚∗ of the disc motion were
determined, in order to assess the effective motion duration 𝜏𝑚∗ (difference between the two
parameters) of 9. To compare 𝜏𝑚∗ with the duration of the wake deviation phenomenon their ratio is
calculated 𝜏𝑟𝑎𝑡𝑖𝑜∗ =𝜏𝑒𝑛𝑑∗ −𝜏𝑠𝑡𝑎𝑟𝑡∗ 𝜏m∗ .
The ratio Δθ
𝛥𝛾 has been calculated for values in the region of maximal wake deviation variation that
generally is in the interval γ=10°-20°. This ratio was also calculated for the static configurations, in the same angle range.
1234567890 ‘’“”
The Science of Making Torque from Wind (TORQUE 2018) IOP Publishing
IOP Conf. Series: Journal of Physics: Conf. Series 1037 (2018) 072035 doi :10.1088/1742-6596/1037/7/072035
Case 𝑈∞ [m/s] Re Induction factor a (γ = 0°) Porosity (%) Yaw variation 𝑑θ 𝑑𝜏 [°/s] 𝜏𝑠𝑡𝑎𝑟𝑡∗ 𝜏𝑒𝑛𝑑∗ 𝜏𝑟𝑎𝑡𝑖𝑜∗ Δθ 𝛥𝛾 5 3 20.103 0.16 57 Increment 0,27 4.6 11.3 0.74 0.08 6 6 40.103 0.16 57 Increment 0,19 3.2 11.5 0.92 0.07 7 6 40.103 0.16 57 Decrement -0,2 5.2 13.5 0.92 -0.08 8 6 40.103 0.115 67 Increment 0,18 4.2 12.7 0.94 0.06 9 6 40.103 0.115 67 Decrement -0,2 5.89 13.66 0.86 -0.08
Tab 2: Dynamic cases
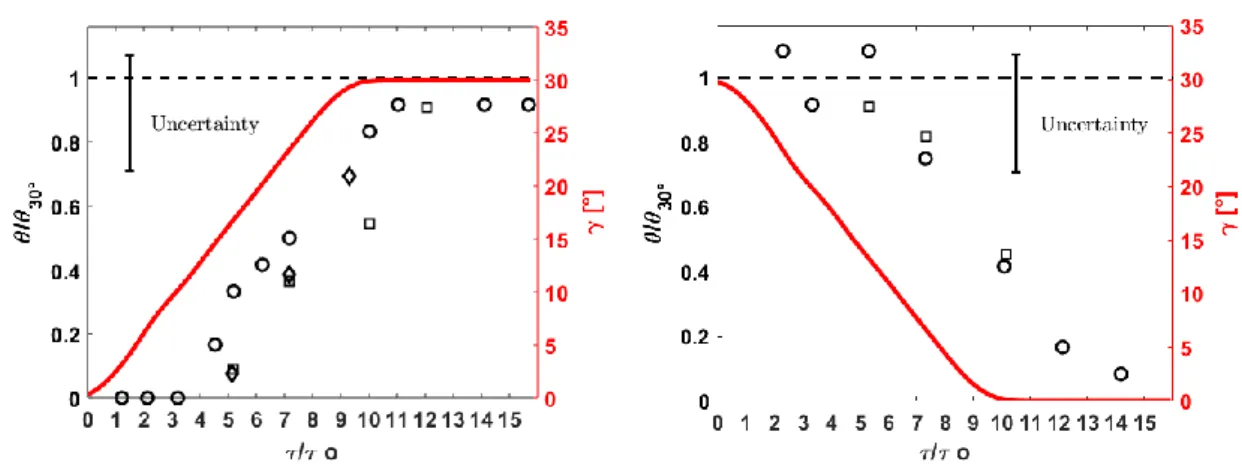
Figure 5 shows the results obtained for a dynamic misalignment variation of 30°.
Figure 5: Time evolution of θ (dots) and γ (lines) downstream of the disc (x/D = 3.5) during a dynamic yaw variation. On the right yaw increment is represented, on the left yaw decrease. Symbols:
circle case 6&7, square case 8&9, diamond case 5, dashed lines represent θ value for a static 30° yaw angle γ.
Comparing the slope 𝑑θ
𝑑𝜏, it is reasonable to assume that there are not significant differences in absolute
slope according to the kind of maneuver and the induction factor, giving an average of 0.19. Case 5 presents a slightly difference in slope according to the others, but this is probably due to the fact that this 𝑈∞ is close to the low limit of the wind tunnel usability range. Moreover having 𝜏𝑟𝑎𝑡𝑖𝑜∗ generally close to 1, the phenomenon can be considered as quasi-static. On the other hand, a
comparison between the Δθ
Δ𝛾 was done in the case of both static and dynamic maneuvers and it was
found that this ratio is generally higher in the dynamic configurations. So, although the difference in duration is not remarkable, the wake deviation process changes in presence of dynamic conditions. Results give evidence of an asymmetry in the dynamic misalignment variation. Indeed, regarding the parameters 𝜏𝑠𝑡𝑎𝑟𝑡∗ and 𝜏
𝑒𝑛𝑑∗ , it was found that the wake deviation angle in the cases of dynamic yaw
increment establishes faster than in the case of yaw decrease. On average there is a delay of 2𝜏₀ between the increment and decrement yaw configurations.
These results illustrate the presence of a hysteresis in the wake response related to the direction of the disc movement. Furthermore the presence of different delays between the start of the yaw maneuver and the start of the wake deviation phenomena suggest that advection time is not the only cause of that lag. If it was only related to the advection time, the delay would be the same independent of the kind of maneuver. Indeed if the advection time is calculated either by assuming the external streamwise velocity 𝑈∞ as reference speed Uadvection or by assuming as reference speed the average between 𝑈∞
8
1234567890 ‘’“”
The Science of Making Torque from Wind (TORQUE 2018) IOP Publishing
IOP Conf. Series: Journal of Physics: Conf. Series 1037 (2018) 072035 doi :10.1088/1742-6596/1037/7/072035
and Uwake (streamwise velocity in the wake), a dependence between yaw maneuver and advection time
is not supposed to be found. The difference between the two methods is just the influence of the induction factor in the second one. Using the first method an advection time (normalized by 𝜏₀) of 𝜏𝑎𝑑𝑣𝑒𝑐1∗ = 3.47 was found while using the second one 𝜏𝑎𝑑𝑣𝑒𝑐2∗ 𝑙𝑜𝑤 = 4.1 and 𝜏𝑎𝑑𝑣𝑒𝑐2∗ ℎ𝑖𝑔ℎ = 3.9,
depending on the porosity, were found. So it highlights a delay between the start of the maneuver and the start of the wake deviation. Taking into account of the measurement limitation, the comparison between the assessed 𝜏𝑠𝑡𝑎𝑟𝑡 ∗ and the advection time seems to suggest other phenomena, besides the
advection time, causing this delay, especially in the case of yaw decreasing. 5. Conclusions
An experimental set-up in wind tunnel has been designed to study the aerodynamic response of a modelled wind turbine wake when subjected to misalignment/realignment scenarii. Although only a preliminary study of a complex phenomenon and despite the technical limit imposed by time and spatial resolutions of the measurement system, promising results were found. The flow impacting the downstream wind turbine consequent to a static yaw variation was investigated in three flow
conditions excluding the Reynolds dependence of the results. Dynamic yaw manoeuvres were reproduced for different flow conditions and disc porosities. According to the results, wake deviation is supposed to have a quasi-static behaviour, although yaw manoeuvres seem to influence the wake deviation evolution. A hysteresis in the wake response depending on yaw manoeuvres was found introducing the hypothesis of the influence of other factors beyond the advection time to the delay between the yaw manoeuvre and the wake deviation, especially in the yaw decrease configurations. Dynamic forcing of the yawed turbine could be a cause of the hysteresis, indeed, the induced velocity through the disc will respond slowly to the changing yaw angle because of mass conservation, but this consideration has to be verified in further works.
To pursue a more detailed analysis of the studied phenomena, an investigation of the global load perceived by a downstream wind turbine, depending on dynamic misalignment, will be performed in future works. The time solved measurement provided by an aerodynamic balance will permit to investigate the load variation dynamic on the downstream wind turbine.
Acknowledgements
The present work is part of a PhD co-funded by Labex Caprysses and Engie Green. References
[1] Bastankhah, M., & Porté-Agel, F. (2016). Experimental and theoretical study of wind turbine wakes in yawed conditions. Journal of Fluid Mechanics, 806, 506-541. doi:10.1017/jfm.2016.595
[2] Castillo, R., et al. "PIV measurements in a real time controlled model wind turbine wake simulator." Journal of Physics: Conference Series. Vol. 753.No. 3. IOP Publishing, 2016. [3] Grant, I., P. Parkin, and X. Wang. "Optical vortex tracking studies of a horizontal axis wind
turbine in yaw using laser-sheet, flow visualisation."Experiments in fluids 23.6 (1997): 513-519.
[4] Muller Y.A., Aubrun S., Masson C., Determination of real‑time predictors of the wind turbine wake meandering. Exp Fluids (2015) 56:53 DOI https://doi.org/10.1007/s00348-015-1923-9 [5] Yu, W., Hong, V.W., Ferreira, C. et al., Experimental analysis on the dynamic wake of an
actuator disc undergoing transient loads Exp Fluids (2017) 58: 149.
https://doi.org/10.1007/s00348-017-2432-9
[6] Bastankhah M., Porté-Agel F., A new analytical model for wind-turbine wakes, In Renewable
Energy, Volume 70, 2014, Pages 116-123, ISSN 0960-1481,
https://doi.org/10.1016/j.renene.2014.01.002.
[7] Bossuyt, J., Howland, M.F., Meneveau, C. et al. Exp Fluids (2017) 58: 1.
1234567890 ‘’“”
The Science of Making Torque from Wind (TORQUE 2018) IOP Publishing
IOP Conf. Series: Journal of Physics: Conf. Series 1037 (2018) 072035 doi :10.1088/1742-6596/1037/7/072035
[8] Benedict, L.H, Gould, R.D. , Towards better uncertainty estimates for turbulence statistics. Exp. Fluids (1996) 22, 129-136
[9] Parkin P., Holm R., Medici D., The application of PIV to the wake of a wind turbine in yaw. Proc. 4th International symposium on particle image velocimetry (2001), Göttingen,
Germany
[10] S. Aubrun, S. Loyer, P.E. Hancock, P. Hayden, Wind turbine wake properties: Comparison between a non-rotating simplified wind turbine model and a rotating model, Journal of Wind Engineering and Industrial Aerodynamics, Volume 120,2013,Pages 1-8,ISSN 0167-6105, https://10.1016/j.jweia.2013.06.07
[11] Howland, M. F., Bossuyt, J., Martínez-Tossas, L. A., Meyers, J., and Meneveau, C.: Wake structure in actuator disk models of wind turbines in yaw under uniform inflow conditions, Journal of Renewable and Sustainable Energy, 8, https://doi.org/10.1063/1.4955091, http://dx. doi.org/10.1063/1.4955091, 2016.
[12] Burton, T., Sharpe, D., Jenkins, N., Bossanyi, E.. Wind Energy Handbook. John Wiley & Sons, Chichester (2001).
[13] Espana G., Etude experimentale du sillage lointain des éoliennes à axe horizontal au moyen d’une modélisation simplifiée en couche limite atmospherique. PhD thesis, Prisme laboratory, university of Orléans (2009)
[14] Jimenez, A. Crespo, A. Migoya, E. (2009). Application of a LES technique to characterize the wake deflection of a wind turbine in yaw. Wind Energy. 13. 559 - 572. 10.1002/we.380. [15] Aubrun, S. Devinant, Ph. Espana, G. Physical modelling of the far wake from the wind turbines.
Apllication to wind turbine interactions. European Wind Energy Conference EWEC 2007, May 7-10, Milan, Italy