HAL Id: hal-00297778
https://hal.archives-ouvertes.fr/hal-00297778
Submitted on 20 Oct 2004HAL is a multi-disciplinary open access
archive for the deposit and dissemination of sci-entific research documents, whether they are pub-lished or not. The documents may come from teaching and research institutions in France or abroad, or from public or private research centers.
L’archive ouverte pluridisciplinaire HAL, est destinée au dépôt et à la diffusion de documents scientifiques de niveau recherche, publiés ou non, émanant des établissements d’enseignement et de recherche français ou étrangers, des laboratoires publics ou privés.
Investigation on the trophic state of the North Sea for
three years (1994?1996) simulated with the ecosystem
model ERSEM ? the role of a sharp NAOI decline
H. J. Lenhart, J. Pätsch, W. Kühn, A. Moll, T. Pohlmann
To cite this version:
H. J. Lenhart, J. Pätsch, W. Kühn, A. Moll, T. Pohlmann. Investigation on the trophic state of the North Sea for three years (1994?1996) simulated with the ecosystem model ERSEM ? the role of a sharp NAOI decline. Biogeosciences Discussions, European Geosciences Union, 2004, 1 (1), pp.725-754. �hal-00297778�
BGD
1, 725–754, 2004Investigation on the trophic state of the
North Sea H. J. Lenhart et al. Title Page Abstract Introduction Conclusions References Tables Figures J I J I Back Close
Full Screen / Esc
Print Version Interactive Discussion © EGU 2004 Biogeosciences Discussions, 1, 725–754, 2004 www.biogeosciences.net/bgd/1/725/ SRef-ID: 1810-6285/bgd/2004-1-725 © European Geosciences Union 2004
Biogeosciences Discussions
Biogeosciences Discussions is the access reviewed discussion forum of Biogeosciences
Investigation on the trophic state of the
North Sea for three years (1994–1996)
simulated with the ecosystem model
ERSEM – the role of a sharp NAOI decline
H. J. Lenhart, J. P ¨atsch, W. K ¨uhn, A. Moll, and T. Pohlmann
Institut f ¨ur Meereskunde der Universit ¨at Hamburg, Bundesstr. 53, D-20146 Hamburg, Germany
Received: 24 September 2004 – Accepted: 6 October 2004 – Published: 20 October 2004 Correspondence to: H. J. Lenhart ([email protected])
BGD
1, 725–754, 2004Investigation on the trophic state of the
North Sea H. J. Lenhart et al. Title Page Abstract Introduction Conclusions References Tables Figures J I J I Back Close
Full Screen / Esc
Print Version Interactive Discussion
© EGU 2004
Abstract
Applying the ecosystem model ERSEM to the Northwest-European shelf (48◦–63◦N, 15◦W–12◦E) the years 1994–1996 were simulated, which exhibit an extremely strong transition in North Atlantic Oscillation index (NAOI): from a high-NAOI to a low-NAOI regime. In order to be far enough from the boundaries of the model area the results and 5
budgets are focussed on the North Sea area. For this region the model was validated against climatological values of nitrate as representative nutrient.
For all three years the North Sea was found to be net heterotrophic: organic material was imported, inorganic material was exported. The strength of this “remineralisation-machine” was large during NAOI-high years (1994 and 1995). It was weaker in 1996 10
with a low NAOI. This was caused by higher net primary production in the northern North Sea during summer 1996. In this year the stratification was weaker and began later allowing the deep nutrient-rich water in the northern North Sea to be mixed into the upper layers also during early summer.
1. Introduction
15
Ecosystems of marginal seas and coastal areas are either net producers or net con-sumers of organic matter. The first ones are called net autotrophic, the latter ones net heterotrophic. Ecosystems strongly influenced by high nutrient loadings tend to be net autotrophic. During the last decades the input of organic matter has increased. This led to a shift towards net heterotrophic coastal areas (Rabouille et al., 2001). The con-20
sequence of this tendency is the reduced capability to absorb atmospheric CO2. The corresponding mechanism which seems to be reduced is called the biological pump: Beside inorganic carbon also nitrogen, phosphorus and other nutrients are biologically fixed. If this newly produced organic matter is removed by transport or sedimentation during the year, the amount of remineralised carbon and nutrients may be smaller than 25
sys-BGD
1, 725–754, 2004Investigation on the trophic state of the
North Sea H. J. Lenhart et al. Title Page Abstract Introduction Conclusions References Tables Figures J I J I Back Close
Full Screen / Esc
Print Version Interactive Discussion
© EGU 2004
tem with an effective biological pump. Other effects may also influence the status of such ecosystems. They reflect the physical environment of an ecosystem on larger time scales governed by climate signals. Under the light of possible climate change it is of great interest how shelf areas, assumed as efficient sinks of atmospheric CO2 (Tsunogai et al., 1999), may react.
5
The years 1994 to 1996 exhibit a strong transition from a high North Atlantic Oscil-lation Index (NAOI) to a very low one (NAOI1994 = 1.8, NAOI1995 = 2.5, NAOI1996 = −2.3). This shift influenced the physical environment of the ecosystem of the North-west European Shelf. The mean SST dropped (Dippner, 1997), winter wind direction changed from south-west to south-east and water exchange between North Atlantic 10
and shelf decreased.
To study the ecological consequences between these different years, model simula-tions with the European Regional Seas Ecosystem Model (ERSEM) were performed. Moll and Radach (2003) showed that ERSEM, out of a set of eleven models investi-gated, is a well suited model to simulate the North Sea ecosystem.
15
Taking all sinks and sources of inorganic and organic material into account, the ecosystem can be characterized as net autotroph or net heterotroph by simply bud-geting these sinks and sources together with the trans-boundary fluxes of inorganic and organic material. This “black-box approach” gives no insight into the character of internal transitions but leads to the same number which quantifies the degree of the 20
net heterotrophic state (or autotrophic state). Under this view this state can be inter-preted as dependent on the physical settings of individual years. Both, the internal and the “black-box” approach were performed in this paper. The first one for understand-ing regional and trophical differences, the second one for characterizing the different in- and out-flow areas. Three years from 1994 to 1996 were selected for this study, 25
representing an increase in the NAO Index in the first two years and a sharp decline to a negative NAO Index in the third year. Starting with the conditions at the end of 1993 from a 10 year spin-up run, the three years were continuously simulated with the ecosystem model ERSEM. From the simulations the annual nutrient and carbon
bud-BGD
1, 725–754, 2004Investigation on the trophic state of the
North Sea H. J. Lenhart et al. Title Page Abstract Introduction Conclusions References Tables Figures J I J I Back Close
Full Screen / Esc
Print Version Interactive Discussion
© EGU 2004
gets are derived and discussed in relation to the changes occurring in the trophic state of the North Sea.
After a general overview of the hydrodynamical and ecological conditions in the North Sea, the ERSEM model, on which this assessment is based, is described and vali-dated. Since the hydrodynamical conditions within the three years under consideration 5
are the basis for any further ecological interpretation, the water transports through se-lected transects around the North Sea are presented. Based on this information, the nutrient transport into and out of the North Sea is analysed in relation to the hydro-dynamical conditions. As central part of this investigation the carbon, nitrogen and phosphorus budgets are presented, calculated from the ERSEM simulations for the 10
three years. Finally, the trophic state is derived from the fluxes of dissolved inorganic nitrogen (DIN).
2. North Sea description
The North Sea is situated on the continental shelf of north-west Europe. The mean depth of the North Sea is 74 m with increasing depth from south to north. Topographical 15
exceptions are the Doggerbank (south-west of Central North Sea Water in Fig. 1) with a depth of only 15 m and the Norwegian Trench with depths larger than 300 m. The North Sea is strongly influenced by the North Atlantic Ocean through the connections to the Atlantic in the north and the English Channel in the south. The mean annual cycle of water mass transport shows two geographical regimes, a northern and a southern 20
system (Fig. 1). The water masses entering from the north turn eastward in the central North Sea and do not reach the continental coastal areas. The southern North Sea is influenced by the inflow of the English Channel and the freshwater influx from the continental rivers. However, the most important freshwater influx for the North Sea comes from the Baltic outflow.
25
The general pattern is an anti clockwise residual circulation. There are three major forces acting within the North Sea: the tides, the wind-driven circulation and surface
BGD
1, 725–754, 2004Investigation on the trophic state of the
North Sea H. J. Lenhart et al. Title Page Abstract Introduction Conclusions References Tables Figures J I J I Back Close
Full Screen / Esc
Print Version Interactive Discussion
© EGU 2004
heat fluxes as well as the horizontal and vertical density gradient. The tidally induced transport processes of advection and mixing are more vigorous in the southern, shallow parts than in the northern, deep parts. The most important agent for vertical exchange is the heat exchange at the sea surface. Surface heating causes seasonal stratification only in the deeper parts north of the Doggerbank and in regions of low tidal currents. 5
Driven by strong wind the whole water body is completely mixed in winter.
3. North Sea ecosystem
The ecosystem of the North Sea is to a high degree dependent on the prevailing phys-ical condition within the North Sea. The major signal is the onset of the thermal stratifi-cation, which causes the spring bloom of the algae since light is available in significant 10
quantity and the algae are kept within the productive euphotic zone. Except for this short period with high availability of light and nutrients, the phytoplankton of the open North Sea is limited in its resources. In the coastal regions the turbulent mixing which remobilises the remineralised organic material from the sediment together with the river input causes excessive supply of nutrients. However, this material can not always be 15
taken up by the phytoplankton, since self shading of chlorophyll and high suspended matter concentrations within the southern part of the North Sea due to erosion and river input lead to light-limited conditions. P ¨atsch and Radach (1997) showed that the primary production in the southern part is linked to the availability of nutrients and light while the northern part is dependent on the import of nutrients from the North Atlantic. 20
Nevertheless the highest primary production occurs in the continental coastal strip in the southern North Sea.
4. ERSEM model
The ecosystem model ERSEM was developed to simulate the ecosystem dynamics of the North Sea. It simulates the annual cycles of carbon, nitrogen, phosphorus and 25
BGD
1, 725–754, 2004Investigation on the trophic state of the
North Sea H. J. Lenhart et al. Title Page Abstract Introduction Conclusions References Tables Figures J I J I Back Close
Full Screen / Esc
Print Version Interactive Discussion
© EGU 2004
silicon in the pelagic and benthic food webs. The model is forced by irradiance and temperature data, suspended matter concentration, hydrodynamical fields of advection and diffusion derived from a general circulation model (GCM) as well as by inorganic and organic river load data.
The ERSEM application used for this assessment covers the whole continental shelf. 5
ERSEM is used as a box model, the structure consists of 310 boxes in two layers, comprising 278 inner boxes and 32 boundary boxes, where boundary conditions are prescribed (Fig. 2a). Since the North Sea is located in the center of the model domain, one can expect minor effects from these boundary conditions which were derived from the World Ocean Atlas 2001 (Conkright et al, 2002). The hydrodynamical data were 10
provided by the general circulation model HAMSOM (Hamburg Shelf Ocean Model). Including temperature and salt prognostically HAMSOM ran in a baroclinic mode. The circulation model was driven by six-hourly wind stress, air pressure, short wave radia-tion, humidity and cloudiness values derived from the ERA40 reanalized data provided by the ECMWF. Details of the model setup HAMSOM and the results are described by 15
Backhaus (1985), Backhaus and Hainbucher (1987) and by Pohlmann (1996a). For the three years of investigation the simulated flow fields of the GCM HAMSOM (Pohlmann (1996b) were adopted to this box structure. For further information on the adaptation of flow fields of the three-dimensional model to the ERSEM box model see Lenhart et al. (1995) and Lenhart and Pohlmann (1997).
20
The biological part of the model consists of an interlinked set of modules, describ-ing the biological and chemical interactions between the state variables. Simulated nutrients are phosphate, nitrate, ammonium and silicate. The primary production mod-ule consists of four phytoplankton groups (diatoms, flagellates, picophytoplankton and inedibles). The phytoplankton groups are subdivided into the elements carbon, phos-25
phorus, nitrogen and in case of diatoms also silicon. As secondary producers het-erotrophic flagellates, microzooplankton and mesozooplankton are taken into account. Within the microbial food web the bacteria and the particulate organic matter are in-cluded as state variables, while the fluxes of dissolved organic matter are
parame-BGD
1, 725–754, 2004Investigation on the trophic state of the
North Sea H. J. Lenhart et al. Title Page Abstract Introduction Conclusions References Tables Figures J I J I Back Close
Full Screen / Esc
Print Version Interactive Discussion
© EGU 2004
terised. In the sediment the biological dynamics of the benthic secondary producers are included as well as the breakdown of detrital material in the form of benthic nutrient regeneration. There are three processes by which the pelagic and the benthic com-partments are able to exchange matter. The sedimentation of organic material into the benthic system, the activity of filter feeders which extracts phytoplankton and detritus 5
from the pelagic system and the remineralisation, which releases inorganic nutrients back to the pelagic. Finally, the trophic web is closed by prescribing the grazing on zooplankton as well as the excretion of dissolved nutrients by fish and the flux from fish to the detritus pool. A general description of the model is given by Baretta et al. (1995). Information on the present application can be found by P ¨atsch and Radach (1997), 10
Lenhart (2001) and Heath et al. (2002).
In Fig. 2a the box configuration of the ERSEM model is shown covering the whole continental shelf. In addition, the boundaries of the North Sea used for this assessment are introduced in form of transects. Furthermore the separation between northern and southern North Sea is indicated. In Fig. 2b, the simulated nitrate concentration is 15
presented against climatological monthly mean data for selected boxes representing a north-south and an east-west row within the North Sea. The nitrate concentration is taken from the simulation for the year 1994. The nitrate data used for the validation are based on the work by Radach and P ¨atsch (1997), who did the aggregation and the statistical treatment of the nitrate observations for the years 1960 to 1994. The annual 20
cycle of the nitrate concentrations in the northern and central parts of the North Sea covers the observed range of climatological nitrate data quite good. This is true for the level of the winter concentration as well as for the depletion phase in summer. In the Southern Bight the nitrate concentrations in winter is overestimated by the ERSEM model. In general, the gradient from the continental coast towards the open North Sea 25
BGD
1, 725–754, 2004Investigation on the trophic state of the
North Sea H. J. Lenhart et al. Title Page Abstract Introduction Conclusions References Tables Figures J I J I Back Close
Full Screen / Esc
Print Version Interactive Discussion
© EGU 2004
5. Results
Before presenting the particular results on the water transports and the carbon and nutrient budgets, Table 1 gives a more general overview for the three years of investi-gation. Given are the annual mean irradiance, the mean annual water temperature, the nitrate load by the two largest continental rivers Rhine and Elbe, the net primary pro-5
duction and the advective import of organic material and the export of DIN. Additionally the export from the southern basin into the northern could be found.
5.1. Water transport over the external boundaries
The water transport into and out of the North Sea forms the basis for any assessment on the related nutrient and carbon exchange with the North Atlantic and the Baltic. 10
Differences in the transports strongly determine changes in the import and export of organic and inorganic matter and finally of the trophic state of the North Sea. Therefore the transports over selected transects (Fig. 2a), which allow to calculate a water budget for the North Sea, are presented for the three years as the basis for the discussion of further ecological implications.
15
Differences in the horizontal velocity field mainly due to different wind regimes can be clearly observed for January 1995 vs. January 1996. Figure 3 gives the streamlines derived from the corresponding monthly means of the velocities. In 1995 strong inflow from the Northwest and an anti-clockwise circulation in the whole North Sea is domi-nant. In 1996 the usual pattern of anti-clockwise circulation in the North Sea could not 20
be found.
From the water budget for the North Sea for the three years (Fig. 4) the general conclusion can be drawn that the strongest circulation occurs in 1995, the year with the highest NAO Index. The highest water inflow through the Shetland Channel cor-responds with the highest outflow of North Sea water at the Norwegian Trench. This 25
is valid for the whole depth range. However, when moving westward towards the UK coast this overall statement is no longer true. For the Fair Isles current the highest
BGD
1, 725–754, 2004Investigation on the trophic state of the
North Sea H. J. Lenhart et al. Title Page Abstract Introduction Conclusions References Tables Figures J I J I Back Close
Full Screen / Esc
Print Version Interactive Discussion
© EGU 2004
import of Atlantic water in the upper 30 m coincides with the lowest export of North Sea deep water (30 m to the bottom) in 1995. The Pentland Firth shows highest import in 1996, the year with the negative NAO Index. In the same year the outflow of North Sea water at Fair Isles below 30 m has its maximum (973 km3y−1), which is more than ten times higher as in the other two years under consideration. In contrast to the northern 5
North Atlantic boundary, the English Channel exhibits its highest inflow into the North Sea in 1994, while 1996 is the year with the lowest import. At the transect SK (Skager-rak), which reflects the exchange with the Baltic Sea, one can note strong interannual differences in the deep outflow of North Sea water into the Baltic and in the inflow of Baltic water masses in the upper layer. In 1994 the strongest Baltic inflow coincides 10
with the strongest outflow resulting in a net outflow into the Baltic. For the other two years the net transport over the water column represents an inflow of Baltic water, with 1995 showing a maximum twice as high as in 1996. The mean over the three years results in an Baltic inflow of 408 km3per year.
One can state that the high inflow into the North Sea via the English Channel is 15
correlated with a net outflow into the Baltic. However, the strong Atlantic inflow at the northern boundary of the North Sea especially in 1995 did not lead to a net outflow into the Baltic Sea.
5.2. Nitrogen transport over the external boundaries
Table 2 contains the transport of organic carbon and the inorganic/organic compounds 20
of nitrogen and phosphorus across the defined sections (Fig. 2a). Since the organic as well as the inorganic compounds exhibit similar flow patterns for nitrogen and phos-phorus, we restrict ourselves to the discussion of only one element. We chose nitrogen for discussion here as it is the most limiting nutrient.
The pattern of DIN-transport over the transects of the North Sea generally follows the 25
one described for the water displacements above (Fig. 4). It should be mentioned that the following analysis includes both the advective and the diffusive transport of matter. Again 1995 is the year with the highest import of DIN via the Shetland Channel and the
BGD
1, 725–754, 2004Investigation on the trophic state of the
North Sea H. J. Lenhart et al. Title Page Abstract Introduction Conclusions References Tables Figures J I J I Back Close
Full Screen / Esc
Print Version Interactive Discussion
© EGU 2004
highest export via the Norwegian Trench. However, differing from the water exchange, in the Norwegian Trench the export of DIN in 1994 exceeds the corresponding one for the year 1996. Also in contrast to the water transport, the DIN import in the upper layer of the Fair Isles Channel into the North Sea in 1994 is much higher than for the Shetland Channel. For the English Channel and the connection to the Baltic the 5
situation follows the pattern as described for the water transport again.
Even though there is a net import of total organic nitrogen (TON) into the North Sea (Table 2), the structure derived from the transects represents similar patterns as for the water transport, both in the overall distributions as between the years. The Shetland Channel exhibits the highest import and the Norwegian Trench represents the central 10
outflow out of the North Sea. The Fair Isles Channel shows its highest inflow in 1996, nearly twice as high as for the two previous years. This can be attributed to the fact that in contrast to 1994 and 1995 for 1996 we found import in the lower layer. This goes along with the highest overall inflow at the Pentland Firth and with the lower inflow at the Shetland Channel. The lower part of the Pentland Firth has a net outflow for the 15
years 1994 and 1995 and an import in 1996. The English Channel has its highest inflow also in 1996, corresponding with an overall export of North Sea TON into the Baltic in the same year.
5.3. Nutrient and carbon budget
Table 2 characterizes the import/export of material across the North Sea boundaries. 20
Together with internal sinks and sources as river input and sedimentation it is possible to characterize the system’s trophic state. This “black-box” approach can be supported by investigating the internal dynamics of the ecosystem. Table 3 reflects the nutrient and carbon budget allowing to determine the trophic state directly. In the upper lines the differences are derived from the nutrient or carbon content at the beginning and 25
the end of each year. At the bottom of the column one finds the same value, but this time as the difference derived from transport and diffusion as well as from the sink and source terms which contribute to changes of the nutrient or carbon concentrations
BGD
1, 725–754, 2004Investigation on the trophic state of the
North Sea H. J. Lenhart et al. Title Page Abstract Introduction Conclusions References Tables Figures J I J I Back Close
Full Screen / Esc
Print Version Interactive Discussion
© EGU 2004
within the simulated North Sea system.
For the physical part Table 3 shows the lowest difference between organic input and inorganic output for the North Sea system in 1996. By far the highest difference between imported organic material and exported inorganic material could be found in 1995, the year with the highest NAO Index from the three years under consideration. 5
Despite the high import of nutrients over the external boundaries in 1995 the nutrient budgets reflect the surprising fact that the net uptake of phytoplankton for the year 1996 is the highest of all three years under consideration. This can be explained by regional differences only. This effect is discussed later.
For the whole North Sea the magnitude of the nutrient uptake for the years 1994 and 10
1995 is more or less equal, but both years have a lower production than 1996. This finding is true for the values representing the N and P budget. As it was stated for the rivers Rhine and Elbe, the general budget (Table 3) confirms that the overall river input into the North Sea for 1996 is considerably less, especially for nitrogen. In addition, the radiation is highest in 1995 compared to the years 1994 and 1996 (Table 1). The 15
process contributions which refer to the biological cycles within the pelagic food web exhibit the same differences between the years. However, the input to the benthos is lowest in 1996, resulting in the lowest remineralisation of DIN and DIP for all three years.
It should be mentioned, that the budget tables represent the pelagic system. Sedi-20
ment enrichment can be concluded only for phosphorus indirectly. The benthic produc-tion of free nitrogen via denitrificaproduc-tion hampers the indirect budgeting of nitrogen in the sediment.
The carbon budget (Table 3) gives a different picture since the highest carbon pro-duction is simulated for the year 1995. This seems to be a contradiction to the fact that 25
the nutrient uptake is highest in 1996. However, since the Droop kinetic allowing dy-namical C:N:P ratios within the phytoplankton cell is incorporated in ERSEM (Baretta-Bekker et al., 1997), the carbon uptake can be decoupled from the nutrient uptake to a certain degree. Indeed, in 1995 the algae were confronted with nutrient-limited
con-BGD
1, 725–754, 2004Investigation on the trophic state of the
North Sea H. J. Lenhart et al. Title Page Abstract Introduction Conclusions References Tables Figures J I J I Back Close
Full Screen / Esc
Print Version Interactive Discussion
© EGU 2004
ditions in the central and northern North Sea but are able to incorporate carbon to a high amount. We found elevated cell C:N ratios in summer 1995 compared to lower ratios in summer 1996. However, there is also an huge excretion of organic carbon at the same time. Excretion does not enter the calculation of the net production.
5.4. Regional budgets North vs. South 5
In order to trace how far south into the North Sea the influence of the Atlantic inflow for the three years with different NAO Index reaches, regional budgets (tables not shown here) were compiled. The separation into a northern and a southern part follows a line from Middlesbrough, at the entering of the Tees in the UK, to Esbjerg in Denmark (Fig. 2a). The line separates the North Sea north of the Doggerbank.
10
The regional budgets clearly indicate that the net differences between organic input and inorganic output is only valid for the northern North Sea. The southern North Sea exhibits losses in both the organic and inorganic transport. Therefore the conclusion has to be that the net heterotrophic state of the North Sea is related to the northern part only. The analysis of the nitrogen budget indicates the southern North Sea as net 15
autotroph.
The net primary production for the southern North Sea is nearly the same for all three years (237 g C m−2 y−1 for 1994 and 1996; 236 g C m−2 y−1 for 1995). This might have to do with the fact that in the coastal water the content of climatological simulated suspended matter, which is taken into account in ERSEM, is high compared 20
to the northern North Sea. This implies that certain regions are light-limited. Neverthe-less the primary production in the southern North Sea is nearly twice as high as the corresponding values for the northern North Sea (about 120 g C m−2 y−1).
5.5. Enhanced nutrient uptake in the northern North Sea in 1996
Even though the nitrogen input via rivers is lowest in 1996 (Table 3) the highest nitrogen 25
BGD
1, 725–754, 2004Investigation on the trophic state of the
North Sea H. J. Lenhart et al. Title Page Abstract Introduction Conclusions References Tables Figures J I J I Back Close
Full Screen / Esc
Print Version Interactive Discussion
© EGU 2004
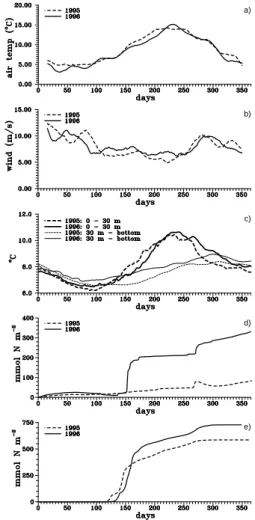
North Sea the nitrogen uptake was nearly the same in all three years. In the northern North Sea it was for the three years 440, 409 and 484 Gmol N y−1, respectively. This increase from 1995 to 1996 and the corresponding meteorological and hydrodynamical circumstances are demonstrated for the surface box 22 and the underlying deep box 182. The centre of these boxes is positioned at 2.8◦E 59.6◦N (Fig. 2a).
5
The air temperature at 2 m (Fig. 6a) was lower in 1996 than in 1995 for most of the time until day 220. This can be explained by the warming from the lower atmosphere of the North Atlantic by westerly winds in 1995. In contrast, in 1996 the winds from the south-east advected relatively cold air from the continent. Figure 6b illustrates the smoothed time series of 10 m wind speed in 1995 and 1996. Obviously from day 105 10
to day 250 wind speeds in 1996 were higher than in 1995. This is not in contradiction to the rule “high NAOI – high wind speed” in the North Sea and vice versa. This rule is more or less fulfilled in the winter months. In spring and summer we found higher wind speeds in the northern North Sea during 1996.
These two components, different air temperature and different wind speeds, influ-15
enced the timing of the stratification in the water column (Fig. 6c). The temperature of the upper layer (0–30 m) increased rapidly in 1995, it exceeds the temperature of the lower water column at day 116. The temperature curves of 1996 crossed at day 160, about a month later than in 1995. The last two graphs of Fig. 6 show temporal cumulative fluxes of nitrate import via vertical mixing (Fig. 6d) and nitrate uptake by 20
phytoplankton (Fig. 6e), both for the upper box: Shortly after day 150 the surface water in 1996 got a strong nitrogen input from the lower layer via mixing, only low influx could be found in 1995 (Fig. 6d). Even though the uptake started about 2 weeks later in 1996 than in 1995 the additional nutrient supply near day 150 pushed the nitrogen uptake in 1996 beyond the uptake of the year 1995 (Fig. 6e). The annual nitrate uptake in box 25
22 was 586 mmol N m−2 y−1 in 1995 and 728 mmol N m−2y−1 in 1996. This effect in box 22 (increase of about 25% nitrate uptake) is representative for a large number of northern boxes.
BGD
1, 725–754, 2004Investigation on the trophic state of the
North Sea H. J. Lenhart et al. Title Page Abstract Introduction Conclusions References Tables Figures J I J I Back Close
Full Screen / Esc
Print Version Interactive Discussion
© EGU 2004
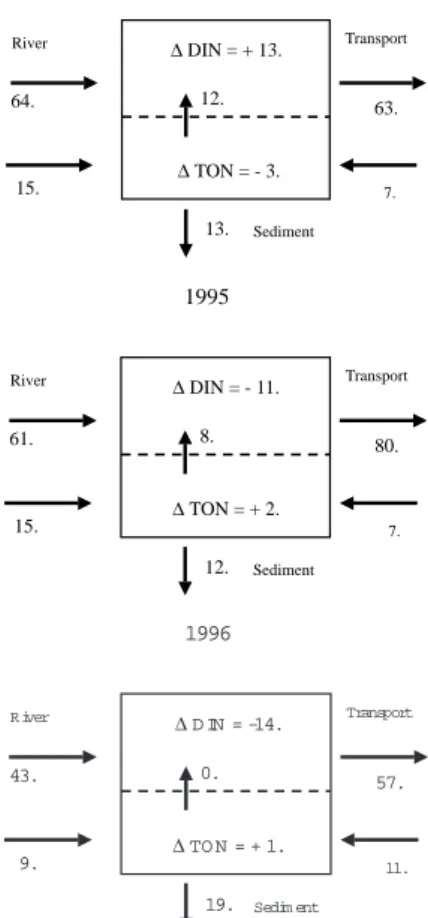
5.6. The trophic state derived from the internal budget
From the nitrogen budget the fluxes from Table 3 are compiled and aggregated into a more general overview (Fig. 5). The increase or decrease of DIN (∆DIN) and TON (∆TON) are the differences between the final and the initial content (∆: fin-ini.).While the river input for DIN and TON are single terms, the transport takes into account the 5
advection and diffusion (adv net + dif net). The net heterotrophy (NH-N) illustrated by the arrow between TON and DIN represents the transition from TON to DIN. NH-N is calculated as the sum of all fluxes out of the DIN pool plus the increase of content: NH-N=trans−river + ∆DIN.
This represents the net exchange between DIN and TON within the water column 10
and via the benthic-pelagic interaction. The TON budget can be simply closed by calculating the sediment flux:
Sediment=river−trans−∆TON−NH-N.
This net sediment flux represents the loss of pelagic nitrogen to the sediment; it is the sum of the fluxes “pel-sedi” for DIN and TON in Table 3.
15
For the year 1994 (Fig. 5a) nearly all the DIN input by the rivers was directly trans-ported away out of the system again. The gain in the DIN pool was only related to the net heterotropy by the transition from TON into DIN. By this net heterotrophy the TON pool was reduced, since the transition took more out of the pool as the rivers plus the transport supplied. In addition, the input into the benthos was of the same magni-20
tude as this exchange from TON into DIN. In 1995 (Fig. 5b) the DIN pool was reduced strongly. Responsible for this decline in the DIN pool was an extremely high loss by transport. The result of this extremly high loss was that the increased level of DIN from the last year was completely absorbed. Additionally there was a loss in the current year even though there was still the supply by the rivers plus the heterotrophic exchange. In 25
BGD
1, 725–754, 2004Investigation on the trophic state of the
North Sea H. J. Lenhart et al. Title Page Abstract Introduction Conclusions References Tables Figures J I J I Back Close
Full Screen / Esc
Print Version Interactive Discussion
© EGU 2004
as well as the loss to the benthos, were kept on the same level as 1994, but the net het-erotrophic exchange was reduced by about 1/4 compared to last year. Finally, in 1996 (Fig. 5c) there was still a further decline in the DIN pool with high transport losses and low river inputs, but moreover the net heterotrophic exchange was completely stopped. With an increased input to the benthos, an increase in the transport of TON but a lower 5
river input the TON content finally showed a small gain for the year 1996. Concluding we found the highest NH-N in 1994, the lowest in 1996. In 1996 the system was in balance, the same amount of TON was produced as it was decomposed.
6. Conclusions and discussion
The ERSEM model was used to investigate the reaction potential of the North Sea 10
ecosystem for three years with changing NAO Index, starting from an increasing pos-itive index towards a drastic decline in the last years. The ERSEM box set-up covers the whole Northwest European Shelf with the focus of the investigation on the North Sea, in the center of the model domain to reduce effects from the boundary condi-tions. While Allen et al. (2001) simulated the shelf with a three-dimensional ERSEM 15
version, our box model combines hydrodynamical forcing and ecological processes in one model with the possibility of evaluating simulations over several years and di ffer-ent scenarios in feasible computer time. The validation showed that the ERSEM box model could reproduce the main features of the nutrient dynamics in the North Sea. Of course, coastal gradients and complex vertical structures could not be resolved. The 20
box approach gave sufficiently detailed information on the process contribution in form of a North Sea nutrient and carbon budget.
By providing this budget the “black-box” approach could be reproduced and further substantiated by the internal process information on the net heterotrophic state of the North Sea. It was demonstrated that the strength of net heterotrophy, defined as net 25
transition from organic to inorganic matter, undergoes considerable changes within the three years of investigation. The strong inter-annual variability of water transport across
BGD
1, 725–754, 2004Investigation on the trophic state of the
North Sea H. J. Lenhart et al. Title Page Abstract Introduction Conclusions References Tables Figures J I J I Back Close
Full Screen / Esc
Print Version Interactive Discussion
© EGU 2004
the North Sea boundaries, derived from the 3D GCM model HAMSOM determined the overall transport pattern of the carbon, nitrogen and phosphorus components. To-gether with sinks and sources (river loading, sedimentation) the import/export of DIN and TON characterized the North Sea as net heterotrophic. The simulated net rem-ineralisation of TON would be even higher when the net sedimentation (sediment input 5
minus output) excluding benthic denitrification would be simulated smaller. Net pri-mary production and net uptake of nutrients by phytoplankton experienced the highest biomass production in the year 1996. The high production could be explained by the interaction of physical and biological processes. Namely weak thermocline in spring and early summer 1996, which allowed for considerable nitrogen input from the lower 10
part of the water column, could be found to be the main agent for the higher primary production in the northern North Sea compared to the other years. Together with high transport-losses in the DIN pool and low river inputs the net heterotrophic exchange stopped completely in 1996.
Moreover, a regional difference between the northern and the southern part of the 15
North Sea could be demonstrated. This is in accordance with P ¨atsch and Radach (1997) who showed that the primary production in the southern part is linked to the availability of nutrients and light while the northern part is dependent on the import of nutrients from the North Atlantic. Very high production in the continental coastal strip, high production in the southern North Sea and effective transport of organic matter out 20
of the southern basin determined the southern system to run net autotrophic for all three years. Thomas et al. (2004) also characterized the North Sea divided into two subsystems. From their budgets they concluded low removal of organic matter in the southern North Sea and efficient removal in the northern part due to stratification. This could be supported only partly by our simulations: Addition by rivers and removal in the 25
southern part balanced the high organic pool in the southern basin. The northern North Sea, which was not continuously stratified during the warm period, was enriched by the export of organic material from the southern basin. The corresponding remineralisation in the northern North Sea was able to fill the surface water with inorganic material in
BGD
1, 725–754, 2004Investigation on the trophic state of the
North Sea H. J. Lenhart et al. Title Page Abstract Introduction Conclusions References Tables Figures J I J I Back Close
Full Screen / Esc
Print Version Interactive Discussion
© EGU 2004
spring or summer. We speculate that these mechanisms reduces the capability of the North Sea to take up atmospheric CO2.
Acknowledgements. Thanks are due to F. Toussaint from the Deutsches Klimarechenzentrum
for making the ERA40 data available and to M. Kreus for his technical support. The work on this paper was supported by the project EXOS, funded by the DFG (DFG 02-759).
5
References
Allen, J. I., Blackford, J., Holt, J., Proctor, R., Ashworth, M., and Siddorn,J.: A highly spatially resolved ecosystem model for the North West European Shelf, Sarsia, 86, 423–440, 2001. Backhaus, J. O.: A Three-Dimensional Model for the Simulation of Shelf Sea Dynamics, Dt.
hydrogr. Z., 38, 167–262, 1985. 10
Backhaus, J. and Hainbucher, D.: A finite difference general circulation model for the shelf seas and its application to low frequency variability on the North European Shelf, in: Three dimensional modles of marine and estuarine dynamics, edited by Nihoul, J. C. J. and Jamart, B. M., Elsevier Oceanography Series 45, Amsterdam, 221–244, 1987.
Baretta, J. W., Ebenh ¨oh, W., and Ruardij, P.: An overview over the European Reginal Sea 15
Ecosystem Model, a complex marine ecosystem model, Neth. J. Sea Res., 33, 3/4, 233– 246, 1995.
Baretta-Bekker, J. G., Baretta, J. W., and Ebenh ¨oh, W.: Microbial dynamics in the marine ecosystem model ERSEM II with decoupled carbon assimilation and nutrient uptake, J. Sea Res., 38, 195–211, 1997.
20
Conkright, M. E., Locarnini, R. A., Garcia, H. E., O’Brien, T. D., Boyer, T. P., Stephens, C., and Antonov, J. I.: World Ocean Atlas 2001: Objective Analyses, Data Statistics, and Figures, CD-ROM Documentation, National Oceanographic Data Center, Silver Spring, MD, 17 pp, 2002.
Dippner, J. W.: SST Anomalies in the North Sea in Relation to the North Atlantic Oscillation 25
and the influence on the theoretical spawning time of fish, Dt. Hydr. Z., 49, 2/3, 267–275, 1997.
Heath, M. R., Edwards, A. C., P ¨atsch, J., and Turell, W. R.: Modelling the behaviour of nutrients in the coastal waters of Scotland. Fisheries Research Services Marine Laboratory Aberdeen, Scottish Executive Central Research Unit Contract., 106 pp, 2002.
BGD
1, 725–754, 2004Investigation on the trophic state of the
North Sea H. J. Lenhart et al. Title Page Abstract Introduction Conclusions References Tables Figures J I J I Back Close
Full Screen / Esc
Print Version Interactive Discussion
© EGU 2004
Lenhart, H. J. and Pohlmann, T.: The ICES box approach in relation to results of a North Sea circulation model, Tellus, 49A, 1, 1997
Lenhart, H. J., Radach, G., Backhaus, J. O., and Pohlmann, T.: Simulations of the North Sea circulation, its variability, and its implementation as hydrodynamical forcing in ERSEM, Neth. J. Sea Res, 33, 271–299, 1995.
5
Lenhart, H.-J.: Effects of River Nutrient Load Reduction on the Eutrophication of the North Sea, Simulated with the Ecosystem Model ERSEM, In: Burning issues of North Sea ecology, edited by Kr ¨oncke, I., T ¨urkay, M. and, S ¨undermann, J., Proceedings of the 14th international Senckenberg Conference North Sea 2000, Senckenbergiana marit, 31, 2, 299–311, 2001. Moll, A. and Radach, G.: Review of three-dimensional ecological modelling related to the North 10
Sea shelf system – Part 1: Models and their results, Progress in Oceanography, 57, 2, 175– 217, 2003.
OSPAR: Quality Status Report 2000, Region II Greater North Sea, 2000. OSPAR: Commision, London, 136 pp, 2000.
P ¨atsch, J. and Radach, G.: Long-term simulation of the eutrophication of the North Sea: tem-15
poral development of nutrients, chlorophyll and primary production in a comparison to obser-vations, J. Sea Res., 38, 275–310, 1997.
Pohlmann, T.: Predicting the thermocline in a circulation model of the North Sea. Part I: Model description, calibration, and verification, Cont. Shelf Res., 7, 131–146, 1996a.
Pohlmann, T.: Calculating the annual cycle of the vertical eddy viscosity in the North Sea with 20
a three dimensional baroclinic shelf sea circulation model, Cont. Shelf Res., 7, 147–162, 1996b.
Rabouille, C., Mackenzie, F. T., and Ver, L. M. B.: Influence from the human pertubation on car-bon, nitogen, and oxygen biogeochemical cycles in the global coastal ocean, Geochemica et Cosmochemica Acta, 65, 21, 3615–3641, 2001.
25
Radach, G. and P ¨atsch, J.: Climatological annual cycles of nutrients and chlorophyll in the North Sea, J. Sea Res., 38, 231–248, 1997.
Thomas, H., Bozec, Y., de Baar, H. J. W., Elkalay, K., Frankignoulle, M., Schiettecatte, L.-S., and Vieira Borges, A.: The carbon budget of the North Sea, Biogeosciences Discussions, 1, 367–392, 2004,
30
SRef-ID: 1810-6285/bgd/2004-1-367.
Tsunogai, S., Watanabe, S., and Sato, T.: Is there a “continental shelf pump” for the absorption of atmospheric CO2?, Tellus, 51B, 701–712, 1999.
BGD
1, 725–754, 2004Investigation on the trophic state of the
North Sea H. J. Lenhart et al. Title Page Abstract Introduction Conclusions References Tables Figures J I J I Back Close
Full Screen / Esc
Print Version Interactive Discussion
© EGU 2004
Turrell, W. R.: New hypotheses concerning the circulation of the northern North Sea and its relation to North Sea fish stock recruitment, ICES J. Mar. Sci., 49, 107–123, 1992.
BGD
1, 725–754, 2004Investigation on the trophic state of the
North Sea H. J. Lenhart et al. Title Page Abstract Introduction Conclusions References Tables Figures J I J I Back Close
Full Screen / Esc
Print Version Interactive Discussion
© EGU 2004
Table 1. Overview about NAOI related parameters for the three years of investigation.
Years 1994 1995 1996
NAO-Index (January) 1.8 2.5 −2.3
Mean wind direction on shelf (January) WSW WSW SE Annual mean irradiance on shelf (W m−2) 104.1 107.4 105.0 Baltic water inflow (km3y−1) −309 1054 480 Rhine nitrate/phosphate load (Gmol y−1) 21.4/0.32 21.6/0.32 12.7/0.22 Elbe nitrate/phosphate load (Gmol y−1) 9.5/0.06 9.1/0.06 6.2/0.06 Netpp North Sea (g C m−2y−1) incl. excretion 164 160 171 Net uptake North Sea (g C m−2y−1) 172 176 168 TON net import NS (Gmol y−1) 8 7 11 DIN net export NS (Gmol y−1) 63 80 57 TON net transport SNS→NNS (Gmol y−1) 32 26 29 DIN net transport SNS→NNS (Gmol y−1) 63 47 41
BGD
1, 725–754, 2004Investigation on the trophic state of the
North Sea H. J. Lenhart et al. Title Page Abstract Introduction Conclusions References Tables Figures J I J I Back Close
Full Screen / Esc
Print Version Interactive Discussion
© EGU 2004
Table 2. Mass transport over selected transects around the North Sea in Gmol. The sections
are: SK: Skagerrak, NT: Norwegian Trench, SC Shetland Channel, FI: Fair Iles Current, PF: Pentland Firth, EC: English Channel. The listed parameters are: TOC (total organic carbon), DIN (dissolved organic nitrogen), TON (total organic nitrogen), total as sum of DIN and TON, DIP (dissolved inorganic phosphorus), TOP (total organic phosphorus), total as sum of DIP and TOP.
1994 [Gmol] TOC DIN TON DIP TOP
SK −10,3 −6,9 −2,2 −0,2 −0,1 NT −356 −340 −62,6 −35,5 −5,1 SC 329 218,6 52,8 28,6 4,5 FI 57,8 35,1 9,1 2,9 0,7 PF 19,2 11,6 3,2 1 0,2 EC 37,3 18,8 7,1 1,2 0,5 SUM 77 −62,8 7,4 −2 0,7
1995 [Gmol] TOC DIN TON DIP TOP
SK 34,9 3,5 5,9 0,4 0,5 NT −458,5 −388,1 −75,6 −39,5 −6,2 SC 383,3 237,4 59,3 31 5,1 FI 59,4 42 9,6 3,7 0,8 PF 15,7 9,9 2,8 0,9 0,2 EC 24,7 15,4 4,7 1 0,4 SUM 59,5 −79,9 6,7 −2,5 0,8
1996 [Gmol] TOC DIN TON DIP TOP
SK −5,9 6,9 −1,1 0,6 0 NT −437,6 −332,7 −74,2 −36,3 −6 SC 352,4 226,6 57 29,7 4,8 FI 105,2 20,8 17,5 2,5 1,3 PF 24,1 8,3 4,2 0,8 0,3 EC 40,9 12,6 7,6 0,8 0,5 SUM 79,1 −57,5 11 −1,9 0,9
BGD
1, 725–754, 2004Investigation on the trophic state of the
North Sea H. J. Lenhart et al. Title Page Abstract Introduction Conclusions References Tables Figures J I J I Back Close
Full Screen / Esc
Print Version Interactive Discussion
© EGU 2004
Table 3. Yearly C,N,P budgets for different NAO Index years 1994 to 1996. Columns
rep-resent the total pelagic North Sea mass for the lines “content init” and “content final”. The following lines represent the corresponding fluxes per year, adv net: net advective flux across the boundaries, dif net: diffusion across the boundaries, river: river input, uptake net: pelagic uptake, excr/remi: pelagic respiration and excretion, pel-sedi: the remineralization/sinking flux from/into the sediment. The listed parameters are: TOC (total organic carbon), DIN (dissolved organic nitrogen), TON (total organic nitrogen), total as sum of DIN and TON, DIP (dissolved inorganic phosphorus), TOP (total organic phosphorus), total as sum of DIP and TOP.
1994 NS [Gmol] POC total DIN TON total DIP TOP total
content init 227 227 392 46 438 33 4 36 content final 212 212 406 43 449 34 3 37 ∆: fin.-ini. −15 −15 14 −3 11 1 0 1 adv net 81 81 −62 9 −53 −2 1 -1 dif net −4 −4 −1 −1 −2 0 0 0 river 65 65 64 14 79 1 1 2 uptake net 7359 7359 −1034 1034 0 −83 83 0 excr/remi −3776 −3776 438 −438 0 48 −48 0 pel-sedi −3740 −3740 608 −621 −13 37 −38 -1 SUM −15 14 −3 1 0
1995 NS [Gmol] POC total DIN TON total DIP TOP total
content init 212 212 406 43 449 34 3 37 content final 225 225 395 45 440 33 4 37 ∆: fin.-ini. 12 12 −11 2 −9 0 0 0 adv net 70 70 −79 9 −70 −3 1 -2 dif net −11 −11 −1 −2 −3 0 0 0 river 65 65 61 15 76 1 1 2 uptake net 7526 7526 −1002 1002 0 −81 81 0 excr/remi −3864 −3864 408 −408 0 45 −45 0 pel-sedi −3775 −3775 602 −614 −12 37 −37 0 SUM 12 −11 2 0 0
BGD
1, 725–754, 2004Investigation on the trophic state of the
North Sea H. J. Lenhart et al. Title Page Abstract Introduction Conclusions References Tables Figures J I J I Back Close
Full Screen / Esc
Print Version Interactive Discussion
© EGU 2004
Table 3. Continued.
1996 NS [Gmol] POC total DIN TON total DIP TOP total
content init 225 225 395 45 440 33 4 37 content final 227 227 381 46 427 33 4 37 ∆: fin.-ini. 3 3 −14 1 −13 0 0 0 adv net 88 88 −59 13 −47 −2 1 −1 dif net −9 −9 2 −2 0 0 0 0 river 65 65 43 9 52 1 1 2 uptake net 7207 7207 −1077 1077 0 −87 87 0 excr/remi −3617 −3617 474 −474 0 52 −52 0 pel-sedi −3731 −3731 604 −623 −19 36 −37 -1 SUM 3 −14 1 0 0
BGD
1, 725–754, 2004Investigation on the trophic state of the
North Sea H. J. Lenhart et al. Title Page Abstract Introduction Conclusions References Tables Figures J I J I Back Close
Full Screen / Esc
Print Version Interactive Discussion
© EGU 2004
Fig. 1. Current system in the North Sea after Turrell (1992) modified for the Quality Status
BGD
1, 725–754, 2004Investigation on the trophic state of the
North Sea H. J. Lenhart et al. Title Page Abstract Introduction Conclusions References Tables Figures J I J I Back Close
Full Screen / Esc
Print Version Interactive Discussion
© EGU 2004
Fig. 2. (a) ERSEM box configuration with indication of the transects used to separate the North
Sea area of investigation. Additionally the separation of the northern and southern North Sea as used for this investigation is illustrated.
BGD
1, 725–754, 2004Investigation on the trophic state of the
North Sea H. J. Lenhart et al. Title Page Abstract Introduction Conclusions References Tables Figures J I J I Back Close
Full Screen / Esc
Print Version Interactive Discussion
© EGU 2004
Fig. 2. (b) Nitrate validation for a west-east section and a south-north section. The y-axis is set
BGD
1, 725–754, 2004Investigation on the trophic state of the
North Sea H. J. Lenhart et al. Title Page Abstract Introduction Conclusions References Tables Figures J I J I Back Close
Full Screen / Esc
Print Version Interactive Discussion
© EGU 2004
Fig. 3. Streamlines derived from the simulated mean January horizontal velocity components. (a) for January 1995, (b) for January 1996.
BGD
1, 725–754, 2004Investigation on the trophic state of the
North Sea H. J. Lenhart et al. Title Page Abstract Introduction Conclusions References Tables Figures J I J I Back Close
Full Screen / Esc
Print Version Interactive Discussion
© EGU 2004
Fig. 4. Overview on water transport through the different transects (km3 a−1). The years are indicated by different size of arrows: ⇒ for 1994, → for 1995 and > for 1996. The transects are SK: Skagerrak, NT: Norwegian Trench, SC: Shetland Channel, FI: Fair Isles Current, PF: Pentland Firth, EC: English Channel.
BGD
1, 725–754, 2004Investigation on the trophic state of the
North Sea H. J. Lenhart et al. Title Page Abstract Introduction Conclusions References Tables Figures J I J I Back Close
Full Screen / Esc
Print Version Interactive Discussion © EGU 2004 ∆DIN = + 13. Transport Sediment 13. 15. 64. 63. ∆TON = - 3. River 12. 7. 1994 ∆DIN = - 11. Transport Sediment 12. 15. 61. 80. ∆TON = + 2. River 8. 7. 1995 ∆D IN = -14. Transport Sedim ent 19. 9. 43. 57. ∆TO N = + 1. River 0. 11. 1996
BGD
1, 725–754, 2004Investigation on the trophic state of the
North Sea H. J. Lenhart et al. Title Page Abstract Introduction Conclusions References Tables Figures J I J I Back Close
Full Screen / Esc
Print Version Interactive Discussion © EGU 2004 a) b) c) d) e)
Fig. 6. Causes of enhanced nitrate uptake in box 22 for 1996 vs. 1995. (a) air temperature, (b)
wind speed,(c) temperatures in the upper and lower layer (d) diffusive nitrate transport from