NUCLEAR ENGINEERING
A CORE RELOAD
MASSACHUSETTS INSTITUTE
OF TECHNOLOGY
READu
&
-
MT
PATTERN AND COMPOSITION OPTIMIZATION METHODOLOGY FOR
PRESSURIZED WATER REACTORS by
I.L. SAUER and M.J. DRISCOLL
MITNE-266 March 1985
j
FFI~JG
-
M.I.T.
A CORE RELOAD PATTERN AND COMPOSITION OPTIMIZATION METHODOLOGY FOR
PRESSURIZED WATER REACTORS by
I.L. SAUER and M.J. DRISCOLL
March 1985 MITNE-266
A CORE RELOAD PATTERN AND COMPOSITION OPTIMIZATION METHODOLOGY FOR PRESSURIZED WATER REACTORS
by
Ildo Luis Sauer
and
Michael John Driscoll
March 1985
Department of Nuclear Engineering Massachusetts Institute of Technology
Ildo Luis Sauer and
Michael John Driscoll ABSTRACT
The primary objective of this research was the development of a comprehensive, rapid and conceptually simple methodology for PWR core
reload pattern and fuel composition optimization, capable of system-atic incorporation of constraints, in which cycle burnup is defined
as the optimality criterion.
A coarse mesh nodal method for PWR core analysis was formulated by coupling the one-and-one-half-group diffusion theory model for spatial power calculations with the linear reactivity versus burnup
model (LRM) for depletion calculations. The accuracy and suitability
of this model was determined through comparisons of its results with
those of state-of-the-art core analysis methods.
The simplicity of the LRM-based core model allowed the direct
analytical computation of the derivatives necessary in the steepest-gradient type optimization methods applied in the present work, and
its versatility permitted use of the analytical and computational
methods for a variety of aoplications, ranging from core reload
pat-tern searches to burnable poison (BP) and composition optimization. Algorithms for identification of unconstrained maximum-burnup core
reload patterns and for optimal BP allocation were successfully imple-mented and tested, and the basis for systematic incorporation of
con-straints on power peaking was developed. The potential application
of the methodology to fuel composition optimization was also examined. Most of the methodological developments have been embodied in
the LRM-NODAL code which was progranined in the course of this research.
From the numerical and analytical results it was found that the
opti-mal core configurations are arranged such as to produce power
his-tories and profiles in which the most reactive assemblies are at their highest allowable power at EOC (thus maximizing their importance) and
where the converse applies to the least reactive; these preferred
profiles also produce relatively higher leakage at BOC, evolving to the lowest possible leakage at EOC, but always consistent with the
ACKNOWLEDGMENTS
The work presented in primarily by the principal has submitted substantially fulfillment of the requirem Nuclear Engineering at MIT. D. D. Lanning who served as
this report has been performed author, Ildo Luis Sauer, who
the same report in partial ents for the Ph.D. degree in
Thanks are due Professor thesis reader.
The principal author was supported during the course of this work by PRONUCLEAR administered by the COMISSAO NACIONAL DE ENERGIA NUCLEAR of BRAZIL. Funds for report preparation were provided under a research grant from Westinghouse Electric Corporation. Typing of this report was ably handled by Vicki Law and Sandy Congleton.
TABLE OF CONTENTS ABSTRACT... ACKNOWLEDGEMENTS... TABLE OF CONTENTS... LIST OF FIGURES... LIST OF TABLES... CHAPTER 1. INTRODUCTION... 1.1 Foreword... 1.2 Background... 1.2.1 Previous Reload Optimization 1.2.2 Linear Reactivity Model Work
CHAPT
Work...
at MIT...
1.3 Research Objectives and Organization of the Report...
ER 2. REACTOR PHYSICS METHODS AND MODELS... 2.1 Introduction...
2.2 State-of-the-art Nuclear Analysis Methods... 2.2.1 Spectrum Calculations... 2.2.2 Spatial Calculations... 2.3 Foundations for an Optimization-Oriented Core Analysis
Method...
2.3.1 A Modified One Group Model... 2.3.2 System Reactivity Balance and Eigenvalue...
2.3.3 The Linear Reactivity Model (LRM)...
2.3.3.1 LRM for Unpoisoned Fuel Assemblies... 2.3.3.2 Burnable Poison Modeling... 2.3.4 Evaluation of Simplifications, Approxinations, and Assumptions... page 2 3 5 10 13 15 15 16 19 19 23 25 25 26 27 29 30 31 34 36 37 38 43
6
TABLE OF CONTENTS (Continued)
2.3.4.1 2.3.4.2 2.3.4.3 2.3.4.4 2.4 Chapter Summary
Power and Flux Relationship ... Power Weighting of Reactivity. Spectral Ambiguity... Superposition of Reactivity...
... . . . .
CHAPTER 3. A COARSE MESH NODAL METHOD... 3.1 Introduction... 3.2 Derivation of the Nodal Equations...
3.2.1 Interior Nodes...
3.2.2 Radial Leakage Calculation... 3.2.3 Peripheral Nodes...
3.2.4 Relation to Previous Results. 3.2.5 Incorporation of Corrections ments... and Empir ... 9 ical Adjust.--... a 0 ... 0 ... 9a.... 3.2.5.1 Differential Thermal Leakage.
3.2.5.2 Power Related Feedback...
3.2.5.3 Axial Leakage...
3.2.5.4 Differential Boron Worth...
3.3 The Solution Strategy...
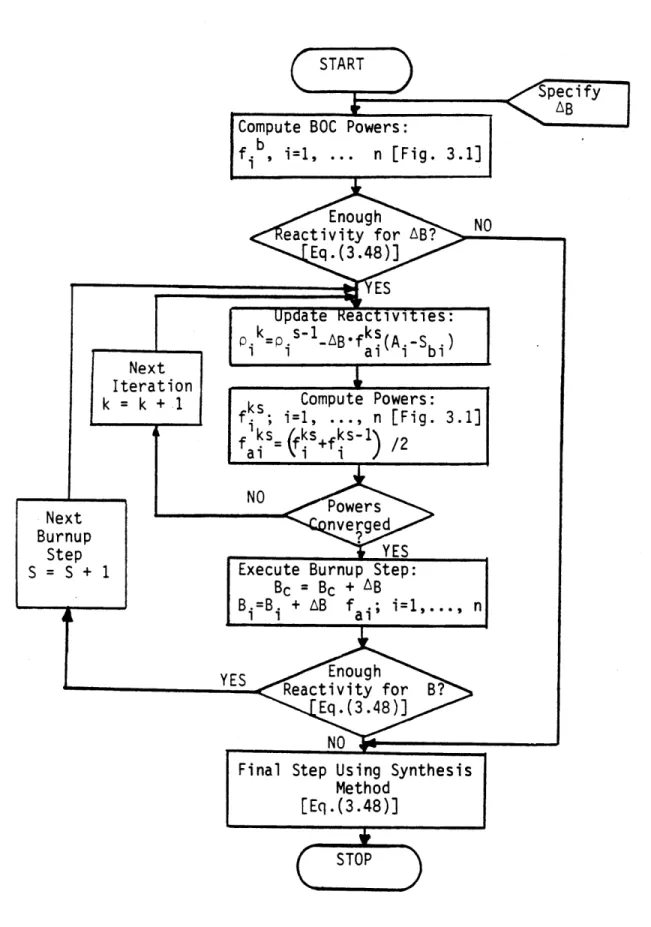
3.4 Burnup Calculation... 3.4.1 Synthesis Method... 3.4.2 Integrated Method... 3.4.3 Step-wise Depletion Method...
page 43 44 45 48 49 50 50 51 51 57 61 66 68 69 69 70 71 72 76 76 79 82
TABLE OF CONTENTS (Continued)
3.5 Accuracy: A Comparison with State-of-the-art results.... 3.6 Chapter Summary...
CHAPTER 4. OPTIMIZATION METHODOLOGY... 4.1 Introduction...
4.2 Optimality Criterion... 4.3 The Optimization Method... 4.3.1 A Gradient Method... 4.3.2 The Calculation of the Derivative... 4.3.2.1 Nodal Power Derivative Calculations...
4.3.2.1.1. BOC Nodal Power Derivative
Calculation...
4.3.2.1.2 EOC Nodal Power Derivative
Calculation...
4.3.2.2. Burnup Derivatives... 4.3.2.2.1 Synthesis Approach... 4.3.2.2.2 Integrated Approach.. 4.3.3 Sensitivity Theory Approach... 4.3.4A Direct Search Method... 4.4 Applications and Optimization Algorithms...
4.4.1 Unconstrained Reload Pattern Optimization 4.4.2 Burnable Poison Optimization Algorithm... 4.4.3 Incorporation of Constraints...
4.4.4 Application to Composition Optimization.. 4.4.4.1 Forward Method... .... .... 119 .. . .. . 119 . .123 ... . 123 . .127 ... 129 Algodthms 129 ... 140 148 . .152 ... . 152 page 86 99 100 100 102 103 107 108 109 110 116
8
TABLE OF CONTENTS (Continued)
4.4.4.2 Backward Method... 4.5 Chapter Summary and Conclusions...
CHAPTER 5. SUMMARY, CONCLUSIONS AND RECOMMENDATIONS ...
5.1 Introduction... 5.2 Methodology Development... 5.2.1 A Coarse Mesh Nodal Method... 5.2.1.1 Nodal Power Calculation...
5.2.1.2 Burnup Calculation... 5.2.1.3 Accuracy: A Comparison with LEO
PDQ - 7 Results... 5.2.2 Optimization Methodology...
5.2.2.1 Optimization Approaches...
5.2.2.2 Optimization Algorithms and Appl
page ... 153 ... 0154 156 156 159 159 160 167 171 176 177 PARD ications..181 5.3 Conclusions.... 5.4 Recommendations for Future Work... ... 187
... 188
APPENDIX A ANALYSIS OF THE POWER VERSUS FLUX NORMALIZATION FACTOR [ ] AND RELATED PARAMETERS...191
K DI A-1 K/V VARIATION WITH BURNUP AND REACTIVITY...195
A-2 D1/M2, D1 AND M2 VARIATION WITH BURNUP...202
A-3 POWER FEEDBACK EFFECT ON DI/M2 . . . .208
TABLE OF CONTENTS (Continued)
APPENDIX B TWO DIMENSIONAL SOLUTION OF THE ONE-AND-ONE-HALF GROUP
MODEL...
B-1 INTERIOR NODES... B-2 PERIPHERAL NODES... B-3 NET LEAKAGE OUT OF PERIPHERAL NODES.. DIFFERENTIAL THERMAL LEAKAGE AND POWER...
C-1 INTRODUCTION... C-2 POWER-RELATED FEEDBACK...
C-3 THERMAL NEUTRON EFFECTS... THE LRM-NODAL PROGRAM... D-1 INTRODUCTION... D-2 CODE LISTING... 216 221 226 228 228
...
.... 228 .--- - - - - 230 .237 .237 245 REFERENCES...277 page 212 APPENDIX C APPENDIX D I I10
LIST OF FIGURES
page
2.1 Representative Sequence of Calculations for PWR Licensing
Analysis... 28
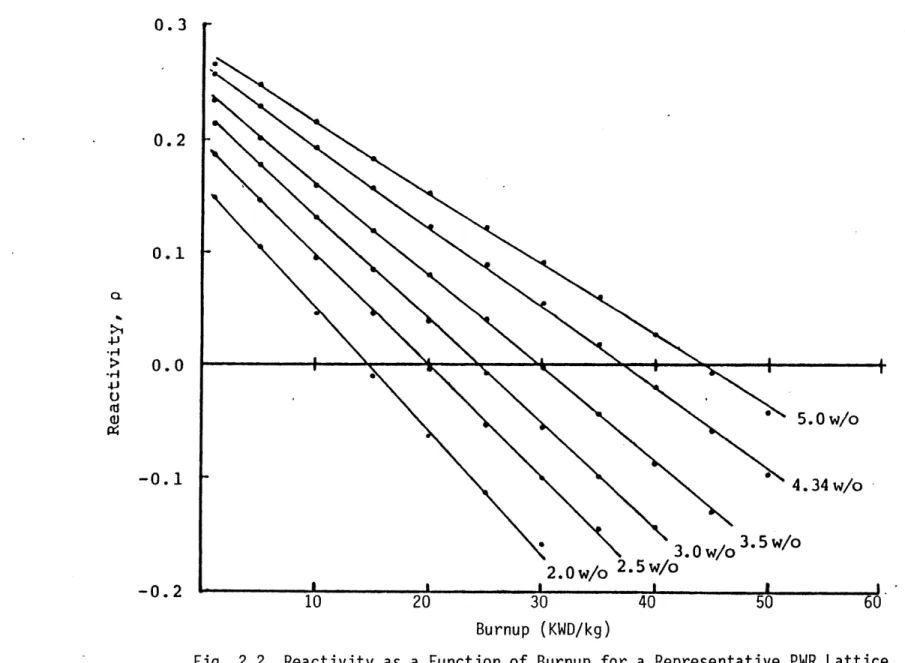
2.2 Reactivity as a Function of Burnup for a Representative PWR lattice... 39
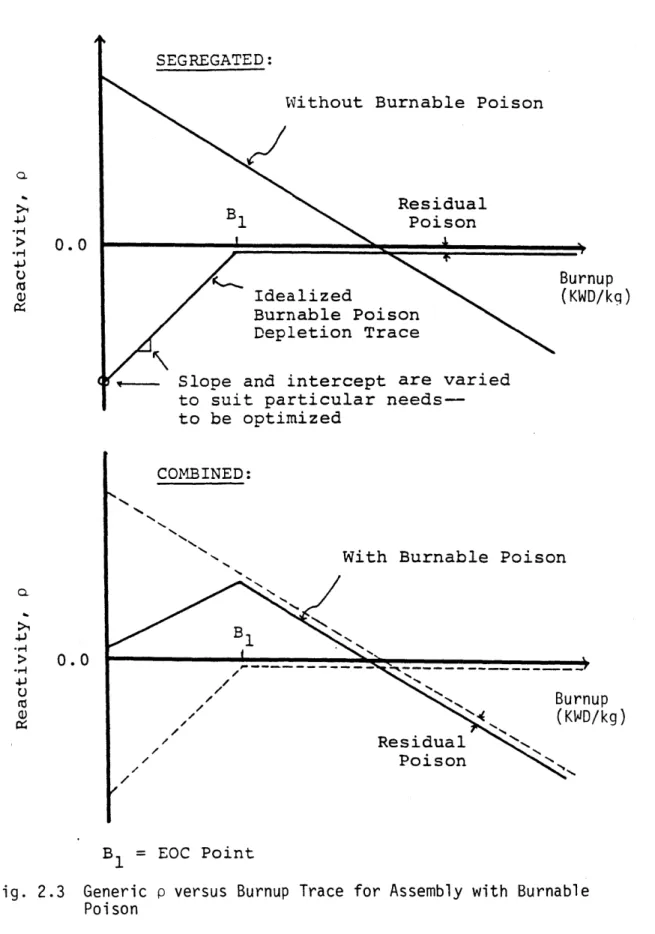
2.3 Generic p versus Burnup Trace for Assembly with Burnable Poison... 41
2.4 Reactivity as a Function of Burnup for B C Poisoned and BP-free Assemblies (3% U-235, Maine Yankee Lattice)... 42
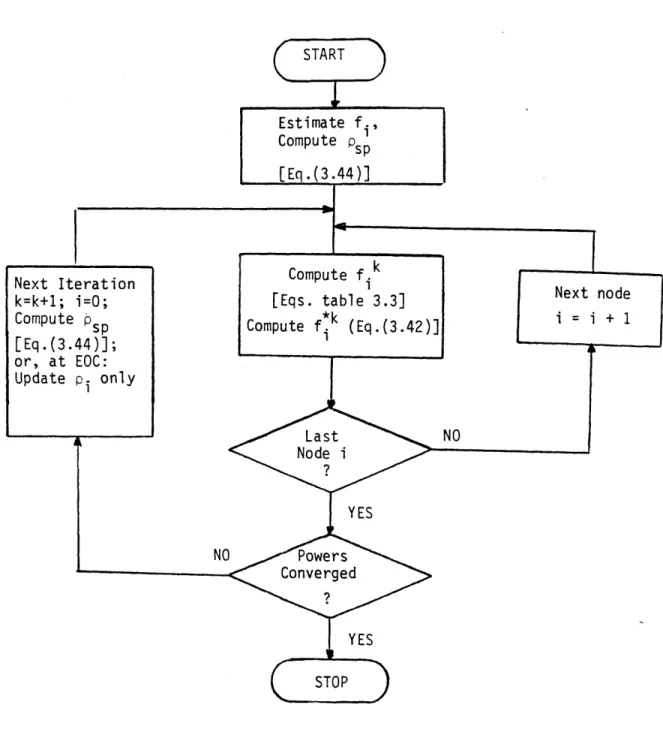
3.1 Flowchart of Power Distribution Calculation... 73
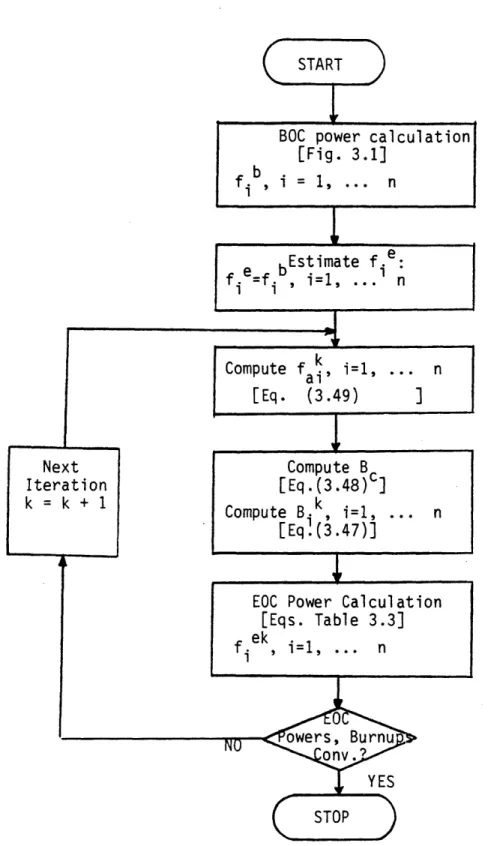
3.2 Flowchart for Synthesis Method... 78
3.3 ComputationalFlowchart for Integrated Burnup Method... .83
3.4 ComputationalFlowchart for Step-wise Depletion Method... .84
3.5 Maine Yankee Cycle 6 Core Loading and Fuel Characteristics at BOC... 87
3.6 Assembly Power Comparison at 1 MWD/kg... 89
3.7 Assembly Power Comparison at 2 MWD/kg... 90
3.8 Assembly Power Comparison at 4 MWD/kg... 91
3.9 Assembly Power Comparison at 6 MWD/kg... 92
3.10 Assembly Power Comparison at 8 MWD/kg... 93
3.11 Assembly Power Comparison at 1 MWD/kg Using Adjusted Para-meters... 97
4.1 Flowchart for Nodal Power Derivative Calculation at BOC... 117
4.2 Flowchart to Compute the Derivatives of Cycle and Assembly Burnups and of the Nodal Powers, using the Synthesis Method.. 122
4.3 Flowchart for Direct Search Method... 131
4.4 Unconstrained Maximum Burnup Search Algorithm... 132
4.5 Road Map of Convergence Progress for Burnup Maximization Al-gorithm... 135
LIST OF FIGURES (Continued)
page 4.6 Assembly Arrangement Generated by the Preliminary Direct
Search Method... 136 4.7 Final Assembly Arrangement Generated by the Conventional
Gra-dient Method... 138 4.8 Search Algorithm for Optimal Burnable Poison Allocation... 142 4.9 Maine Yankee Cycle 6 BP-free Core Depletion Results... 145 4.10 Maine Yankee Cycle 6 Core Results After Optimal BP Allocation 4.11 Constrained Maximum Cycle Burnup Search Algorithm... 149
5.1 Reactivity as a Function of Burnup for B C Poisoned and
BP-free Assemblies (3% U-235 Maine Yankee Lattice)... 170
5.2 Flowchart for the LRM-NODAL Core Model Computations... 172 5.3 Assembly Power Comparison at 1 MWD/kg Using Analytically
Estimated Parameters... 174 5.4 Assembly Power Comparison at 1 MWD/kg Using Adjusted
Para-meters... 175
5.5 Road Map of Convergence Progress for Burnup Maximization
Al-gorithm... 183
5.6 Assembly Arrangement Generated by the Preliminary Direct Search
Method... 184 5.7 Final Assembly Arrangement Generated by the Conventional
Gradient Method... 185
5.8 Final BP Allocation Results for the Maine Yankee Cycle 6 Core V> M2
A-1 Variation of [K D ] with Burnup and Reactivity... 193
A-2 Energy Release per Fission Neutron as a Function of Burnup... 197
A-3 Variation of D /M2 as a Function of Burnup... 203
12
LIST OF FIGURES (Continued)
A-5 Variation of Z l as a Function of Burnup... 205 al
A-6 Variation of D as a Function of Burnup...206
A-7 Variation of M2 as a Function of Burnup (LEOPARD)...207
A-8 Power Feedback Effects on D 1/M2. . . .. . . .. 210 B-1 Representation of 1/4 Core of the Maine Yankee Reactor, and the
Coordinate System for 2-D Nodal Solution of the 1 Group
LIST OF TABLES
Page
1.1 Typical Core Reload Planning and Scheduling: Time Frame
Prior to BOC... 17
1.2 Summary of Relevant Core Reload Optimization Work... 20
2.1 Power Versus Source Weighting: Eigenvalue Difference for Selected Cases... 41
3.1 Analytical Solution for Interior Node Integrated Flux... 52
3.2 Analytical Solution for Peripheral Node Integrated Flux... 63
3.3 Summary of the Nodal Power and Leakage Equations... 65
3.4 Summary of Coupling Coefficients, Leakage Constants and Nu-merical Estimates... 67
3.5 Quarter-Core BOC Estimated Data for Maine Yankee Cycle 6... 88
5.1 Summary of Relevant Core Reload Optimization Work... 158
5.2 Analytical Solution for Interior Node Integrated Flux... 164
5.3 Analytical Solution for Peripheral Node Integrated Flux... 165
5.4 Analytical Solution for the Net Neutron Currents Out of the Peripheral Nodes... 166
5.5 Summary of the Nodal Power and Leakage Equations... 168
5.6 Summary of Coupling Coefficients, Leakage Constants and Numeri-cal Estimates... 169
5.7 Equations for the Calculation of Derivatives Used in Core Reload Optimization Routines... 179
A-1 CASMO/LEOPARD Ratio for Parameters V, K, D 1/M2. .. . .. . . ..194
A-2 Energy Release per Fission (Mev)... 199
14
LIST OF TABLES (Continued)
page B-1 Analytical Solution for Interior Node Integrated Flux... 220 B-2 Analytical Solution for Peripheral Node Integrated Flux... 224
D-1 Main Variables Used in the LRM-NODAL Program... .. 239 D-2 Typical Interactive Initialization Session for the LRM-NODAL
Program... 241 D-3 Typical Printout of the Final Results of the LRM-NODAL Code.. 243
INTRODUCTION
1.1 Foreword
Currently, Light Water Reactors (LWRs) account for more than
three-quarters of the nuclear power plants operable, under construction or on order worldwide, with the Pressurized Water Reactor (PWR) comprising over two-thirds of all LWRs. The operation of these reactors over
their useful lifetime will, in the next several decades, make an impressive contribution to energy production. Moreover, if the
efforts currently underway on an international basis to implement the changes and innovations necessary to improve the viability of nuclear fission as a major energy source are successful, PWR-based technology is likely to retain a significant role well into the next century (M-1). Thus, under any plausible circumstances regarding expansion of nuclear generating capacity, the efficient operation and fuel management of
PWRs is of utmost importance.
The effort undertaken in the present research addresses a central
question in in-core fuel management, namely the optimization of PWR
core reload pattern and fuel composition. While the applications here are restricted to state-of-the-art low-enriched uranium fueled PWRs over a single burnup cycle, most of the methodology should be readily
16 1.2 Background
The core reload design process encompasses a complex set of decisions, spread over a period of time, with the final goal of specifying a core capable of producing a demand-imposed target cycle energy, at the minimum cost, with appropriate margins to assure that
given acceptable fuel design limits are not exceeded during any condition of normal operation, including the effects of anticipated operational
occurrences. These margins are detailed in a reactor's final safety analysis report (FSAR).
Usually, based on an energy demand forecast and consistent with the system optimization goals, the plant's target cycle burnup is defined in advance (--1.5 years) such as to allow time for the
necessary fuel cycle transactions: ore procurement, UF6 conversion, enrichment, and fabrication. Assembly design, material/service purchase transactions and their optimization, as may be seen in Table 1.1, proceed interactively. Based on target burnup and the expected state of the old fuel, the characteristics of the core are
specified: enrichment of the fresh fuel, reload pattern, and, if required, burnable poison (BP) loading. In general, optimization of
system energy costs leads to a preference for long cycles (to maximize the capacity factor), which, in turn, normally requires the use of BPs to suppress excessive power peaking and to ensure an acceptable (slightly negative) moderator temperature coefficient of reactivity at the beginning of cycle (BOC). Once the cycle length (and anticipated
Typical Core Reload Planning and Scheduling: Time Frame Prior to BOC
1) Specification Basis: 2) Specification Basis: Months of Energy Requirements: ... 17
Expected demand for the unit according to system optimization
of
a)
b)
3) Specification of
Uranium Ore and Enrichment: ... 14 Energy requirements
Expected state of old batches
Fabrication (hence, BP loading): ... 8
4) Fuel Cycle Design Analysis: a) Select Reload Pattern
b) Perform Transient and Safety Analysis (FSAR): b.1) If design conforms with FSAR's "core exposure
window": keep analysis for regulatory agency inspection.
b.2) If not: Submit analysis for regulatory agency
review (at least)...3
5) Flexibility for Contingencies (e.g. new or old fuel damage)
18
capacity factor) has been fixed the only component of the energy
cost left to optimize is the fuel cycle cost. Fuel cycle cost
optimiza-tion essentially corresponds to definioptimiza-tion of the fuel composioptimiza-tion and
core arrangement such as to minimize the sum of ore, enrichment and fabrication costs. After the enrichment has been irrevocably specified,
fuel cycle cost optimization becomes equivalent to finding a reload
pattern that maximizes the cycle burnup capability.
However, an overriding concern at any stage of the design, is the assurance that it meets safety limits and margins. For steady state operation design margins may be translated into limits on the core's enthalpy rise hot channel factor, which in a two-dimensional model corresponds to the radial power peaking factor. State-of-the-art core
analysis methods, in the form of sophisticated computer codes, are
available and used industry-wide for detailed reload licensing
calculations, to evaluate and ensure realization of the required margins. However, due to the cost and complexity of these analyses, it is highly
desirable that a candidate reload core, before being submitted to these full scope licensing calculations, meet optimal or near-optimal conditions regarding the assembly arrangement pattern and composition.
In addition to the need in the normal core reload design process, the
capability to generate acceptable candidate reload patterns becomes even more important under circumstances requiring fast evaluation of alternative designs, such as forced outage due to fuel failures, accidental assembly damage during reload handling, or.unplanned extended coastdown.
1.2.1 Previous Reload Optimization Work
In spite of significant efforts devoted to the problem, no standard methods, with industry-wide acceptance and an adequate compromise between simplicity and accuracy, are in general use to generate acceptable candidate core reload patterns meeting realistic optimality criteria. The most widespread approach is trial and error,
aided by "rules of thumb" derived from experience and insight.
Table 1.2 provides a succinct review of some of the most relevant
work dedicated to optimization and automation of the reload design
process. Approaches explored include heuristic methods, direct searches, mathematical programming (linear, dynamic, quadratic and integer),
variational methods, optimal control theory, perturbation methods, and combinations thereof. Optimization goals also vary: maximization of burnup or excess reactivity; minimization of power peaking, ore consumption, cycle costs, etc.
1.2.2 Linear Reactivity Model Work at MIT
The Advanced Linear Reactivity Model (ALRM), (where the well known linearity of assembly reactivity as a function of burnup is combined
with prescriptions relating power density to reactivity, and these, in
turn, used to compute the system reactivity) has been developed and
used at MIT to perform batch-size multi-cycle analyses of fuel
20
TABLE 1.2
Summary of Relevant Core Reload Optimization Work
Approach Objective U))-E S .M- or- U -Author(s) r- -CD -4-3 and
E O
- . -4 N Reference . ' - - ;- a)0-E
S-
(
-
S-E
Ur-E E E-
-Rieck [R-1] x x
Izenson [I-l x x
Downar [D-2] x x
Goertzel [G-1] x x
Wall and Fenech [W-1] x x
Melice [M-2] x x
Fagan and Sesonske [F-1] x x
Naft and Sesonske [N-1] x x
Suzuki and Kiyose [S-2] x x
Sauar [S-3] x x
Wade and Terney [W-2] x x x
Hoshino [H-1] x x
Goldschmidt [G-2] x x
Motoda, Herczeg, Sesonske [M-3] x x x
Ciechanowiecz [C-1] x x
Stout and Robinson [S-4] x x
Chitkara and Weisman [C-2] x x
Mingle [M-4] x x x
Motoda and Yokomizo [M-5] x x x
Terney and Williamson [T-1] x x
Lin, Zolotar, Weisman [L-1] x x
Ho and Sesonske [H-2] x x
Ho and Rohach [H-3] x x
Huang and Levine [H-4] x x
Colletti, Levine, Lewis [C-3] x x
Chang and Levine fC-4] x x
Ahn and Levine [A-3] x x
of the methodology, and application to fuel management is in preparation [D-1]. Hence, here only the most relevant aspects of this work, where it provides important background to the methodology being used and extended in this research, will be reviewed.
Sefcik [S-1],on purely empirical grounds, concluded, by analyzing core power mapsthat the power of a group of assemblies (usually a
batch), fg, and its reactivity pi, could be related by
where
e is an empirical constant.
Loh [L-2], using a modified one group theory, showed that a better relation would be
T (1-7)
f= _ e p. f (1 + e p.) (1.2)
-1
where
f is the average power for an aggregation of surrounding assemblies,
f is the core-average assembly power, and
Pi is the average reactivity of the aggregation.
Furthermore, Loh pointed out the similarities between his prescription
22
Kamal [K-1], extended Loh's approach to a cylindricized
represen-tation of an assembly and its surroundings, and developed another similar prescription:
f. (1 - 0. ~.)
f ' T i(1.3)
1 -
p.
where
6. and 6 are constants, depending on the ratio of the assembly cross sectional area to the neutron migration area.
All the authors just cited used the same relation to compute the system reactivity, ps
n -m m
Ps i;i
pi
+ (p - a) (1.4)where
n is the number of assemblies,
m is the number of peripheral assemblies, and
at is an empirical constant relating the core radial leakage and peripheral power fraction (leakage reactivity decrement).
Subsequent work built upon the results of these initial
investiga-tions. Izenson [I-1] used Kamal's prescription in an automated PWR
reload design optimization method, where the optimality goal was the
minimization of the radial power peaking factor. Downar [D-2] used Loh's prescriptions, in work performed concurrently with the present research, to develop an integrated method for mid-range in-core PWR
core design. Montaldo-Volachec [M-6] correlated linear reactivity
model parameters for a wide range of PWR lattices and uranium enrichments. Malik [M-1] extended these correlations to plutonium-based fuels.
Kamal [K-2] and Malik et al. [M-7] worked on PWR axial power shape optimization.
1.3 Research Objectives and Organization of the Report
The primary objective of the research reported here has been the development of a methodology for PWR core reload pattern and fuel composition optimization. Cycle burnup is defined as the optimality criterion, and efforts are concentrated on developing an ALRM-based
methodology, having an adequate compromise between simplicity and
accuracy, able to identify and generate core configurations and
compositions meeting this condition under restrictions on power peaking, assembly placement and burnable poison loading.
Ease of computation and transparency of approach are highly desirable features in iterative design optimization models; and
simplification, whenever possible without altering the essential nature of the problem, has often been the key to success in complex optimization tasks. Consistent with these arguments, the evaluation and extension of the Advanced Linear Reactivity Model of PWR core behavior constituted an important subsidiary goal in this work.
24
The research efforts are reported as follows:
* In Chapter Two a succinct review of state-of-the-art methods for core analysis and the foundations of the core physics methods and models used throughout this work are presented. * In Chapter Three, an ALRM-based coarse-mesh nodal method
is developed by analytical means. Beneficial empirical adjustments and corrections are discussed, and the accuracy
of the method tested against state-of-the-art results.
* The optimization methodology is presented in Chapter Four, in conjunction with some applications.
* In Chapter Five, the research is summarized and the main
conclusions and recommendations for future work are discussed. e Finally, subsidiary derivations and analyses in support of
developments in the main text, along with a listing of the computer code embodying most of the methodology, are presented in appendices.
REACTOR PHYSICS METHODS AND MODELS
2.1 Introduction
Reactor physics calculations provide the basic information for in-core fuel management analysis. The major objective of these neutronic calculations is the prediction of core parameters such as reactivity, reaction rates (hence, power densities and burnup) and
isotopic compositions. The level of accuracy required and thus the sophistication of the analysis methods to be used is problem specific. Well developed and very accurate neutronic computer codes are available to perform detailed analysis of LWR cores. One such example is EPRI's Advanced Recycle Methodology Program (ARMP) package of core analysis
codes. However, the high cost and complexity associated with the
use of these programs for multi-variable optimization studies, particularly when the general degree of uncertainty inherent to the problem being
modeled (e.g. scoping or preliminary optimization studies) is much
larger than the accuracy provided, clearly points to the need to develop simpler and more cost efficient models based on analytical and empirical methods.
In this chapter, a general overview of state-of-the-art
licensing-level methods is provided, with emphasis on the codes used to to
26
models and approximations, constituting the foundations for a PWR core analysis method, compatible with the requirements of the optimization procedures developed in this research, are discussed.
2.2 State-of-the-Art Nuclear Analysis Methods
The Boltzman neutron transport equation is the fundamental relation for nuclear reactor analysis [H-5]. It is a conservation equation for the angular neutron density as a function of position, direction of motion and neutron energy, describing the interaction of neutrons with their environment. However, for real-life situations, its solution is either
too costly or impractical, and lower order approximations, with degree
of accuracy compatible with the requirements of each specific situation,
are used in reactor analysis. For most applications the main workhorse
is the neutron diffusion approximation. In general, a further
assumption of separability of space, time and spectrum effects is also necessary. Under this assumption, the core is divided into regions having similar characteristics, for which few-group constants are
generated in independent spatially-simplified computations, and then
used in few-group spatial calculations. In addition, continuous core depletion effects are evaluated in discrete steps.
Analysis procedures, described in standard fuel management and
reactor physics texts (e.g. [S-5], [H-5], [G-3]) are problem dependent, and their details are, for the most part, beyond the scope of this report. Nevertheless, a succinct description of some state-of-the-art
computer codes is relevant due to their use in current core licensing analyses, and especially where they were used to provide supporting results and calculations for the present work. Figure 2.1 shows a
typical sequence of calculations for PWR licensing analyses, identifying several such programs.
2.2.1 Spectrum Calculations
The LEOPARD code [B-1] has been extensively used ([G-4], [C-5], [S-1], [L-2], [K-1], [M-6]) and benchmarked ([C-5], [G-4]) at MIT by previous researchers, and its methodology is well documented. Despite
having been superseded in rigor and complexity by newer programs, it is
still one of the most widely used neutronic codes in the nuclear industry. In an evaluation against newer codes (LASER and EPRI-CELL) it was shown to be in better agreement with experimental results, albeit for rather simple lattice configurations [L-3].
LEOPARD is a zero-dimensional spectrum dependent depletion program used to compute neutron multiplication factors and few-group cross-sections as a function of burnup for square or hexagonal lattices, represented
by unit fuel cells or supercells (cell plus extra region). The unit cell consists of fuel, gap, cladding and moderator, and the extra-region represents fuel assembly water holes, control rod sheaths, spacer grids and inter-assembly water gaps. The microscopic cross-section library for the MIT version (EPRI-LEOPARD) is derived from the ENDF/B-IV data set. The calculation at epithermal energies is done using the
28
2.1 Representative Sequence of Calculations for PWR Licensing Analysis
MUFT [B-21 sub-program while SOFOCATE, using the Wigner-Wilkins
treatment, handles the thermal calculations [A-2]. Thermal disadvantage and fast advantage factors, and an iteratively adjusted resonance
self-shielding factor, are used to correct for cell heterogeneity.
CASMO [E-1] has also been used and described at MIT [D-2]. It is
a recent multigroup two-dimensional transport theory code for burnup calculations of BWR and PWR assemblies or cells. The program handles
a geometry consisting of cylindrical fuel rods of varying composition
in a square array, and is capable of treating fuel rods loaded with gadolinium, burnable absorber rods, cluster control rods, water gaps
and other realistic assembly features. CASMO generates few-group
cross-sections and reaction rates for any region of the assembly, as a function
of burnup.
DIT [J-1] is a Combustion Engineering code, with similar capabilities to those of CASMO, also employing transport and collision probability methods. CASMO and DIT, in turn have much in common with their precursor WIMS; reference [S-5] describes their common methodology in considerable
detail.
2.2.2 Spatial Calculations
Spatial calculations are performed, for the most part, using
fine-mesh finite difference schemes or by coarse-mesh finite-element or nodal techniques.
30
PDQ-7 [C-6] is a widely used production code that has been
previously used for PWR core analysis at MIT ([S-1], [L-2], [K-1]).
It solves diffusion-depletion problems in up to three spatial dimensions,
with a maximum of five neutron energy groups, in rectangular, spherical, cylindrical or hexagonal geometries. The program discretizes the
energy variable and finite-differences (central) the spatial part of the diffusion equation, and can perform eigenvalue, boundary-value,
adjoint and fixed-source calculations.
The so-called coarse mesh computational methods are efficient
techniques to perform two or three dimensional reactor calculations. The reactor is represented by large (typically quarter or full assembly)
homogenized regions. Representative of this category are: the two-group
analytical nodal method QUANDRY [S-6], developed at MIT; and the
modified one group theory (sometimes empirically-adjusted) schemes, such as FLARE [D-71, TRILUX and SIMULATE [V-1], much in use currently for fuel management purposes.
2.3 Foundations for an Optimization-Oriented Core Analysis Method
As has already been stressed, depending on the problem at hand, an adequate compromise between solution accuracy and efficiency has to be established. Speed and ease of computation are extremely important in
iterative optimization schemes. Furthermore, uncertainties inherent to
complexity and cost associated with using licensing-level codes for
optimization and screening purposes. In this section, key components of the nuclear analysis method developed and used in the present
research are introduced. Then, some intrinsic assumptions and limitations, as well as simplifications and approximations are discussed.
2.3.1 A Modified One Group Model
A modified one group theory method, known as the "one-and-one-half" group model, can be derived from the two-group diffusion equations
([H-5], [G-3], [S-5]): fast group:
--
v
+ al 1 + 212 *1 - 1~ I(vZf+ Vf 2 2) = 0 (2.1) thermal group:-V - D2 2 + Za2D2 - E12D1 = 0 (2.2)
where X is the neutron multiplication factor (eigenvalue), v the
average number of neutrons released per fission, 212 the macroscopic downscattering cross section, and with 1 and 2 standing for fast and
thermal groups, respectively, the remaining constants are:
D = diffusion coefficient;
Z = macroscopic absorption cross section; E = macroscopic fission cross section.
32
The essential approximation of the one-and-one-half group model is that thermal neutrons are absorbed at the point of removal from the
fast group, or, equivalently, that thermal leakage is neglected
(i.e.: V22 = 0). Thermal leakage is an order of magnitude smaller than fast leakage in LWRs (and, furthermore, the approximation may be later partially relaxed, as discussed in section 3.2.5.1). Then Eq. (2.2) becomes:
Ea2 2 =1 2 1 (2.3)
Substituting 2 from this expression in Eq. (2.1), and assuming D1 constant over the reactor, gives
-DV2 + Ea 1 + 1 + 2 1 = 0 (2.4)
1 X V f1 f a2)
Defining the migration area (also referred to as Fermi age, T, in the
literature), as:
M2 - D1/(Eal + E12) (2.5)
and recalling that the local two-group infinite medium neutron multiplication factor is:
k = + Zv2 )a + (2.6)
CO v
El +\)Z2 _ (al + 12)5
Eq. (2.4) may be re-arranged as:
V2 +( - 1) 1 = 0 (2.7)
Furthermore, defining the local reactivity,
(in a similar fashion to the "adiabatic" approximation), ps = 1 - 1/X
an equivalent expression for Eq. (2.7) is obtained, namely: 2 ~__ s_
2 + (P )
For a critical reactor (i.e.: X = 1, ps= 0) Eqs. (2.7) and (2.10) become V20 +
1 (1 -p
or, equivalently,
V2 + (km- 1
Recognizing that the local thermal power density can be written as: q'' ' = K Efi (D1 + K Zf
2 42 (2.13)
where K is the energy released per fission, and, with the aid of
Eqs. (2.3), (2.6) and (2.5), Eq. (2.13) can be re-written as:
(2.14)
The fast flux and local thermal power density, using Eq. (2.8), may be related by:
4)1 = q' M
2
1 (1 - p)
(2.15)
An equivalent relation holds after integration over the volume of
the node:
I
V dv = ' __ KDl (1 - p). f1 . Q /n (2.16) (2.9) 1 = 0 (2.10) 1 = 0 ) -I M (2.11) = 0 (2.12) = D q' ' ' = k ct 134
where fi is the normalized nodal power fraction:
f q'''dv = q''' n (2.17)
in which Q is the core thermal power, v is the volume of the node (in this work taken to be an assembly), and n is the number of nodes in the core.
2.3.2 System Reactivity Balance and Eigenvalue
It is important to emphasize that, according to Eq. (2.9), the system reactivity is a modified eigenvalue determining the core criticality and thus the null reactivity limited end of cycle (EGC). Furthermore, the calculational procedures developedin the next chapter to solve the one-and-one-half group model, are based on
Eq. (2.11), which requires ps to be always zero. This condition is
satisfied by performing a reactivity balance, and determining a reduction in the local reactivities (simulating the soluble boron
poisoning process in real life core operation).
Equation (2.10) may be re-arranged and integrated over the
core volume, V, to yield
fV - dv + JV V -D1W1 dv
p=
d
(2.18)s dv
Since there are no internal flux discontinuities, application of the Divergence Theorem to the last term in the numerator leads to the following equivalence:
v- D 1vI1 dv =
fV
Ls
dA- D I W1 (2.19)
where S is the cuter surface of the core. This term corresponds to the loss of neutrons due to leakage out of the core. For a core with
n nodes, of which m are on the periphery, defining J i as the leakage
rate out of peripheral node i, and with the help of Eq. (2.16),
PS becomes: n n
p .f i - J .
i=1 K 1=1
PS n
i=1 1
Defining a normalized neutron source as
f. i =1 V V K. 1 V
and a "leakage reactivity",
m pL J PL=i=1 i - -n i=1
PS may be written as,
IS
dA D1 V 1 D 1 - 1 dV n PS= Si P-i =1 (2.20) (2.21) (2.22) (2.23)36
From this reactivity balance, the requirement of setting Ps=O may be fulfilled by reducing the local nodal reactivities by ps. Or, in an even closer approximation to reality, the quantity p spcorresponding to the dissolved boron reactivity required for criticality, may be calculated with the aid of the local-spectrum-dependent relative boron worth factors,
-1 = i 1 14 L ( 2 .2 4 )
. s W
and the necessary local reactivity reduction,Api, in each node is given by:
APi = SP . Wi (2.25)
The leakage calculation is detailed in the next chapter, as part of the coarse mesh nodal method. However, in view of the results of
this section, it is important to stress that pS represents a modified eigenvalue, which is set to zero in an iterative numerical solution
scheme. Therefore the perturbation approach (which implies what amounts to source square weighting), proposed in ref. (D-2) to perform a
steady-state reactivity balance, is not conceptually appropriate. Otherwise, it is interesting to note that Eq. (2.11) is self-adjoint, and the flux can be also interpreted as the local importance.
2.3.3 The Linear Reactivity Model (LRM)
The linearity as a function of burnup of both the unpoisoned
reactivity and the reactivity attributable to "well designed" burnable poisons for PWR fuel assemblies has been exploited to develop simple
tasks [L-2]. In the core model being developed in the present research this feature will be fully used and play a key role due to the
simplicity it allows in the description of the otherwise rather complex phenomena of fuel and burnable poison depletion.
2.3.3.1 LRM for Unpoisoned Fuel Assemblies
It is a well established fact that the unpoisoned reactivity of an assembly, p, defined by Eq. (2.8), varies linearly with burnup
[K-2], [S-1], [L-2], [M-6), [M-7], even though all of the reasons
and compensatory mechanisms that cause this behavior have not yet been fully explained. This variation may be represented mathematically as:
p= pO - A B (2.26)
where
p0 = extrapolated Beginning-of-Life (BOL) reactivity
B = assembly burnup, MWD/kg
A = slope of the linear curve-fit of p versus B, kg/MWD.
The intercept P0, determined by extrapolation, corresponds to the value after saturating fission products (xenon, samarium) have come to equilibrium. (Therefore, at BOC, the LRM may not provide an accurate description of the core state).
A remarkable fact is that the linearity holds for the entire burnup span of practical interest for LWR uranium fuel, over a wide range of enrichments and all fuel-to-moderator volume ratios (VF /VM).
38
Figure 2.2 displays plots of reactivity as a function of burnup for
a representative PWR lattice and enrichments from 2.0 w/o to 5 w/o. Furthermore, besides enriched uranium, the linearity holds for other fertile/fissile combinations, with the exception of Th/Pu.
Montaldo-Volachec [M-6], using LEOPARD results, developed
correlations for the parameters p0, po/A and A for uranium LWR fuels with enrichments spanning the range from 2.5 w/o to 4.5 w/o and VF/VM from 0.5 to 1.0. Malik [M-1] subsequently extended this
methodology to plutonium/uranium lattices. Montaldo-Volachec's results for the standard Maine Yankee lattice (VF /VM::0.60393) are:
p0 = 0.357936 - 0.404919/X (2.27)
A = 13.7304 - 1.52734.Xp, 10-3 kg/MWD (2.28) where X is the U-235 enrichment, w/o.
It should be noted that LEOPARD results are sensitive to the
length of the burnup steps employed. For example, for runs using steps of 1 and 5 MWD/kg, after 35 MWD/kg the computed reactivity in the latter case exceeded that of the former by 0.01. Reference [R-2] indicates that steps of 2 MWD/kg are adequate for most purposes.
2.3.3.2 Burnable Poison Modeling
Following the lead of Loh [L-2], here an idealized model for burnable poisons will be adopted: that is, a poison material is
0.2 0.1 >1 4J 0.0 -0.1 -0.2 w~ '.0 Burnup (KWD/kg)
40
and then burns out at a uniform rate over the cycle, leaving a small residual at EOC. Besides the ease of modeling, such burnable poison behavior is desirable for other reasons. Uniformity of depletion and
EOC burn-out are, in general required to avoid excessive power peaking; and usually the maximum cycle burnup, an optimization goal, is
associated with power histories that require the burn-out point to
coincide with the EOC. Furthermore, this modeling is not physically unrealistic, since actual burnable poisons can be designed that
approximate very well this ideal behavior: in fact, a black cylindrical absorber depleting in "ash-layer" fashion can be shown to exhibit
linearity in a formally exact manner [H-6].
Figure 2.3 displays a generic p versus burnup trace for an
assembly with "ideal" burnable poison. Figure 2.4 is the plot of
CASMO-computed reactivity traces as a function of burnup for two
Maine Yankee, 3 w/o U-235 enriched, assemblies; one of which contains eight B4C shims. The boron-based burnable poisons' characteristic
non-linear "tail" is evident close to the burn-out point. In the
neutronically blacker gadolinia burnable poisons, linearity persists
until burn-out, even though higher residual reactivity results,
mostly due to transmutation of the even-A gadolinium isotopes present.
The (somewhat over simplified) ash-layer model [H-6] may be used to demonstrate the feasibility of matching any desired initial hold-down reactivity and depletion (linear) slope combination, by
appropriately choosing the number and the loading of poison pins in the assembly [D-1]. Roughly speaking, the initial hold-down
SEGREGATED:
Without Burnable Poison
Residual Poison Burnup (KWD/kq) Idealized Burnable Poison Depletion Trace
Slope and intercept are varied to suit particular
needs-to be optimized . >, N N N N N
With Burnable Poison
)
ResidualPoison
B = EOC Point
Fig. 2.3 Generic p versus Burnup Trace for Assembly with Burnable Poison
0.0
0.0
0.25 0.20 0.15 0.10 '0.05 0 -0.05 -0.10 -0.15 --0.20 -0.25 -0.30 0 5 10 15 20 25 30 35 40 45 50 Burnup (MWD/Kg)
Fig. 2.4 Reactivity as a Function of Burnup
(3% U-235, Maine Yankee lattice)
for B C Poisoned and BP-free Assemblies
4-, .4-, U w cx soluble ,on pm soluble boron ... ...
is related to the number of poison pins and the slope is related to
the poison loading in each pin.
2.3.4 Evaluation of Simplifications, Approximations and Assumptions
The basic relations for PWR core modeling, consisting of
Eqs. (2.11), (2.15), (2.23), and the linear reactivity model equation, Eq. (2.26), have now been derived or justified. Consistent with
the goal of developing a methodology with an adequate compromise between accuracy and simplicity, some simplifications in the solution of the equations will next be evaluated. Aspects regarding the
adequacy of the linear reactivity model will also be discussed. Then the basis will exist for proceeding to solve the equations, and further develop the model in the next chapter.
2.3.4.1 Power and Flux Relationship
A detailed parametric analysis of the factor
[
,which according to Eqs. (2.15) and (2.16) relates thermal power and flux, is presented in Appendix A. As a result of several compensatoryeffects, LEOPARD predicts that this factor remains quasi-invariant as a function of burnup and local reactivity for typical PWR lattices and
compositions, at around 0.50 neutron - cm/MeV. CASMO predicts a slight dependence on local reactivity (or burnup state), which can
be linearized to yield:
44
where, for example, for the Maine Yankee lattice, at 3% U-235, with
R2 = 0.9335,
CI = 0.4919 C2 = 0.1450
Since p varies between roughly ±0.2, the corresponding variation in
[
P-] can be seen to be rather small. Moreover, if the degree of realism is increased to include power/temperature feedback effects and a more detailed (nuclide-by-nuclide) computation of capture gamma energy, the variation of[V
M] with burnup (hence reactivity) would be decreased and more linear in the CASMO results.This parametric invariance (or linear dependence on local reactivity) is a fortunate finding, which can be taken advantage of
in the core modeling. By solving Eq. (2.11) and incorporating this simple flux versus power relationship, expressions may be developed to yield directly the nodal power.
2.3.4.2 Power Weighting of Reactivity
Power, instead of source-weighting of local reactivities to
perform the system reactivity balance (i.e., eigenvalue calculation),
has been used previously [S-1, [L-2], [K-1], under the assumption that the variation of K/V with burnup was negligible. Here, in view of the results of Appendix A, the numerical error of this approximation is
evaluated for selected, extreme, but simplified, cases of
Table 2.1. These results indicate that the consequences of the
approximation are not severe. Since the power weighting consistently slightly over estimates the system reactivity, it should contribute to a bias on the high side in cycle length (burnup) calculations. The errors in nodal power fraction calculations, due to the
approximation are completely negligible.
Hence, Eq. (2.24) may be approximated by:
PS f i - L (2.30)
2.3.4.3 Spectral Ambiguity
The LEOPARD program, when computing the few-group cross sections and the reactivity as a function of burnup, uses an infinite medium
spectrum and enforces criticality by adjusting the buckling. In a reactor, where local criticality is maintained by a combination of buckling (i.e.: leakage to and from neighboring assemblies) and by addition of control absorber, the LEOPARD-convention is not reproduced exactly, and consequently the actual local reactivity may differ from that predicted by the linear reactivity model. Another situation where spectral changes may induce significant local effects, arises at the interface of nodes with differing compositions. These effects are especially pronounced at the core periphery (reflector) where corrective measures are required.
TABLE 2.1
Power* Versus Source Weighting: Eigenvalue Difference for Selected Cases
Batch Burnup 0 10 15 20 30 40 Results (MWD/kg) p 0.223 0.131 0.084 0.038 -0.055 -0.147 _ ( ai. 0. 0.00093 cii 4-i (~) *S.- *4-sCr a)~ r- S-KV79.6 77.5 76.7 76.1 75.0 74.4 0' (MeV/neutron) C, C)
x
x
x
0.15406 0.15533 0.00127 (Pinsasedx
x
x
0.06187 0.06280 0.00093 x x x 0.11850 0.12106 0.00256 x x x 0.08341 0.08733 0.00392*For assumed power fractions of 1.4, 1.0 and 0.6
-r~b
when more soluble poison is required. Because boron suppresses preferentially the thermal flux, whereas in adjusting the buckling fast leakage dominates, the spectral mismatch becomes most pronounced when more boron is present. In the poison-free condition, at EOC, reactivities should be well predicted by the LEOPARD-based linear
reactivity model.
One way to reduce these spectral effects is to use the cycle-average boron concentration in the LEOPARD calculation, thus hardening the
spectrum for which the cross sections are computed, and then later excluding the boron cross-sections from the reactivities. Moreover, the spectral ambiguity effects arising from changes in the ambient spectrum due to the presence of soluble poison can be mitigated by applying properly defined weighting factors to the local poison-related reactivity reduction (W1 of Eq. (2.25)), such as to incorporate only the net effects. The mismatch at interfaces of differing media may be partially included in differential thermal leakage corrections such as that proposed by Becker [B-3].
More detailed discussions of this subject are documented in references [D-1] and [S-5]. In general (except where noted), refinements related to these fine points will not be justified in the present work: the resulting errors are generally inconsequential.
48
2.3.4.4 Superposition of Reactivity
In addition to spectral ambiguity, another aspect associated with modeling of soluble boron as a control poison is the validity of
the superposition of local reactivities.
The local reactivity, defined by Eq. (2.8) may be written as:
(V9f1)1 + VEf 2 D2) - (z1 )1 + Ea2 2) (2.31)
Vfl41 + Vsf2 D2)
which suggests the representation of absorber addition, such as soluble boron, as a reduction, Ap, in the local reactivity. However,
due to the spatial variation of the spectrum throughout the core, the same amount of absorber will yield different local Ap.. This
additional effect may be corrected for by associating local relative weighting factors, WI, as shown in Eq. (2.25), which correspond to normalized relative boron worths.
It should be pointed out that in the case of burnable poison
modeling, as described in section 2.3.3.2, the spectral effects are
accounted for implicitly. The local BP reactivity decrement, as a function of burnup, is given by the difference between the unpoisoned and poisoned traces, each of which incorporates the appropriate
2.4 Chapter Summary
In this chapter the state-of-the-art computer codes used to provide results and supporting data for the present research, namely LEOPARD, CASMO, DIT and PDQ-7, have been briefly described. Then, the basic relations providing the foundation for an optimization-oriented core analysis method have been derived or justified.
Inherent assumptions and approximations, as well as possible simplification have been discussed and evaluated.
50 CHAPTER 3
A COARSE MESH NODAL METHOD
3.1 Introduction
Nodal methods [H-5] [G-3] [S-5] provide an efficient and accurate means of analysis whenever a reactor may be represented by regularly repeating, internally-homogenized regions - nodes - as is the case for PWRs, whose array of geometrically similar assemblies normally constitute such a configuration. In the previous chapter, a
consistent set of relations capable of describing core behavior, on an assembly level, have been derived, along with suitable approximations and simplifications. Specifically, Eq. (2.11) constitutes the basis for spatial diffusion calculations, coupled with the use of Eq. (2.24)
for eigenvalue determination (or equivalently, system reactivity
balance computation); and the linear reactivity model has been shown to provide a simplified and accurate description of the local
reactivity as a function of burnup. Although approximate, as pointed out previously, those prescriptions provide the basis for the coarse mesh nodal method to be formulated in this chapter. In PWR fuel management, the axial behavior is, normally, rather
predictable, hence a two-dimensional representation of the core
In what follows it is assumed that methods are available to the user (e.g. LEOPARD) to determine average node (assembly) characteristics
(local reactivity as a function of burnup). Refer to Appendix B for supplementary details in support of the analysis in this chapter; in particular Fig. B.1 is a one-quarter core representation of
the Maine Yankee Reactor, showing the nodal coordinate system used in Appendix B and in this chapter.
3.2 Derivation of the Nodal Equations
In Appendix B a detailed analytical solution of the
"one-and-one-half" group theory equation has been developed. The main assumptions
made were: the continuity of fluxes and currents at the nodal
inter-faces; the invariance of the fast group diffusion coefficient throughout
the fueled nodes; and furthermore, the criticality of the core
(i.e., ps=O), as required to validate Eq. (2.11). Starting with
these analytical solutions, the nodal flux and power expressions will
be obtained in the subsections which follow.
3.2.1 Interior Nodes
For an interior node, the solutions for the flux integrated
TABLE 3.1
Analytical Solution for Interior Node Integrated Flux
X-direction:
2
(ijai
2 (3.1)
. csch(a . h) tanh(atij h/2) tanh(ai+ 1,j h/2 + . a csch(a . h) tanh(ax1j h/2) tanh(ai_.1 h/2)
1-1,j i-1,j Ii-,3 - OLil~ i+1,jai+1,j i+1,3 ti O -l
-coth(a [o h/2) th h/2)
I[12)
tanh(a an 1 h/2) +-I tanh(a nhcx+ h coth(a h/2) tanh(xi+,j/2 aa tanha h/2I1~ h/2). h/ i+1~ tah~~ h/2-
ii3
1,'i - + i i+1, j ai +1 j 3
Ocx cxiil ij a cx ic
IL
1X 1+1,3J
a ii ..~Y-direction:
ijl
2 (3.2)
. csch(6.. h) tanh(6 h/2) tanh(6 h/2) + t. csch(6 h) tanh(6 h/2) tanh(Bij+1 h/2)
+ 1 6. . + h ) -i 'd' +. . + 6( j+h
1 33, i1[ctj-1. /2l13nv. i___j+1__
coth(6j h/2) tanh(B i +1 h/2) ~tanh(6i h/2) tanh(6 j- h/2) + coth(6i h/2) tanh(6 _ h/2) "tanh(r8i h/2 tah(6ij+1 h/2
2
ij 6 6 6 6 6 + i,j+1 ]
Lcoh(l
I [ . .J L
13 iij4JL
i i+Subject to: B2 = aL2 + 62
as Eqs. (3.1) and (3.2), respectively. Both equations are subject to the condition expressed by Eq. (3.3)
2 2 2 p..
B =t a + 6 i = - 2 7 (3.3)
(1-p.) M.
Expansion of the hyperbolic functions provides the approximation necessary to the derivation of the simplified nodal expressions. For a generic Xh variable the following expansions hold within the
limits stated [D-3]: csch (Xh) -- + -- (Xh) 3 X h +.-.., [(Xh)2 2 (3.4) + Xh- (Xh)3 + . 1 + 2 ~''
)
2< 2] (3.5) tanh T) - (Xh) 3 + Xh 122Any degree of accuracy (within the limits stated) is possible, depending on the number of terms of the expansions that are retained.
Here the objective is to obtain an approximation appropriate for h <20 cm; M 2 50-55 cm2; and a broad range of reactivities, i.e.:
101 < 0.25. Several approximations have been tested against
full-scope one-dimensional analytical benchmarks (using the corresponding
trigonometric functions instead of their hyperbolic counterparts, <
2]
(3.6) h 2
54
where appropriate). The approximation judged to have the best compromise between simplicity and accuracy was to neglect terms of third and higher orders in the expansions. The relative error in
nodal power was always less than 3% for realistic cases; and higher only for clusters of assemblies all of which have very high or very
low reactivity. As expected, a reduction in h (e.g. using
quarter-assembly nodes) produced very good accuracy, even for those extreme cases.
Neglecting all terms that are of third and higher order in the expansions (hence, retaining second order accuracy), Eqs. (3.1) and (3.2) yield respectively:
2 2
.
1
-a~-,
h
2) i-1, 6 2 (1 2 h2) ~ij-1 -~ ij-1 6 IJ2 (1 and 2 h 2 + . i+1,jh 1+1,3 6 2 h 2 ij+1 2 69. h2 + 13) (3.7) (3.8)Equations (3.7), (3.8) and (3.3) may be solved for , to give: )kj (1 - a2 2)+ -11 - 6 h2 k=1-1 6 6 kfi Vi (3.9) 1 4 + 6 /
Note that estimates for the directional apportionment of the nodal
2 2
bucklings, a and 6, could also be obtained by the addition of an extra
loop in the Gauss-Seidel iterative solution process. Due to Eq. (3.3)
2 2.
only the ratio between a2 and 63 is needed, and this relation may be
*2 *
computed by estimating a. and 6 from Eqs. (3.7) and (3.8) as follows:
kj1 1 - a2 h 2 k=i-1 \ 6 / 3 3 k1i Uk (1 h5)
j
(3.10)
h and 2 (..L
1
2
h 2
ik k h2 k=j-1 6I
* 3 kj -1 (3 h 2L..
k~ by *2 *2 (At each iteration the ratios provided by a /g, together with Eq.
(3.3) could allow the computation of the directional apportionments of the nodal bucklings. However, due to the small numerical impact of the as and 3s in the numerator of Eq. (3.9), and to avoid the
extra calculational requirements, another simplification, called here