Comparative Haematology International ( 1998 ) 8:108-116
© 1998 Springer-Verlag London Limited
COMPARATIVE
HAEMATOLOGY
[NTERNATIONAL
Technical Paper
Evaluation of the QBC-Vet Autoread Haematology System for Domestic
and Pet Animal Species
R. H o f m a n n - L e h m a n n ~, D. W e g m a n n l, G. C. W i n k l e r 1'2 and H. Lutz I
~Clinical Laboratory, Department of Internal Veterinary Medicine, University of Zurich, Zurich, ZNovartis Crop Protection, Experimental Toxicology, Stein, Switzerland
Abstract. A comprehensive evaluation was initiated to
determine the suitability of the QBC-Vet Autoread haematology system for veterinary purposes in domestic and pet animal species. The system determines haematocrit (HCT), haemoglobin (HGB), white blood cell (WBC) count, granulocyte count, combined lymphocyte and monocyte count (L/M), platelet count, as well as eosinophil and neutrophil counts (canine samples only), and reticulocyte count (canine and feline samples only). Linearity assessed for a canine sample usually surpassed the physiological range. Within-batch precision was very good for the majority of the parameters in feline and canine samples: Coefficients of variation (CV) were below 5.5% for HCT, HGB and WBC. In order to test the accuracy of the system with respect to reference methods, a total of 300 blood samples from the Clinics of Internal Veterinary Medicine and Surgery (101 canine, 99 feline and 100 equine) were analysed. Strong linear correlation was demonstrated for HCT, HGB (r>~0.96) and WBC (r~>0.93) based on high correlation coefficients and narrow confidence intervals. A somewhat higher degree of variation from the estimated regression lines was found in differential blood cell counts, especially for eosinophil counts of the dog where the automated reader erroneously attributed some lymphocytes or monocytes to eosinophil counts. Accuracy of the system was also assessed with respect to clinical relevance of results. The majority of leukocytosis (50 of 53), neutrophilias (3 of 4), or eosinophilias (4 of 5) was detected properly by the QBC-Vet Autoread haematology system, but only 20 out
Correspondence and offprint requests to: H. Lutz, Clinical
Laboratory, Department of Internal Veterinary Medicine, University of Zurich, Wintherthurerstr. 260, CH-8057 Zurich, Switzerland.
of 35 leukopenic samples were identified correctly. The system detected the presence of reticulocytes in the majority of feline (9 of 10) and canine (6 of 7) samples with a regenerative anaemia. Unexpectedly, platelets of cats were measured with high within-batch precision (mean CV = 4.64%). No 'streaming' effect (no discrimination between erythrocytes and granulocytes) was observed with this advanced QBC system. The system was found to be easy both in handling and interpretation of results. The buffy coat profile appeared particularly useful and informative. In conclusion, the QBC-Vet Autoread-System has excellent analytical properties and is well suited for veterinary purposes.
Keywords: Canine; Equine; Evaluation; Feline; QBC-
Vet Autoread haematology system; Veterinary haema- tology
Introduction
Haematology is indispensable to assess the health status of patients in veterinary practice. Analysis must be quick and accurate to be useful. The QBC-Vet haematology system (QBC = quantitative buffy coat) was introduced into veterinary medicine at the end of the 1980s and proved to be useful in veterinary practice (Brown and Barsanti 1988; Fischer et al. 1989; Meister et al. 1990). Now an advanced model QBC-Vet Autoread haema- tology system is available (Paul et al. 1994; Knoll and Rowell 1996). The system has been enhanced with an automated reader and printer, and allows the determina- tion of additional parameters. The system uses a method that relies on the fact that blood cells have a distinct
Evaluation of the QBC-Vet Autoread Haematology System
specific gravity, and react differently upon staining with a fluorescing dye (Jackson 1961; Wardlaw and Levine 1983; Sallitt et al. 1985). The reader gives a profile of the fluorescence intensity (buffy coat profile curve), and calculates the number of cells from the width of the different populations (Knoll and Rowell 1996). The enhanced version has not yet been extensively evaluated for veterinary use. Therefore, it was the aim of the present study to evaluate the enhanced QBC-Vet Autoread haematology system for canine, feline and equine samples, and to review the benefits of the system for veterinary practitioners.
Materials and Methods
System Description
The QBC-Vet Autoread haematology system (Idexx Inc., Westbrock, ME; distributor Germany: Idexx GmbH, W6rrstadt, distributor Switzerland: Provet AG, Lyssach b. Burgdorf) is an advanced version of the QBC-Vet haematology system (Brown and Barsanti 1988; Fischer et al. 1989; Meister et al. 1990). An automatic reader and a printer have been added (Paul et al. 1994; Knoll and Rowell 1996). The QBC-Vet Autoread haematology system allows the determination of the following parameters: haematocrit (HCT), haemoglobin (HGB), mean cellular haemoglobin con- centration (MCHC), white blood cell (WBC) count, granulocyte count, combined lymphocyte and monocyte count (L/M) and platelet (PLT) count. In addition, measurement of eosinophils and neutrophils in canine blood samples is possible. Reticulocytes and nucleated red blood cells in samples of both, dogs and cats, are estimated by the QBC-Vet Autoread haematology system (Knoll and Rowell 1996).
As with the earlier model, the QBC-Vet Autoread haematology system consists of a microcentrifuge unit, precision bored glass capillaries (diameter 1.683 ± 0.0035 mm; coated internally with acridine orange and potassium oxalate), and cylindrical plastic floats (diameter 1.596 _+ 0.0035 mm, specific gravity 1.055) (Levine et al. 1986, Fig. 1). The specific gravity of the float is similar to that of WBC (Wardlaw and Levine 1983). Therefore, the float expands the buffy coat after centrifugation of the capillary. Acridine orange stains WBC and platelets (Wardlaw and Levine 1983; Sallitt et al. 1985). Potassium oxalate osmotically removes water from the erythrocytes, causing their density to increase and their volume to shrink. This enhances the separation of erythrocytes and WBC (Levine et al. 1986; Sallitt et al. 1985). The QBC-Vet Autoread haematology system also includes a pipette system and an automated reader that determines the fluorescence and width of the various cell bands within the capillary (Knoll and Rowell 1996). Fluorescence is obtained under rotation of the capillary in blue-violet light. Cells containing deoxyribonucleic acid (DNA) fluoresce predominantly green, whereas ribonucleic acids (RNA), glycosaminoglycane-contain-
plasma
lympho-/monocytes
platelets i granulocytes red blood cells
109
• capillary "float
~ DNA ... RNAILF
plasma platelets (PLT) i granulocytes red blood cells (RBC)
lympho-lmonocyts (LIM)
Fig. 1. Above QBC-Vet Autoread haematology system capillary with the float and the spread out buffy coat. Different cell types are indicated. Below: corresponding buffy coat profile curve that gives the intensity of fluorescence.
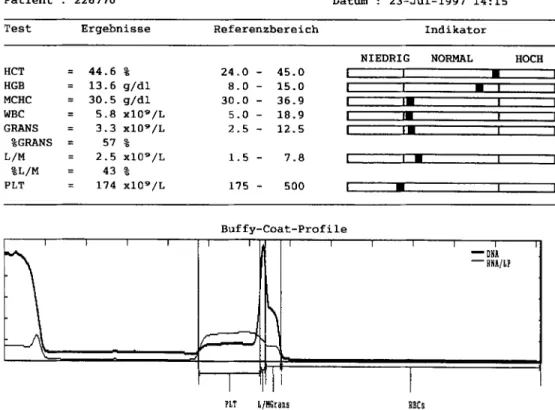
ing granules, nucleoproteins, lipoprotein (LP) and other cellular substances yield an orange to reddish complex on staining with acridine orange. The intensities of the green and reddish fluorescence are chracteristic for the different cells (Wardlaw and Levine 1983; Sallitt et al. 1985; Levine et al. 1986). Numerical results are given as means of eight separate measurements and printed directly (Fig. 2). In addition, the reference value ranges of the above parameters and a curve of the fluorescence intensity is given for every measurement (Figs 1 and 2). For the evaluation we used the software version 3.9. A calibration check of the QBC-Vet Autoread haematology system was performed daily by the software. Adaptation of the QBC-Vet Autoread haematology system to blood samples of different species is necessary to achieve correct results and to refer to the correct reference range. A sample volume of 111 /~1 is used to load the capillary properly. Loading of the capillary with one sample and centrifugation (12400 g, 5 min) take little more than 5 min. Automated reading of the sample takes 90 s. In case of unusual characteristics, numeric results are marked with a flag (#). In addition, annotation is given by the automated reader. Results marked with a flag were excluded from the evaluation. However, results and annotations provide valuable information and hints for practitioners in the field.
Within-Batch Precision
Within-batch precision of the QBC-Vet Autoread haematology system was determined for all three species by twelve consecutive analyses of replicate aliquots of samples with low, intermediate or high WBC counts. Means, standard deviations, and coefficients of variation (CV) were calculated.
110 R. H o f m a n n - L e h m a n n et al. T i e r a r t : E r w . K a t z e P a t i e n t : 2 2 6 7 7 0 V e r : 4 . 7 T R D a t u m : 2 3 - J u i - 1 9 9 7 1 4 : 1 5 T e s t E r g e b n i s s e R e f e r e n z b e r e i c h I n d i k a t o r N I E D R I G N O R M A L H O C H H C T = 4 4 . 6 % 2 4 . 0 - 4 5 . 0 [ I • i H G B = 1 3 . 6 g / d l 8 . 0 - 1 5 . 0 m t • m I MCHC = 3 0 . 5 g / d l 3 0 . 0 - 3 6 . 9 I )m I I W B C = 5 . 8 x I 0 9 / L 5 . 0 - 1 8 . 9 i mm [ [ G R A N S = 3 . 3 x I 0 9 / L 2 . 5 - 1 2 . 5 I Im I I % G R A N S = 5 7 % L / M = 2 . 5 x I 0 9 / L % L / M = 4 3 % P L T = 1 7 4 x I 0 9 / L 1 . 5 - 7 . 8 [ I • I I 1 7 5 - 5 0 0 I • I I B u f f y - C o a t - P r o f i l e 7 - - T r I F ~ 1 T r l "1 ~DNA --~NA/LP PLT L/HGrans RBCs
Fig. 2. Printout of the Q B C - V e t A u t o r e a d h a e m a t o l o g y s y s t e m with n u m e r i c results, reference r a n g e s and buffy coat profile c u r v e (feline blood sample).
Range of Linearity
Determination of the range of linearity of HCT, HGB, WBC, granulocyte, L/M and PLT counts was accom- plished with use of 15 ml of an anticoagulated (EDTA) blood sample. The blood originated from a Labrador dog with pyometra (HCT 34.7%, HGB 7.1 retool/l, WBC
9 9
53.2 x 10/1, PLT 314 x 10/1). In order to examine linearity beyond and below the physiological range, the sample was let stand for half an hour and the plasma was collected. The plasma was centrifuged (10 min at 1500g) to eliminate platelets. The cell-enriched sample was taken as 100%, and the platelet-free plasma was used for serial dilution of the sample. Measurement, calculated dilutions, and the linear regression line of the form y = a + bx were plotted. Subsequently, the range of linearity was determined by visual inspection of the plots.
Accuracy
Accuracy of the QBC-Vet Autoread measurements was examined by comparison of the results with those obtained concomitantly from established laboratory routine methods. WBC and erythrocyte counts, HGB, HCT and MCHC in all samples, and numbers of PLT in canine blood samples were measured by the Contraves 820 Haematology Analyser (Winkler et al. 1995). In addition, HCT was compared to the packed cell volume
obtained from microhaematocrit centrifugation. Platelets of cats and horses were counted manually in the Neubauer improved bright-line haematocytometer cham- ber (Jain 1986). Feline and equine blood samples with anaemia were subject to enumeration of reticulocytes by the brilliant cresyl blue method (Merret tubes, Microgen Bioproducts Limited, Caberley, UK, distributed in Switzerland by Pharma Consulting, Burgdorf) (Jain 1986). Differential blood cell counts were performed manually on 2 x 100 leucocytes.
Blood samples were kindly provided by the clinics of the Departments of Internal Veterinary Medicine and Surgery of the Faculty for Veterinary Medicine. All samples were anticoagulated with the use of K-EDTA. Most of the samples originated from sick animals. In total, 300 blood samples were analysed: 101 samples were canine, 99 were feline, and 100 samples were equine blood samples. Samples were analysed within 3 h after collection.
Data were collected with the Microsoft programs Access and Excel (Version 5.0) and analysed with the Statistics Add-in program Astute (DDU Software, University of Leeds, Leeds, UK). For method compar- ison studies, the linear regression procedure of Passing- Bablok, without assumption of unbiased reference methods, normal distribution of measurements or normal distribution of measurement errors, was applied (Passing and Bablok 1983; Eisenwiener et al. 1984; Bablok and Passing 1985; Bablok et al. 1988). These calculations, tests and plots were performed on a
Evaluation of the QBC-Vet Autoread Haematology System I I I
personal computer with the original software (Version 2.02, 1994) kindly provided by the authors (Eisenwiener et al. 1984). Linear regression of the form y = a + bx were calculated with intercept and slope and their respective confidence intervals as well as Pearson's rank correlation coefficients. Linearity of the correlation was tested by a cumulative sum test of differences between the respective measurements (CUSUM). Sub- sequently, equality of methods was tested for the identity of the regression line with the bisector of the angle (i.e. a = 0 and b = 1). Equality of methods was accepted for p ~<0.05. Finally, the random distribution of measure- ments was analysed.
Results
Enhanced QBC System
The enhanced QBC-Vet Autoread haematology system gives, together with the numeric results, a curve of the fluorescence intensity of the cells (buffy coat profile curve, Figs 1 and 2). This curve gives important information on the analysed sample, the different cell types, and how the system managed the sample. As a first step, the curve was inspected visually to ascertain the correctness of the measurement. For example, aggregated platelets that are stuck at the end of the float lead to underestimation of the PLT count. However, they are easily recognised in the curve as a peak of the RNA/LP fluorescence intensity (Fig. 3). From a total of 300 blood samples, platelets in 59 samples (26 canine,
PLT L/M granulocytes RBC
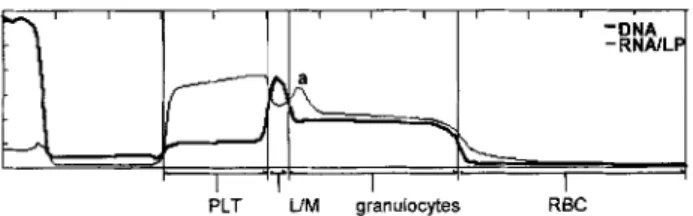
Fig. 4. Curve of fluorescence intensity of a sample with reticulocytes and nucleated red blood cells. Reticulocytes are lighter than mature red blood cells and contain RNA (a). Nucleated red blood cells contain DNA. Therefore, the DNA fluorescence within the red blood cell population is elevated (b).
32 feline and one equine) were aggregated. The reader quoted such platelet results as ' > x platelets'. Secondly, the profile indicates the position of borders between different cell types as set by the automated reader. In some blood samples, it was not possible for the reader to determine the proper position of borders. In the majority of these cases, the automated reader recognised such problems correctly, and a flag (#) and an annotation was set. Only in six of 300 cases (2%), did the reader misinterpret the profile due to unusual characteristics of the sample. Upon visual inspection of the curves, these six samples were readily recognised as being erro- neously interpreted by the reader. The six samples originated from four cats and two dogs, two of whom were suspected to suffer from a tumour, and one dog with a parvovirus infection and a low WBC count (1.1
x 109/1). Finally, interesting details about the sample such as reticulocytes or nucleated red blood cells are indicated by the profile (Fig. 4).
PLT L./M granulocytes RBC
Fig. 3. Curve of fluorescence intensity: Platelets are aggregated on top of the float (a). A second centrifugation step is recommended.
Within-Batch Precision
Results of the within-batch precision determination are compiled in Table 1 (canine samples), Table 2 (feline samples) and Table 3 (equine samples). Overall, precision for equine and canine samples was superior compared to feline samples. However, variation coeffi- cients were below 5% for HCT, HGB and MCHC in all three species. Equine and canine samples also yielded low CV for WBC and for some leucocyte subpopula-
Table 1. Variation coefficients (CV%) of within batch precision assessed by 12 consecutive determination of a canine blood
Low CV% Medium CV% High CV% Mean CV%
HCT (%) 48.19 1.11 44.69 2.75 44.40 1,46 1.77 HGB (mmol/1) 10.38 1.77 9.69 4.22 9.25 2,31 2.82 MCHC (mmol/l) 21.55 1.29 21.66 1.60 20.84 1.08 1.32 WBC (109/1) 5.82 4.45 7.85 4.12 22.72 4.62 4.40 Granulocytes (109/1) 4.13 3.77 6.49 4.13 19.57 4.40 4.1 Granulocytes (%) 71.00 2.25 82.67 0.94 86.08 2.13 1.77 Neutrophils (109/1) 3.22 4.81 . . . . . Eosinophils (109/1) 0,92 14.31 . . . . . L/M (109/1) 1.68 8.34 1.36 5.84 3.15 14.80 9.66 L/M (%) 29.00 5.50 17.33 4.49 13.92 13.16 7.72 PLT (109/1) 290.67 14.84 215.08 15.98 250.33 26.78 19.20
112 R. Hofmann-Lehmann et al. Table 2. Variation coefficients (CV%) of within batch precision assessed by 12 consecutive determination of a feline blood sample
Low CV% Medium CV% High CV% Mean CV%
HCT (%) 27.17 2.42 40.76 0.80 39.13 1.79 1.67 HGB (mmol/1) 5.44 2.63 8.16 0.89 7.70 2.01 1.84 MCHC (mmol/1) 20.03 0.83 20.01 0.47 19.67 0.69 0.66 Reticulocytes (%) 0.97 22.20 0.27 30.62 0.20 0.00 17.55 WBC (109/1) 5.36 4.74 9.45 5.52 17.82 6.08 5.45 Granulocytes (109/I) 3.23 6.64 6.15 5.69 8.28 5.79 6.04 Granulocytes (%) 60.33 5.21 65.55 3.87 46.42 3.37 4.15 L/M (109/1) 2.13 10.06 3.25 10.79 9.54 7.85 9.57 L/M (%) 39.67 7.92 34.45 7.37 53.58 2.92 6.07 PLT (109/1) 422.08 4.88 333.27 3.53 373.83 5.50 4.64
Table 3. Variation coefficients (CV%) of within batch precision assessed by 12 consecutive determination of a equine blood sample
Low CV% Medium CV% High CV% Mean CV%
HCT (%) 35.16 2.52 32.39 2.21 37.46 3.60 2.78 HGB (mmol/1) 8.25 2.04 7.57 2.08 8.71 4.63 2.92 MCHC (mmol/1) 23.46 1.10 23.37 0.89 23.27 1.41 1.13 WBC (109/1) 3.56 4.56 8.42 4.26 20.11 4.77 4.53 Granulocytes (109/1) 2.03 6.70 5,69 5.35 15.03 4.78 5.61 Granulocytes (%) 56.83 3.17 67.64 2.37 74.83 1,49 2.34 L/M (109/1) 1.53 5.08 2.73 5.38 5.08 7.54 6.00 L/M (%) 43.17 4.17 32.36 4.95 25.17 4.43 4.52 PLT (109/1) 185.50 5.03 264.09 4.30 164.42 7.52 5.62
tions, whereas for the WBC of the feline blood, the CV were mainly between 5% and 10%. Precision determina- tion for platelet counts yielded a CV up to 7.52% for equine samples, and a CV up to 26.78% for the canine samples. In contrast, CV for platelet counts in feline sample were very good (3.53%-5.50%).
Range ofLineari~
Linear correlation of measurements of the serially diluted canine sample with the calculated dilution was documented for all investigated parameters, except for PLT counts (Table 4). The range usually extended beyond and below the physiological range. In the canine sample chosen for the determination of linearity, the reader erroneously assigned L/M cell populations to eosinophils. Therefore, the L/M fraction was under- estimated in the dilutions of 30% and 50%. The percentage of eosinophils in this sample was found to be very low (2%) determined by manual differential blood cell count on the starting concentration. Therefore, eosinophils were not detected in the dilutions of 10%, 20%, 40% and 60% to 100% by the autoreader. Platelet counts of the serially diluted sample significantly deviated from linearity, as was expected based on the general difficulties when platelets are manipualted. There was a very small decrease in platelet count with increased sample dilution despite proper centrifugation.
Table 4. Range of tested linearity of a canine sample
Range of tested Physiological Range linearity (QBC-Vet, Dog)
HCT (%) 15-50 37.0-55.0 HGB (mmol/l) 3-30 7.4-11.2 WBC (109/1) 7-70 6,0-16.9 Granulocytes (109/1) 5-55 3.3-12.0 Lympho-/monocytes (109/1) 2-20 1.1- 6.3 PLT (109/1) - 175 -500
Accuracy
Buffy coat profiles were inspected visually for plausi- bility of measurements. Obvious misinterpretations (n=6, 2%) were excluded from method comparison. Samples with flagged parameters (n = 57, 19%) were included in the evaluation with the exception of the flagged results. The 57 flagged samples that mostly originated from sick animals, had flags for one or more of the following reasons: 26 samples (17 from cats) had buffy coat abnormalities such as insufficient separation of the different fractions (annotations 1, 3, 4 and 6); three samples had abnormalities within the granulocyte fraction (annotations 1 and 2); 18 samples (11 from cats) had platelet aggregations; 17 samples (12 from horses) had unusual HGB values. Significant deviations from linearity and poor correlation were demonstrated for
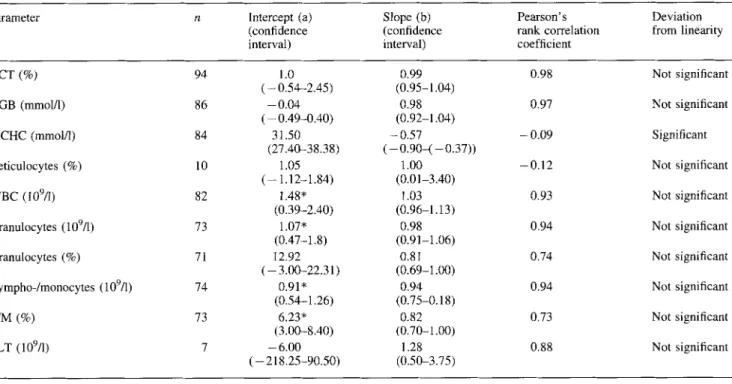
Evaluation of the QBC-Vet Autoread Haematology System 113 Table 5. Accuracy of the QBC-Vet Autoread haematology system with respect to reference methods determined for feline samples (n=99) Parameter n Intercept (a) Deviation
confidence from linearity interval)
Slope (b) Pearson's (confidence rank correlation interval) coefficient
HCT (%) 94 Not significant
HGB (mmol/1) 86 Not significant
MCHC (mmol/1) 84 Significant
Reticulocytes (%) 10 Not significant
WBC (109/1) 82 Not significant
Granulocytes (109/1) 73 Not significant Granulocytes (%) 71 Not significant Lympho-/monocytes (109/1) 74 Not significant
L/M (%) 73 Not significant PLT (109/1) 7 Not significant 1.0 0.99 0.98 ( - 0.54-2.45) (0.95-1.04) -- 0.04 0.98 0.97 ( - 0.49-0.40) (0.92-1.04) 31.50 - 0.57 - 0.09 (27.40-38.38) ( - 0 . 9 0 - ( - 0 . 3 7 ) ) 1 . 0 5 1 . 0 0 - 0 . 1 2 (-- 1.12-1.84) (0.01-3.40) 1.48" 1.03 0.93 (0.39-2.40) (0.96-1.13) 1.07* 0.98 0.94 (0.47-1.8) (0.91-1.06) 12.92 0.81 0.74 ( - 3.00-22.31) (0.69-1.00) 0.91" 0.94 0.94 (0.54-1.26) (0.75-0.18) 6.23* 0.82 0.73 (3.00-8.40) (0.70-1.00) -6.00 1.28 0.88 - 218.25-90.50) (0.50-3.75) *p~>0.05 for a < > 0 o r b < > 1.
Table 6. Accuracy of the QBC-Vet Autoread haematology system with respect to reference methods determined for equine samples (n=100) Parameter n Intercept (a) Slope (b) Pearson's Deviation
(confidence (confidence rank correlation from linearity interval) interval) coefficient
HCT (%) 100 1.13 1.01 0.96 Not significant ( - 0.91-3.09) (0.96-t .07)
HGB (mmol/1) 94 -0.09 1.10" 0.96 Not significant ( - 0.68-0.40) ( 1.03-1.17)
MCHC (mmol/1) 87 12.29 0.50 0.23 Significant (5.43-16.05) (0.33-0.80)
WBC (109/1) 100 0.85* 1.02 0.95 Not significant (0.38-1.27) (0.96-1.09)
Granulocytes (109/1) 97 0.95* 0.98 0.95 Not significant (0.66-1.25) (0.91-1.03)
Granulocytes (%) 97 19.00" 0.75* 0.80 Not significant (10.62-25.00) (0.67-0.87)
Lympho-/monocytes (109/1) 97 1.15 1.04 0.84 Not significant (-0.16-0.41) (0.92-1.20)
Lympho-/monocytes (%) 97 5.75* 0.75* 0.82 Not significant (2.72-8.75) (0.65-0.84)
PLT (109/1) 4 - 2.99 a 1.13 a 0.98 Not significant (108.08-102.10 (0.45-1.80)
*p ~> 0.05 for a < > 0 o r b < > 1.
"linear regression not Passing Bablok (n too small)
M C H C in f e l i n e and e q u i n e s a m p l e s ( T a b l e s 5 and 6). A h i g h d e g r e e o f v a r i a t i o n o f m e a s u r e m e n t s f r o m the e s t i m a t e d r e g r e s s i o n line was a p p a r e n t for r e l a t i v e g r a n u l o c y t e and L / M counts, a b s o l u t e e o s i n o p h i l i c and n e u t r o p h i l i c g r a n u l o c y t e counts ( d o g only), a b s o l u t e L / M c o u n t s (dog and horse), and P L T and r e t i c u l o c y t e
counts ( d o g and cat) ( T a b l e s 5 - 7 ) . S i g n i f i c a n t d e v i a t i o n s o f e s t i m a t e d r e g r e s s i o n lines f r o m the b i s e c t o r s o f the a n g l e w e r e d e m o n s t r a t e d for r e l a t i v e n e u t r o p h i l i c g r a n u l o c y t e and L / M counts in the d o g and horse. E q u a l i t y o f b o t h m e t h o d s was i n f e r r e d for the r e m a i n i n g m a j o r i t y o f p a r a m e t e r s .
114 R. Hofmann-Lehmann et al. Table 7, Accuracy of the QBC-Vet Autoread haematology system with respect to reference methods determined for canine samples (n=101)
Parameter n Intercept (a) Slope (b) Pearson's Deviation
(confidence (confidence rank conelation from linearity
interval) interval) coefficient
HCT (%) 98 1.98' 0.98 0.98 Not significant
(0.52-3.48) (0.95-1.02)
HGB (mmol/l) 96 - 0 . 2 8 1.07 0.96 Not significant
(-0.81-0.31) (1.00-1.13)
MCHC (mmol/1) 95 46.33 - 1.20 - 0.13 Not significant
(35.90-65.29) ( - 2.10-( - 0.7))
Reticulocytes (%) 13 - 0 . 0 3 0.33 0.53 Not significant
( - 1.15-0.41) (0.08-1.50)
WBC (109/1) 85 1.73' 0.96 0.93 Not significant
(0.62-2.63) (0.87-1.1)
Granulocytes (109/1) 67 1.69" 0.88 0.94 Not significant
(0.83-2.14) (0.80-1.02)
Granulocytes (%) 65 22.48* 0.71" 0.78 Not significant
(8.67-31.71 ) (0.59-0.89)
Neutrophils (109/1) 33 - 0 . 1 7 1.15 0.87 Not significant
(-2.12-1.11) (0.86-1.53)
Eosinophils (109/'1) 31 0.57* 1.00 0.64 Not significant
(0.23-0.72) (0.69-1.87)
Lympho-/monocytes (109/1) 66 0.03* 1.21" 0.87 Not significant
( - 0.61-0.40) ( 1.00-1.54)
Lympho-/monocytes (%) 66 7.19* 0.69* 0.77 Not significant
(3.39-10.22) (0.56-0,85)
PLT (109/1) 57 -17.78 1.48" 0.86 Not significant
( -66.47-11.10) (1.32-1.75)
*p~>0.05 f o r a < > 0 o r b < > 1.
Discussion
The evaluation of the QBC-Vet Autoread haematology system for veterinary haematology in the present study consisted of three steps. First, technical properties such as within batch precision, range of linearity of measurements were assessed. In a second step, accuracy of haematological parameters was compared to that obtained by reference methods. In a third step, the QBC- Vet Autoread haematology system was evaluated for handling and usability in veterinary practice.
Variation coefficients of 5% or less for within-batch precision are commonly accepted as very good. Generally, precision of the erythron was superior to those of the leukon and thrombon (Tables 1-3). Since precision of WBC counts was adequate, poor precision resulted mainly from inadequate separation of L/M. This was the case in all species, but particularly pronounced in the cat. Different cell populations of the white cells (huffy coat) of feline samples did not separate as well as those of canine and equine samples. Remarkably good precision was found for platelet counts in the sample of the cat (Table 2). Feline platelets have a strong tendency for aggregation and overlap in size with small red blood cells. The problem is pronounced in any haematology system based on the impedance principle. In the case of aggregated platelets, a second centrifugation run is recommended to improve the reading of feline samples. Extended incubation time with acridine orange for at
least one minute improved staining of platelets and all white blood cells and with this the shape of the curves and the discrimination of the different cell layers. Generally, the percentage of samples with flags could be reduced by longer staining (up to 5 min) and additional centrifugation steps. The range of linearity of measurement of the QBC-Vet Autoread haematology system assessed for a canine sample usually surpassed the physiological range (Table 4).
Accuracy for HCT, HGB and WBC was excellent compared to reference methods (Tables 5-7). Equality of both methods for HCT and HGB determination was inferred from common intercepts and slopes. These results were remarkable, since HCT is calculated from red blood cell count and mean cellular volume in the Contraves AL 820, and determined by microhaematocrit centrifugation in the QBC-Vet Autoread haematology system. The QBC-Vet system assesses the HGB by the draught of the float in the plasma, whereas the reference values were determined photometrically. Poor correla- tion of reticulocyte counts may be attributed to either the small sample size or poor within-batch precision of the reference method itself, manual determination of reticulocytes by the brilliant cresyl blue method. Poor accuracy and deviation from linearity of the MCHC determination were in contrast to the good within-batch precision. This finding was also in contrast to the accuracy of the HCT and HGB determinations. Unexpectedly, the majority (92%) of the equine
Evaluation of the QBC-Vet Autoread Haematology System 115 MCHC calculations by the QBC-Vet Autoread haema-
tology system yielded results beyond the reference values for this system (>36.9 g/dl). Although, these samples originated mainly from sick horses, an elevated MCHC is physiologically unlikely. Consequently, the manufacturer should revise the reference range and the internal MCHC algorithms. (By the time of printing of this paper, the manufacturer has corrected the algorithm in the software version 4.0.) The evaluation of the earlier system (Meister et al. 1990) demonstrated a 'streaming effect' in some canine samples (32% of 91 samples). This effect was attributed to reticulocytes localised within the granulocyte fraction after centrifugation (Meister et al. 1990). In the present study, similar problems were only detected in one feline and two canine samples where the automated reader reported poor separation of granulocytes and red blood cells. A new feature of the advanced system is the recognition of eosinophilic granulocytes in canine samples. Canine eosinophils are characterised by a specific gravity similar to that of lympho-/monocytes. Their granules have a high glycosaminoglycan content and yield a reddish fluorescence (Fig. 5). The relatively high variation found not only in eosinophilic granulocytes, but also in all other white blood cell subpopulations (Tables 5-7), may be attributed partially to high variation in the reference method, manual differntiation of 2 x 100 cells. In addition, the QBC-Vet Autoread haematology system detected eosiniphilic granulocytes inconsistently (see range of linearity determination). Furthermore, the automated reader gave eosinophil counts of > 1.5 x
109/1 in eight of the 31 samples whereas only 0.3-1 x 10⁹/1 eosinophils were detected by manual differentia- tion. It is postulated that the profile for eosinophilic granulocytes reflects a different cell population as compared to manual differentiation. At this point, it is recommended to confirm high eosinophil counts in canine samples by manual differentiation in blood smears. Unexpectedly, good accuracy was found for PLT counts, even though only limited sample numbers were available for horses and cats (Tables 5-7). Although platelet counts in canine samples can be determined accurately with the Contraves AL 820 (Winkler et al. 1995), feline and equine samples had to be counted manually. The determination of platelets with the QBC-Vet Autoread haematology system proved to be accurate, efficient and reliable.
With respect to clinical relevance, information was gained from the determination of reticulocytes. The
~
_ RNA/L-'r~'~-'FFPLT UM granulocytes RBC
Fig. 5. Curve of fluorescence intensity of a canine sample with eosinophilic granulocytes (a). Eosinophils are recognised by a lower specific gravity (than neutrophils), and by an intense red fluorescence.
majority of dogs (six of seven) and cats (nine of ten) with a regenerative anaemia were identified correctly by the QBC-Vet Autoread haematology system. In addition, the automated reader determined 50 of 53 samples with increased leucocyte numbers (cat: > 2 0 x 109/1, dog: > 1 6 x 10⁹/1, horse: >9.5 x 10⁹/1) as leucocytotic. Recognition of leukocytosis gives important information on the patient and the underlying disease, such as bacterial infections, to the veterinary practitioner, and may facilitate the follow-up of the patient. In contrast, only 20 of the 35 samples with decreased WBC counts (cat: >3.6 x 10⁹/1, dog: <6.6 x 10⁹/1, horse: <5.1 x 10⁹/1) were correctly identified by the automated reader as leukopenic. Slight overestimation of the WBC counts by the QBC-Vet Autoread haematology system (com- pare also Tables 5-7) should be revised in a new software version. Consequently, the recognition of leukopenic samples would be improved. Three of four neutrophilias (>11 x 109/1), and four of five eosinophilias ( > 1.5 x 10⁹/1) were detected properly by the QBC-Vet Autoread haematolog~ system. All thrombocytopenic samples ( < 8 0 x 107/1, n=5) were identified correctly by the QBC-Vet Autoread haematol- ogy system; a fact that is very important for the practitioner as PLT counts below 100 x 109/1 (horse: 70 x 109/1) are considered clinically significant (Coles 1986). Feline samples very often led to an annotation because of inappropriate platelet determinations (11.1%). Feline platelets tend to aggregate very easily, particularly when the animal is stressed during blood collection, or the blood sample is taken improperly. Equine samples led to an annotation twelve times (12%) because of unusual HGB determinations. The majority of the equine samples originated from the Clinic of Internal Medicine and were taken from horses with colic. These patients often have an increased erythrocyte sedimentation and the draught of the float may have been disturbed.
Proper blood collections, use of EDTA anticoagula- tion and thorough mixing of samples are prerequisites for any haematological analysis. In addition, samples should be analysed soon after blood collection, no later than four hours after sampling (QBC Vet-Autoread User Manual 1994). Reliability of measurements for feline samples may be enhanced by an increased incubation time before analysis.
After introduction, only minimal training was required to operate the system adequately. The QBC-Vet Autoread haematology system proved to be easy both in handling and interpretation of results. The printed buffy coat profile is very useful to check plausibility of results and to prevent misinterpretations. The QBC-Vet Autoread haematology system has excellent analytical properties and represents a benefit to the veterinary practice.
Acknowledgements. This study was supported by a grant from Idexx
Inc., Westbrock, ME and fiom the Union Bank of Switzerland on behalf of a customer. We are indebted to P. Bruggmann, S. Oswald, E. Rogg and C. Zgraggen for excellent technical assistance, and Dr P. Arnold for helpful discussion, and our colleagues in the clinics for providing the blood samples. We thank E. Monnier (Prover AG) for
116 R. Hofmann-Lehmann et al.
support with the QBC-Vet Autoread haematology system, and Dr P. Lerner-Hiller, Dr A. Fuchs and Dr J. Roche (Idexx) for helpful discussion.
References
Bablok W, Passing H. (1985) Application of statistical procedures in analytical instrument testing. J Autom Chem 7:74-79
Bablok W, Passing H, Bender R et al. (1988) A general regression procedure for method transformation: application of linear regression procedures for method comparison studies in clinical chemistry part III. J Clin Chem Clin Biochem 26(11):783-790 Brown AA, Barsanti JA (1988) Quantitative buffy coat analysis for
hematologic measurements of canine, feline, and equine blood samples and for detection of microfilaremia in dogs. Am J Vet Res 49(3):321-324
Coles EH (1986) Veterinary clinical pathology. W.B. Saunders, Philadelphia
Eisenwiener HG, Bablok W, Bardorff W. et al. (1984) Statistische Auswertung beim Methodenvergleich. Lab Med 8:232-244 Fischer A, Lechner J, Kraft W et al. (1989) Test eines zentrifugalen
H~imatologiesystems fiar die Praxis. Tier~irztl Prax 17:227-230 Jackson JF (1961) Supravital blood studies, using acridine orange
fluorescence. Blood 17(1):643-649
Jain NC (1986) Schalm's veterinary hematology. Lea & Febiger, Philadelphia
Knoll JS, Rowell SL (1996) Clinical hematology: in-clinic analysis, quality control, reference values and system selection. Vet Clin North Am Small Anim Pract 26(5):981-1002
Levine RA, Hart AH, Wardlaw SC (1986) Quantitative buffy coat analysis of blood collected from dogs, cats and horses. J Am Vet Med Assoc 189(6):670-673
Meister D, Tschudi P, Hermann M e t aL (1990) Erfahrungen mit dem QBC-V-H~imatologiesystem an den Tierspit~ilern Ztirich und Bern. Schweiz Arch Tierheilkd 132:261-266
Passing H, Bablok W (1983) A new biometrical procedure for testing the equality of measurements from two different analytical methods; application of linear regression procedures for method comparison studies in clinical chemistry part I. J Clin Chem Clin Biochem 21:709-720
Paul RI, B adgett JT, Buchino JJ (1994) Evaluation of QBC Autoread performance in an emergency department setting. Pediatr Emerg Care 10(6):359-363
QBC Vet-Autoread User Manual (1994) IDEXX. W6rrstadt, Germany Sallitt RL, Ho TT, Rodriguez RR (1985) Evaluation of leukocyte differential counts on the QBC centrifugal hematology analyzer according to NCCLS Standard H 20-T. Blood Cells 11(2):281-294 Wardlaw SC, Levine RA (1983) Quantitative buffy coat analysis. A new laboratory tool functioning as a screening complete blood cell count. JAMA 249(5):617-620
Winkler GC, Engeli J, Rogg E et al. (1995) Evaluation of the Contraves AL 820 automated haematology analyser for domestic, pet and laboratory animals. Comp Haematol Int 5:130-139