HAL Id: hal-00762287
https://hal.archives-ouvertes.fr/hal-00762287
Submitted on 6 Dec 2012
HAL is a multi-disciplinary open access
archive for the deposit and dissemination of
sci-entific research documents, whether they are
pub-lished or not. The documents may come from
teaching and research institutions in France or
abroad, or from public or private research centers.
L’archive ouverte pluridisciplinaire HAL, est
destinée au dépôt et à la diffusion de documents
scientifiques de niveau recherche, publiés ou non,
émanant des établissements d’enseignement et de
recherche français ou étrangers, des laboratoires
publics ou privés.
recovery in the presence of speckle
Usman Zabit, Olivier Bernal, Thierry Bosch
To cite this version:
Usman Zabit, Olivier Bernal, Thierry Bosch. Self-mixing laser sensor for large displacements: signal
recovery in the presence of speckle. IEEE Sensors Journal, Institute of Electrical and Electronics
Engineers, 2013, 13 (2), pp.824-831. �10.1109/JSEN.2012.2227718�. �hal-00762287�
I. INTRODUCTION
elf-mixing (SM) or optical feedback interferometry [1-3] has been regularly used for displacement sensing [4-5] though the presence of speckle [6] has often reduced the range or even the possibility of correct measurement. Traditionally, efforts have been invested to avoid speckle, mostly by tracking the strong signal by means of electro-mechanical actuators. In this paper we take a very different course: we present a technique that properly recovers displacement from the SM signal even in case of long-range displacements where signal is strongly affected by speckle.
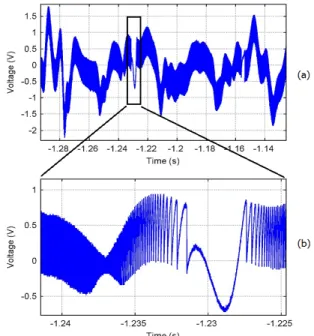
Speckle caused amplitude modulation (see Fig. 1) of a SM signal is influenced by the target surface roughness, the laser spot size as well as the laser wavelength (λ) [7]. For small displacements of the target, speckle may not affect the SM signals if the displacement is much smaller than the typical longitudinal size of the speckle grain [8]. For larger displacements, speckle can cause amplitude fading (Fig. 1). Such an amplitude modulation thus demands additional
This work was supported in part by the Agence Nationale de la Recherche (ANR), France under contract ANR-2011-EMMA-001-01.
The authors are with the CNRS, LAAS, 7 avenue du colonel Roche, 31400 Toulouse, France as well as the Univ de Toulouse, INP, LAAS, F-31400 Toulouse, France (phone: +33-534322555; fax: +33-534322568; e-mail: usman.zabit@enseeiht.fr; olivier.bernal@enseeiht.fr; thierry.bosch@enseeiht.fr).
processing in order to correctly recover the displacement information. In addition, speckle can also cause a change in SM feedback regime (e.g. from moderate to weak or vice versa) which may require further signal processing [1-2].
A look into large displacement SM sensors reported earlier indicates that the use of co-operative targets has allowed avoiding speckle effect [5] and even helped in improving measurements by an order of magnitude [9]. On the other hand, long range SM displacement sensing has also been achieved by electronically keeping the operating point of the SM interferometer fixed at the half-fringe [10] though the sensor still requires additional optical components. Another approach uses two piezo-actuators to move a lens for a speckle tracking technique [8]. An improved version of it adds a liquid crystal attenuator to maintain moderate feedback regime [11]. In [12], a SM vibrometer able to detect the deformed fringes has been presented though harmonic vibration results are only of an order of 10-5 m. Finally, a voltage controlled liquid lens and a double-headed LD sensor with different laser beam spot sizes have also been proposed to avoid speckle [7].
Thus, it is seen that speckle has often been previously countered for large displacement sensing either by adding optical/electro-mechanical components or by using cooperative target surfaces. In other words, efforts have usually been invested to obtain a speckle-free SM signal [as shown in Fig. 1 (a)] rather than retrieving information from a speckle-affected SM signal [as shown in Fig. 1 (b)]. This paper demonstrates a new signal processing technique that correctly extracts and processes SM signals corrupted by speckle while avoiding additional optical/ electro-mechanical components.
The paper is organized as follows. After describing the experimental arrangement in Sec. II, the proposed signal
Self-mixing laser sensor for large
displacements: signal recovery in the presence
of speckle
Usman Zabit, Olivier D. Bernal, and Thierry Bosch
S
Abstract— Laser self-mixing (SM) sensors have been successfully used to measure displacement in the absence of speckle.
However, speckle deforms the SM signal rendering it unusable for standard displacement extraction techniques. This article proposes a new signal processing technique, based on tracking the signal envelope, to remedy this problem. Algorithm was successfully employed to measure long-range displacements (25 mm), in the presence of speckle and the lateral movement of the target, both causing severe corruption of the SM signal. It therefore enabled the use of the sensor on non-cooperative targets without the need for sensor positioning and/or alignment. The results have been obtained for SM signals where the envelope amplitude has varied by a factor 28, without a loss of interferometric fringes. The use of this technique effectively removes the need for opto/electro-mechanical components traditionally used to measure long-range displacement in the presence of speckle.
processing which can recover displacements (10-6 m–10-2 m) even in the presence of speckle, is outlined in Sec. III. It is shown that displacement can then be measured either with λ/2 resolution or with λ/10 resolution by incorporating SM signal scaling. Experimental validation of the proposed technique is presented in Sec. IV, followed by the Conclusion.
II. EXPERIMENTAL ARRANGEMENT
Two different experimental setups have been used in this study while using the same SM sensor described in the next paragraph. The first one (a SM sensing system presented in Fig. 2) is a conventionally used vibration setup with a target driven by a high resolution piezoelectric actuator that is only capable of small displacements. It will be used to assess the accuracy of the proposed technique. On the contrary, the second system, capable of generating long-range displacements of the order of 10-2 m with a comparatively lower resolution, will be used to verify the robustness of the proposed technique.
A. Small-range Displacement Set-up
The SM sensor in Fig. 2 (indicated in grey) is composed of a packaged laser diode (LD) with built-in monitoring photodiode (PD). The PD is typically used to recover the variations in the optical output power of the laser diode P(t) though it is also possible to recover equivalent interferometric information by using LD junction voltage, as suggested in [13] for LD packages having no built-in PD. A lens is then used to focus the laser beam on to the target. Finally, P(t) is used to recover the target displacement D(t) [1-2]. The SM sensor is based on a HL7851 laser diode emitting at 785 nm with 50 mW output optical power A commercial piezoelectric transducer (PZT) from Physik Instrumente (P753.2CD) has been used as a target (as seen in Fig. 2). It can provide a max. p-p displacement of 25 µm with a resolution of 2 nm as measured by its built-in capacitive feedback sensor.
B. Long-range Displacement Set-up
To acquire SM signals for large displacements, a target was
mounted on a translation stage capable of displacing the target in x and y directions (see Fig. 2). It uses an incremental encoder (model: 58-10.000-5-BZ-K-CL) from elcis® and fema electronica®. It can then generate displacements of up to 1 m along the x-axis and up to 0.5 m along the y-axis, each with a 50 µm resolution. The SM sensor was installed on the same mechanical assembly that contained the translation stage onto which the target was affixed. The laser beam propagated along the x-axis. The target had an unpolished metal surface.
The aim of adding the movement in the y-direction to the sensor was to investigate the possible influence of a stray lateral movement of the target on the acquired SM signal. The measurements were intentionally executed without using vibration isolation platform, adding yet another element of realism to the experiment. Likewise, no additional efforts were made to align the laser beam along the x-axis mechanical movement (which would lock the laser beam on the same target spot). This caused the transverse movement of the beam across the target surface as the target moved. [Fig. 1 (b) illustrates this scanning effect as seen by the symmetric modulation of SM signal as the laser beam moves to and fro on the same surface of the harmonically moving target].
Thus, the objective has been to create the realistic usage conditions where the SM optical sensor cannot be guaranteed a perfect alignment or complete absence of undesirable mechanical coupling causing lateral movement.
C. Influence of Speckle on SM signals
Let us first present a typical SM signal that is neither affected by speckle nor by any stray (lateral) movement of the sensor (Fig. 3). Each fringe in the SM signal represents a target displacement of λ/2. These SM fringes can be easily detected by finding the derivative of the signal and then using the fixed threshold values [9], as illustrated in Fig. 3(b). Hence, by using simple fringe counting, λ/2 resolution can be ensured by detecting and counting all SM fringes. Other methods exist that provide even better resolution by building on simple fringe counting [14-15]. So, it is relatively straightforward to process the normal SM signals acquired under favorable conditions. Stable fringe amplitude as well as stable SM feedback regime allows using a predetermined,
Fig. 1. Two SM signals obtained by focusing two laser beams with comparable spot sizes onto the same target surface location undergoing a harmonic movement. The presence of speckle based amplitude modulation of one of the SM signals (b) can be seen. The amplitude modulation is periodic in nature as the laser beam scans the same surface of the harmonically moving target.
Fig. 2. Schematic block diagram of Self-Mixing (SM) sensing system measuring the target displacement along x-axis (i.e. along the laser beam).
fixed threshold level for SM fringe detection (Fig. 3).
It may be added that SM signals can be strongly influenced by the feedback coupling factor C that varies as a function of sensor to target distance, coupling efficiency, and surface reflectivity of the target [12]. In fact, variations in C cause changes in the SM feedback regimes varying from weak to moderate to strong feedback, where each regime would require specific signal processing for displacement retrieval [16]. Hence, correct displacement can be recovered easily as long as the signal is not corrupted by the presence of speckle.
On the other hand, this basic processing does not work for speckle affected SM signals as it is not able to detect deeply modulated SM fringes when the SM signal is deformed by modulation and fluctuations (such as shown in Fig. 4). Under such conditions, standard fringe detection techniques such as zero-crossing detection [1], SM derivative detection [9], or SM hysteresis based technique [16] would fail as such a SM signal is no more centered at zero, is devoid of hysteresis based symmetry, has varying fringe amplitude and contains substantial fluctuations (Figs. 1 and 4).
Such SM signal deformations may be caused by mechanical disturbances or target surface scanning, detailed below.
1) Influence of Mechanical Disturbance
Fig. 4 (a) presents a segment of the SM signal obtained for a 10 mm displacement along the x-axis while the initial sensor to target distance was 0.55 m. It can be observed that the SM signal has been affected by the stray mechanical coupling that explains the fluctuations in the SM signal.
Such fluctuations in the SM signal thus make it difficult to use zero-crossing technique for fringe detection. Likewise, the adaptive fringe detection algorithm [16] also faces problems as the moderate regime SM signal cannot be divided into two distinct regions i.e. P(t)<0 and P(t)>0.
It may be added that a future objective for SM interferometric sensing is its possible use for embedded
industrial applications where the sensor would undergo important extraneous mechanical movements while ensuring correct measurement. The influence of the extraneous movements can be corrected by using an embedded accelerometer [17]. Nonetheless, such an arrangement necessitates improved processing of the SM signal obtained under given conditions. This also incited us to test the proposed long range SM sensor under similar conditions.
2) Influence of Target Surface Scanning
A further magnified section of Fig. 4 (a) is presented in Fig. 4 (b). It indicates the presence of speckle that has affected the amplitude of the SM fringes. The obvious impact of such a reduction in fringe amplitude is the impossibility of using a constant fringe-detection threshold (as done in Fig. 3). As a consequence, the threshold value needs to be adapted.
The presence of an arbitrarily occurring speckle is all the more troublesome as the amplitude of a typically stable SM segment can rapidly vary if a dark speckle spot comes in to the field of the laser beam spot. As the lack of misalignment results in a movement of laser beam spot across the moving target surface thereby resulting in a sort of scanning of the moving target surface, so in case of non-cooperative surfaces, such speckle related signal fading becomes a frequent occurrence and so deforms the SM signal.
As speckle can greatly affect the SM fringe amplitude and shape so it can hinder correct fringe detection. This, in turn, makes it difficult to even keep on measuring displacement as a lack of SM fringe detection causes a loss of track of incremental nature of SM displacement recovery (especially in the case of a large number of SM fringes). It may be added
Fig. 3. (a) Experimental SM signal and corresponding displacement measurement (c) of an arbitrarily moving target. It is neither affected by speckle based signal modulation nor by stray movement based signal fluctuations. (b) Simple derivation (blue) and fixed threshold values (red & green) allow SM fringe detection.
Fig. 4. (a) A segment of an experimental SM signal obtained for a 10-2 m target displacement. The fluctuations in amplitude are due to non-stationary SM sensor. (b) Speckle-affected signal segment from (a).
that such a loss of SM fringe detection cannot be made up by using improved resolution methods [14-15] as such a loss is of a fundamental nature.
Lastly, speckle also causes the C value to vary, thereby changing the SM feedback regime. Thus, signal processing needs to be adapted in order to recover displacement information from such a SM signal.
Let’s now present the principal signal processing steps used in the proposed envelope extraction technique (see Fig. 5)
III. SIGNAL PROCESSING
In order to elaborate these steps, an exemplar experimental SM signal will be used as seen in Fig. 6 (a). It has some interesting properties, such as the presence of speckle that has affected not only the SM fringes indicating a displacement of target towards the sensor [Fig. 6 (b)] but also the SM fringes indicating a displacement of target away from the sensor [Fig. 6 (c)]. It has also been affected by stray movement and also contains fringe-less segments where the target displacement remains less than λ/2 (such as at the moment of target motion direction reversal). It can also be observed in Fig. 6 (b-c) that a speckle related fading not only (1) reduces the peak-to-peak (p-p) amplitude of a SM fringe as compared to other SM fringes corresponding to an equivalent target displacement but also (2) reduces the optical feedback coupling thus causing a reduction in the C value. It is thus shown in Fig. 6 (b-c) that SM signal moves from moderate feedback regime (C>1 with saw-tooth shaped fringes) to weak feedback regime (C<1 with asymmetric shaped fringes) and vice versa as a result of presence of speckle. These two effects thus need to be addressed during the signal processing.
The signal processing consists of the following principal steps.
A. Filtering
First of all, the SM signal is filtered by using a Low Pass
Filter (LPF) that eliminates high frequency noise present in the SM signal. Fig. 7 (a-b) presents a segment of our exemplar SM signal before and after the filtering. It thus 1) allows a better extraction of upper and lower envelopes of deformed SM signal either for moderate or for weak feedback regime SM fringes [see Fig. 6(b-c)] but also 2) enables a lower dynamic cut-off value used for fringe detection, as explained later.
B. Envelope Tracking
In order to detect the SM fringes, a derivative of the filtered SM signal is found. Then, the upper and lower envelopes of the derivative signal are recovered by using a maxima search. The maxima are determined by searching within a sliding window of n consecutive samples (this step would be evaluated further in the next section). Fig. 8 (a) presents the derivative signal of the speckle affected SM signal presented in Fig. 6 (a). The upper and lower envelopes are indicated in Fig. 8 (b). By using such an approach, it is possible to closely track the modulation of the SM fringes caused by speckle.
Then, a combined envelope is created by comparing the corresponding amplitude values of the upper and the lower envelopes. As a result, the greater value is retained in the combined envelope (see block diagram of Fig. 5). The combined envelope can then be used for estimating local fluctuations in the SM signal not corresponding to a SM fringe, as seen below.
C. Dynamic Cut-off for Fringe-less Segment Distinction
As already mentioned, a fringe-less segment has been defined as that SM signal segment where the target movement remains less than half-wavelength (as highlighted in the block of Fig. 7). The upper and lower envelopes (or the combined envelope) of this zone are then representative of local SM signal fluctuations not corresponding to a SM fringe.
A cut-off level (indicative of local fluctuations) then has to be imposed so that such fringe-less segments do not lead to false fringe detections. In other words, only those samples of the combined envelope with amplitude greater than this cut-off
Fig. 6. (a) An exemplar experimental SM signal indicating the presence of speckle and fluctuations in amplitude. (b) The filtered speckle affected SM signal segment indicating a displacement of target towards the sensor and (c) indicating a displacement of target away from the sensor. (b-c) also present a change in SM optical feedback regime.
Fig. 5. Schematic block diagram of envelope extraction method.
level are retained in the cut envelope (see block diagram of Fig. 5). All other samples with smaller amplitude are discarded and are not considered for fringe-detection.
The dynamic cut-off value is found by using a minimum search routine over a sliding window of n consecutive samples of the combined envelope. As a result, the cut-off value varies as a function of local variations of SM signal. It then helps in recovering SM fringe location information from such SM fringes that have been affected by a relatively greater depth of speckle-induced modulation
Fig. 9 indicates how the cut-off value is used to help identify the segments indicating the presence of a distinct SM fringe from the segments devoid of this information. As compared to the algorithm presented in [18] which used a fixed cut-off value (see Fig. 5 of [18]), the current algorithm uses a dynamic cut-off indicative of local variations of SM signal. This results in a better detection of deeply modulated SM fringes. Fig. 9 (b) shows how the dynamic cut-off varies as a function of local fluctuations. Interestingly, it is seen here that the amplitude of local variations in moderate regime SM fringes is greater than that of weak regime SM signals [see also Fig. 6 (b-c)].
D. SM Fringe Detection
As the local maxima values of the cut envelope closely follow the discontinuities of SM fringes [see Fig. 9 (b)], so the sample of the derivative signal equal to the cut envelope determines the location of SM fringe (see block diagram of
Fig. 5). It again provides better result than that of algorithm presented in [18] that used an inequality condition which led to multiple successive samples indicating a single SM fringe, thus requiring a subsequent discard.
The resultant correct SM fringe detection for our exemplar speckle-affected SM signal is then presented in Fig. 10. The introduction of the dynamic cut-off value has allowed us to distinguish the noisy local variations and fringe-less segments whereas the local maxima tracking results in detecting all SM fringes for the speckle-modulated segments.
E. Displacement Measurement
After correct detection of SM fringes, displacement can then recoverd (see shaded area of Fig. 5). It can be done either by using fringe counting providing λ/2 resolution as proposed in [18] or by unwrapping the SM signal providing at least λ/10 resolution as proposed in [19]. As the unwrapping of SM signal requires a normalization of each and every SM fringe, so fringe location information is used to segment the SM signal P(t) for each and every detected SM fringe. A scaling is then done so that every fringe has amplitude within 0 and 1. An addition of the normalized SM signal Pnorm(t) to the fringe counting based signal Dλ/2(t) thus allows retrieving the unwrapped signal Dunwrap(t) (see Fig. 11). The proposed
Fig. 8. (a) The derivative signal of the speckle-affected experimental SM signal already presented in Fig. 6 (a). (b) Extraction of upper (dotted green curve) and lower (red curve) envelopes of the derivative signal.
Fig. 9. (a) Cut envelope (blue), derivative signal (dotted red), and dynamic cut-off level (black). (b) Zoom on the deeply modulated fringes where each fringe has been individually tracked.
Fig. 10. The exemplar speckle affected SM signal (in blue) and correct fringe detection (in dotted red) by using envelope extraction technique.
Fig. 7. (a-b) A segment of the exemplar SM signal before and after low pass filtering. The rectangular block indicates a fringe-less segment.
method thus ensures a displacement measurement resolution of
λ/10 even for the speckle affected SM signals.
F. Analysis of Envelope Extraction Technique 1) Sliding window search routine
As presented in the previous section, the envelope extraction technique is based on the use of sliding window search routine that takes into account n consecutive samples. Such a standard routine has been used twice: 1) for a maxima search in order to extract the upper and lower envelopes of the deformed signal and 2) for a minima search in order to estimate the local variations used for the calculation of dynamic cut-off value.
The number of samples n has a direct impact on the maximum rate of displacement measurement i.e. velocity (m/s) of the sensor. It can be calculated that for n=500, λ=785 nm and sampling rate of 2.5 MSamples/s, the ensuing signal processing can only deliver a maximum measurement rate of 1.96 mm/s in order to guarantee that only one SM fringe is evaluated within the window of n samples. An increase in
either n or rate of displacement can lead to omission of speckle modulated SM fringes (see Fig. 12).
The maximum speed is directly proportional to the sampling rate as well as λ. Thus, by using a higher rate (implying an increased material cost as well as subsequent higher processing speed) and a longer LD wavelength (implying a reduced sensor resolution as the resolution of displacement retrieval algorithms is a function of laser wavelength), the maximum speed of the sensor can be proportionally improved.
2) Influence of noise
The presence of noise reduces the possibility of correct detection of SM fringes and necessitates a LPF. The use of such a LPF may appear redundant if the SM signal remains within the moderate feedback regime where the amplitude of the sharp discontinuity of saw-toothed shaped SM fringes is quite high and can be easily recovered. However, the weak feedback regime segments with relatively rounded shape as well as lower amplitude (as seen in Fig. 6 (b-c)] greatly benefit from the LPF as it then becomes easier to detect such SM fringes due to a higher signal to noise ratio afforded by the LPF. It also helps in lowering the dynamic cut-off value thus leading to an increase in the recoverable depth of
speckle-Fig. 14. (a) Speckle affected SM signal, (b) weak and (c) moderate feedback regime SM segments. (d) Measured (red) and PZT displacement (dotted blue).
Fig. 11. (a) The exemplar SM signal P(t), (b) normalized SM signal
Pnorm(t), (c) fringe counting based displacement Dλ/2(t), and (d)
unwrapped displacement Dunwrap(t) found by adding signal of (b) and (c).
Fig. 12. Influence of an increase in n: envelope extraction has failed to closely track deeply modulated SM fringes for n=5000 (dotted red). Correct tracking for n=500 (dashed green). The derivative signal (blue).
Fig. 13. (a) Speckle affected SM signal (blue) and correct fringe detection (dotted red) by using envelope extraction technique. (b) Cut envelope.
induced modulation.
3) Depth of speckle induced modulation
The depth of speckle-induced modulation is defined here as the ratio of amplitude of the envelope corresponding to the biggest detected SM fringe to the amplitude of the envelope corresponding to the smallest detected SM fringe. A ratio of 25.4 for the derivative signal of our exemplar SM signal (Fig. 9 (a)] thus indicates that the proposed technique has been able to achieve correct fringe detection even for such a large variation in fringe amplitude. For the sake of comparison, the SM signal shown in Fig. 3 has also been processed and found to have a ratio of 1.46.
4) Unwrapping of speckle affected SM signals
Normalization of SM signal may appear trivial at first sight as it is a common first step of sophisticated displacement retrieval techniques, such as in [14-15] and [19] where a global normalization of the SM signal is done. The particular nature of a SM signal affected by fluctuations and speckle that also contains fringe-less zones cannot allow such a simplified processing. So, scaling needs to be done at individual fringe level which necessitates that correct fringe localization has already been done. That is the reason why normalization is done only after a piece-wise segmentation of SM signal is made possible by using the fringe location information provided by the envelope extraction technique.
IV. EXPERIMENTAL VALIDATION
Initially, in order to quantify the error of our processing technique, the small-range displacement set-up was used (as seen in Fig. 2). The PZT was driven to move along x-axis while the SM sensor was made to scan the PZT surface along
y-axis. Fig. 13 presents a SM signal with variable fringe
amplitude acquired using this setup. All SM fringes have been correctly detected despite a depth of speckle-induced modulation of 28, as seen in Fig. 13 (b).
Fig. 14 (a) presents another SM signal acquired using the same set-up. PZT was driven to provide a harmonic vibration of 25 µm p-p. This SM signal contains weak and moderate feedback regime segments of similar duration [see Fig. 14 (b-c)] with a depth of speckle-induced modulation of 13.8. By using the proposed technique, displacement Dλ/2(t) was measured and compared with the reference PZT sensor [see Fig. 14 (d)]. An RMS error of 301 nm was measured, validating the resolution of Dλ/2(t) measured by the proposed technique. It thus indicates that each and every SM fringe was correctly detected.
Fig. 15 (a) presents another SM signal where again a gradual variation in C value can be seen. This SM signal has been correctly normalized [Fig. 15 (b)] after a detection of all fringe locations. Dunwrap(t) thus measured was then compared with the reference PZT sensor [see Fig. 15 (c)]. The difference between these two signals is presented in Fig. 15 (d). An RMS error of 66 nm was thus measured, thus validating the resolution of Dunwrap(t) measured by the proposed technique
As the PZT could not provide displacements of the order of 10-2 m, so later testing was done using the long range displacement set-up based on the incremental encoder. Fig. 16 (a) presents an experimental SM signal acquisition for a target displacement of 25 mm while sensor to target distance was 630 mm. Using the envelope extraction technique, a speckle and stray movement affected SM signal [Fig. 16 (a-b)] was processed to recover the target displacement [Fig. 16 (c)]. Fig. 16 (d) shows the total displacement of the target as it comes to
Fig. 16. (a) SM signal obtained for a 25 mm displacement of a metallic target moved by an actuator with 50 µm resolution, (b) magnified segment indicating deformation of SM signal, (c) recovered displacement, (d) magnified segment of recovered displacement as target comes to stand-still. Fig. 15. (a) Speckle affected SM signal, (b) normalized SM signal, (c)
Dunwrap(t) (in blue curve) and reference displacment (dotted red), and (d)
standstill. The final displacement at standstill of 25036 µm is within the expected range of [24950 µm–25050 µm] if we take into account the 50 µm resolution of the long range translation stage based on the incremental encoder.
Thus, it has been shown that the proposed processing enables and guarantees a correct long range displacement measurement by recovering information from a very large number of SM fringes that have been affected by speckle. If needed, the measurement accuracy can then be improved by using SM signal unwrapping after a piece-wise segmentation and scaling of speckle affected SM signal.
V. CONCLUSION
In this paper, it has been shown that long range displacement measurement of targets with non-cooperative surfaces can be achieved even in the presence of speckle or stray movement of SM sensor by using SM envelope extracting technique. It has been shown that speckle can markedly affect the amplitude as well as the shape of SM fringes by causing a variation in the SM optical feedback regime. Under such conditions, traditional fringe detection methods expecting a stable fringe amplitude as well as a stable SM optical feedback regime would not work as such a SM signal is deprived of hysteresis based symmetry, contains fluctuations, and is no more centered at zero.
This processing technique has enabled correct large displacement measurement for a non-cooperative target under such operating conditions that caused speckle. Hence, the SM sensor did not need to employ additional optical/electro-mechanical components, often used to counter speckle. Likewise, no target surface preparation was done. In order to be close to real usage conditions, the sensor was not placed on a stable isolating platform (e.g. an optical table). Thus, it was subject to stray movements as well as misalignment. Using experimental SM signals acquired under such conditions, the proposed technique has provided a measurement precision of 66 nm RMS for SM signals with envelope amplitude variation of at least a factor 28. Displacements within a range of 10-6 m to 10-2 m have thus been recovered from speckle modulated SM signals.
REFERENCES
[1] S. Donati, “Developing self-mixing interferometry for instrumentation and measurements”, Laser & Photon. Rev., 6: 393417, May 2012. [2] G. Giuliani, S. Donati, “Laser interferometry” in Unlocking dynamical
diversity: optical feedback effects on semiconductor lasers, D. M. Kane
and K.A. Shore, Ed. Chichester: John Wiley & Sons, Ltd, pp. 217-256, 2005.
[3] Norgia, M.; Pesatori, A.; Rovati, L.; , “Self-Mixing Laser Doppler Spectra of Extracorporeal Blood Flow: A Theoretical and Experimental Study”, Sensors Journal, IEEE , vol.12, no.3, pp.552-557, March 2012. [4] Huali Lu; Ming Wang; Xiajuan Dai; Wenhua Guo; , “All-Fiber Self-Mixing Interferometer Based on DFB Laser and Phase Modulating Technique”, Photonics Technology Letters, IEEE , vol.23, no.4, pp.221-223, Feb.15, 2011.
[5] S. Ottonelli, M. Dabbicco, F. De Lucia, and G. Scamarcio, “Simultaneous measurement of linear and transverse displacements by laser self-mixing”, Applied Optics, vol. 48, No. 9, pp. 1784, 2009. [6] R. Kliese and A. D. Rakić, “Spectral broadening caused by dynamic
speckle in self-mixing velocimetry sensors”, Opt. Express 20, pp. 18757-18771, 2012.
[7] R. Atashkhooei, S. Royo, F. Azcona, and U. Zabit, "Analysis and control of speckle effects in self-mixing interferometry," Sensors, 2011
IEEE , vol., no., pp.1390-1393, 28-31 Oct. 2011.
[8] M. Norgia, S. Donati, and D. D’Alessandro, “Interferometric measurements of displacement on a diffusing target by a speckle tracking technique,” IEEE J. Quant. Electron., vol. 37, pp. 800-806, 2001.
[9] Ottonelli, S.; De Lucia, F.; di Vietro, M.; Dabbicco, M.; Scamarcio, G.; Mezzapesa, F.P.; , "A Compact Three Degrees-of-Freedom Motion Sensor Based on the Laser-Self-Mixing Effect," Photonics Technology
Letters, IEEE , vol.20, no.16, pp.1360-1362, Aug.15, 2008.
[10] G. Giuliani, S. Bozzi-Pietra, S. Donati, "Self-mixing laser diode vibrometer", Meas. Sci. Technol., vol. 14, no. 1, pp. 24-32, 2003. [11] M. Norgia, and S. Donati, “A Displacement-Measuring Instrument
Utilizing Self-Mixing Interferometry”, IEEE Trans. On Instr. and
Measurement, vol. 52, No. 6, pp. 1765-1770, 2003.
[12] M. Norgia, and C. Svelto,“Novel Measurement Method for Signal Recovery in Optical Vibrometer”, IEEE Trans. On Instr. and
Measurement, vol. 57, issue 8, pp.1703 – 1707, 2008.
[13] Y. Lim, M. Nikolic, K. Bertling, R. Kliese, and A. Rakic, “Self-mixing imaging sensor using a monolithic VCSEL array with parallel readout”
Opt. Express, 17, pp. 5517-5525, 2009.
[14] C. Bes, G. Plantier, and T. Bosch, “Displacement measurements using a self-mixing laser diode under moderate feedback”, IEEE Trans. On
Instr. and Measurements, vol. 55, no. 4, pp. 1101–1105, 2006.
[15] Yuanlong Fan, Yanguang Yu, Jiangtao Xi, and Joe F. Chicharo, “Improving the measurement performance for a self-mixing interferometry-based displacement sensing system”, Appl. Opt. 50, 5064-5072, 2011.
[16] U. Zabit, T. Bosch, and F. Bony, “Adaptive Transition Detection Algorithm for a Self-Mixing Displacement Sensor”, IEEE Sensors
Journal, Volume 9, Issue 12, pp. 1879 – 1886, 2009.
[17] U. Zabit, O. D. Bernal, T. Bosch, and F. Bony, “MEMS accelerometer embedded in a self-mixing displacement sensor for parasitic vibration compensation”, Optics Letters, vol. 36, pp. 612-614, 2011.
[18] U. Zabit, and T. Bosch, “Envelope Extraction Technique for a Self-Mixing Centimetric Displacement Laser Sensor”, Sensors, 2011 IEEE
Conf. , vol., no., pp 343-346, 28-31 Oct. 2011.
[19] M. Norgia, and A. Pesatori, “Fully analog self-mixing laser vibrometer”,
Inst. and Meas. Techn. Conf. (I2MTC), 2011 IEEE, pp.1-4, May 2011.