Fascicle VI – Food Technology (2019), 43(2), 125-142
https://doi.org/10.35219/foodtechnology.2019.2.09
ORIGINAL RESEARCH PAPER
EFFECT OF DIFFERENT DRYING TEMPERATURES ON THE COMPOSITION AND ANTIOXIDANT ACTIVITY OF GINGER POWDER
SALIMA CHERRAT1, LILA BOULKEBACHE-MAKHLOUF2, JAVED IQBAL3, SABRINA
ZEGHICHI2, SABRINA SAIT2, 4, GAVIN WALKER3
1Faculté des Sciences de la Nature et de la Vie, Université Mohammed Seddik ben Yehia, Jijel 18000, Algérie 2Laboratoire de Biomathématiques, Biophysique, Biochimie, et Scientometrie Faculté des Sciences de la Nature et
de la Vie, Université de Bejaia, Bejaia 06000, Algérie
3Pharmaceutical Manufacturing Technology Centre (PMTC), Bernal Institute, University of Limerick, Ireland 4Departement de Biologie, Faculté des Sciences de la Nature et de la Vie et Sciences de la Terre, Université de
Bouira, Bouira 10000, Algérie
*Corresponding author: salima.cherrat@ul.ie, csalima98@hotmail.com Received on 2nd September 2019
Revised on 13th November 2019
The influence of drying temperatures ranging from 40° to 100°C on the chemical composition, antioxidant properties and microstructure characteristics of the ginger powders was investigated. The ginger samples dried at 100°C showed a significantly higher amount of polyphenols (24.154 mg EAG/g) and flavonoids (10.564 mg EAG/g) contents. Moreover, the antioxidant activity increased from 73.47% at 40°C to 78.23% at 100°C. The reduction trend of 6-gingerol and β-carotene concentrations was obtained by rising the drying temperatures as indicated by high performance liquid chromatography (HPLC) analysis. In contrast, zingerone and 6-shogoal contents significantly increased at high drying temperatures. A pronounced gelatinization and a more compacted structure was observed in the ginger powders dried at high temperatures (80 and 100°C) as indicated by scanning electron microscopy analysis. These findings offer a better comprehension of the influence of the oven drying process on the functional properties and structure characteristics of the ginger powder, hence allowing the optimization and development of applications in the food and pharmaceutical industries.
Keywords: dried ginger, antioxidant activity, flavonoids, 6-gingerol, 6-shogoal, zingerone
Introduction
Belonging to the family Zingiberaceae, Ginger (Zingiber officinale Roscoe) is one of the most common plants globally used in food and beverages as a spice and flavouring agent. Ginger has been used for more than 2000 years in many cultures (Bartley and Jacobs, 2000). For instance, Asians, Egyptians, Greeks and Romans
were well aware of the ginger’s nutritional and medical importance and often used it for the treatment of various symptoms such as nausea, stomach discomfort, diarrhoea, headache and common cold (Miyoshi et al., 2003). Various studies demonstrated the strong pharmacological properties of ginger as an anti-diabetic, anti-inflammatory (Minghetty et al., 2007), anti-microbial, anti-carcinogenic, analgesic (Li et al., 2012), anti-vomiting agent and to decrease the intensity of pregnancy-induced nausea (Ozgoli et al., 2009). It is known that ginger contains numerous of pharmacologically active compounds. They are essentially presented as volatiles compounds (essential oils), gingerols and shogaols (Li et al., 2016). Gingerols area series of homologous phenols; essentially 6, 8, and 10 gingerol, contributing to the ginger’s pungency. Shogaols are the dehydrated form of gingerols and gingerdiones mainly 6, 8, and 10 shogaol and zingerone (Jiang et al., 2005). In general, ginger rhizomes are commercially sold fresh. With the benefits of practical handling and long shelf life, ginger powder has become an essential solution for the non-producing countries such as Algeria, as a food and/or pharmaceutical ingredient. Drying is one of the conventional methods commonly used to preserve food due to its simplicity and low cost. It is known that dehydration or drying process was applied in foods in order to extend their shelf-life by reducing the water activity (Prasad et al., 2006), which is essential for the growth of bacteria, mould and yeasts. In the food drying process, temperature and process duration are key factors for the product’s preservation quality and energy consumption. Various comparative studies were investigated regarding different drying processes such as sun drying, oven drying and microwave drying (Cheng et al., 2011; Li et al., 2016). However, few studies focused on finding the optimal temperature applied in the same drying process that allows both the obtainment of a high quality ginger powder and also the protection of bioactive compounds with maximum beneficial properties.
The objective of this work was to evaluate the effect of various drying temperatures ranging from 40° to 100°C on the quality attributes of dried ginger powder. Total phenolic, flavonoid compounds, carotenoids, total protein, fat contents and the antioxidant activity of the ginger powders were determined. Furthermore, the different concentrations of 6- gingerol, 6-shogoal, zingerone and β-carotene were assessed by HPLC. Scanning electron microscopy (SEM) was used to examine the structural characteristics of the obtained ginger powders.
Materials and Methods Reagents and chemicals
Sodium carbonate, 2, 2-diphenyl-1-picryl-hydrazyl (DPPH), Folin–Ciocalteu reagent (FCR), standard chemicals (zingerone, 6-shogoal, 6-gingerol and β-carotene), gallic acid, catechin, sodium hydroxide, aluminium chloride, sodium nitrate were purchased from Sigma-Aldrich (Dublin, Ireland). Analytical grade acetone, acetonitrile, ethanol, ethyl acetate, methanol and hexane were attained from Merck (Gernsheim, Germany).
Plant material and sample preparation
Fresh mature ginger rhizomes (origin from China) were purchased during the time between March and June, from a local Algerian market (Bejaia city). The rhizomes were thoroughly washed and rinsed to remove impurities. The washed ginger rhizomes were then chopped into 3 mm thick slices. The average moisture content of the ginger samples was determined using the Association of Official Analytical Chemist method (AOAC 2000). Briefly, individual loads of 100 g of chopped ginger slices were subjected to oven (Binder E28, Germany) drying at 40°, 60°, 80° and 100°C until a constant weight was obtained. The mass was periodically measured during the drying process and the weight loss (%) was calculated as follows:
Weight loss (%) = t x 100
W0 (1)
where, W0 and Wt (g) are the initial weight and the weight at a specific time,
respectively.
Once dried, the ginger slices were ground into powders using an electric grinder (IKA model-A11, Baden-Württemberg, Germany) to a granulometry lower than 250 μm in size. Finally, the sieved ginger powders were individually transferred to air-tight amber glass containers and stored in the dark until further use.
Extraction of phenolic compounds
The phenolic contents were extracted from each individual ginger powder in accordance to a method previously developed by Mukherjee et al. (2012). Briefly, 1 g of individual ginger powder was extracted at 40°C under continuous agitation using 50 ml of 5% (v/v) ethanol. The extract mixture was then centrifuged at 1,800 ×g for 30 min, followed by filtration using Whatman qualitative filter paper No. 1. The filtrates were afterwards transferred to air-tight amber glass containers and stored at 4°C until further analysis.
Determination of total phenolic content
Total phenolic content (TP) from the ginger’s ethanolic extracts was measured by the Folin-Ciocalteu assay as described by Chan et al. (2008), with some minor modifications. Two hundred µl of each ginger extract (prepared in section 2.3) were mixed with 500 µl of 1:10 (v/v) aqueous Folin-Ciocalteu reagent and 1500 µL of sodium bicarbonate (75 g/l), vortexed, then incubated for 30 minutes at room temperature. The absorbance was recorded at 765 nm using an ultraviolet (UV) spectrophotometer (UV-mini 1240, Shimadzu, Japan). The TP content of the ginger extracts was calculated from the calibration curve using gallic acid as the standard. The samples were analysed in triplicate and the mean value of three tests was used. The results were expressed as milligram of gallic acid equivalent per gram of dry sample (GAE/g).
Determination of total flavonoids content
The total flavonoids content (TF) can be determined by quantifying the yellow colour intensity developed by the complex flavonoids- Al3+ formed due to the
described by Jia et al. (1999), 500 µl of ginger extracts (prepared in section 2.3) were diluted with 2 ml of distilled water, then 150 µl of 5% (w/v) NaNO2 solution
was added. This mixture was allowed to stand for 6 minutes. Afterwards, 150 µl of 10% (w/v) AlCl3 solution was added to the mixture and allowed to stand for
another 6 minutes. Finally, 2 ml of 4% (w/v) NaOH solution were added, mixed and incubated further in the darkness for 15 minutes at room temperature. The absorbance was measured at 510 nm using an ultraviolet (UV) spectrophotometer (UV-mini 1240, Shimadzu, Japan). The samples were independently analysed in triplicate and the mean value of three tests was used. The results were expressed as milligram of catechin equivalent per gram of dry weight (mg CE/g) from the standard curve prepared with catechin.
Determination of total carotenoids content
The total carotenoid content (TC) was measured according to Sass-Kiss et al. (2005). A hundred mg of dried ginger powder was accurately weighed and suspended for 30 minutes in 10 ml of 2:1:1 (v/v) mixture of hexane, acetone and ethanol, respectively. This mixture was vortexed for 15 minutes, centrifuged at 2250 × g and the top layer was then recovered. The absorbance of the separated hexane portion was measured at 450 nm using an ultraviolet (UV) spectrophotometer (UV-mini 1240, Shimadzu, Japan). The extracted samples were independently analysed in triplicate and the mean value of three measurements was used. The results were calculated on the basis of the calibration curve that was obtained by using carotene as the standard and expressed as milligram of β-carotene equivalent per 100 gram of dry ginger (mg βCE/100 g).
Determination of the DPPH radical scavenging activity
The antioxidant activity was evaluated by the DPPH radical scavenging assay according to the method described by Brand-Williams et al. (1995) with minor modifications. Briefly, 3ml of 70 μM DPPH already dissolved in methanol were mixed with 100 μl of each ginger extract (prepared in section 2.3). After incubation at room temperature for 30 minutes at 37°C, the absorbance was measured at 517 nm using an ultraviolet (UV) spectrophotometer (UV-mini 1240, Shimadzu, Japan). The results were expressed as the percentage of inhibition of the DPPH radical and calculated as follows:
DPPH inhibition % = Ac-AS
Ac x 100 (2)
where: Ac and As are the absorbance of the control and the sample, respectively.
The samples were analysed in triplicate.
Determination of 6-gingerol, 6-shaogoal and zingerone by HPLC
HPLC analysis was performed using an Agilent 1260 Infinity Series system (Agilent Technologies, Waldbronn, Germany) equipped with a G1311B 1260 quaternary pump, G1329B 1260 autosampler, vacuum degasser, G1316A 1260 temperature-controlled column compartment and G1315D 1260 DAD VL detector. Standard solutions of zingerone, 6-gingerol and 6-shogaol were individually prepared in the range of 2 µg/ml to 500 µg/ml. The column used was Kromasil100
C18 (250 × 4.6 mm, 5µm). The column temperature was maintained at 40°C. The typical injection volume was 10 µl. The eluents were 0.1% (v/v) phosphate buffer (solvent A) and acetonitrile (solvent B). The gradient elution profile was 0-3 min: 30- 70% A; 3- 40 min: 30- 70% B, then at 40 - 50 min 30- 70% A. The mobile phase flow rate was adjusted to 1.0 ml/min. The detection wavelength was set at 280 nm. HPLC data was collected and analysed by Agilent OpenLAB 2.2 chromatography data systems (CDS) software. The identification of zingerone, 6-gingerol and 6-shogaol components in the ethanol ginger extracts (see section 2.3) was achieved by comparing their retention times (RT) to those of the used standards.
Determination of β-carotene by HPLC
The β-carotene quantification in ginger was determined by HPLC analysis as reported by Stinco et al. (2014) and Benmeziane et al. (2018). Briefly, 10 mg of ginger powder were mixed with 1 ml of Milli-Q-water. The sample mixtures were centrifuged for 3 minutes at 1,800 ×g and the supernatant was discarded. One mililitre of the 1:1 (v/v) acetone: hexane extraction solvent was then added to each sample, centrifuged, vortexed and re-centrifuged for 3 minutes at 1,800 ×g. The supernatant was then collected. These steps were repeated until the yellow coloration disappeared. The organic fraction was then evaporated under N2. The
obtained dried residues were re-dissolved in 100 μl of acetonitrile for the HPLC assay. The standard solutions of β-carotene were prepared in the range between 0.005 µg/ml and 2.8 µg/ml. The separation was carried out using a Poroshell 120 EC-C18 column (4.6× 50 mm, 2.7 µm). The column temperature was maintained at 40°C. The used eluents were ethyl acetate (solvent A), methanol (solvent B) and acetonitrile (solvent C). The linear gradient elution settings were: 0-5 min: 85% A, 15% B; 5-9 min: 60% A, 20% B, 20% C; 9-15 min, 85% A, 15% B. The mobile phase flow rate was adjusted to 1.0 mL/min. The detection wavelength was set at 280 nm. The HPLC data was collected and analysed by Agilent OpenLAB 2.2 chromatography data systems (CDS) software. The β-carotene identification was achieved by comparing their retention times (RT) to those of the used standards. Determination of moisture, fat and protein contents
Moisture and total solids (TS) components of the ginger powders were determined by the SMART-6TMAnalyzer (CEM Corporation, NC, USA). The fat content was
quantified using the ORACLE Universal Fat Analyzer (CEM Corporation, NC, USA) that utilizes its proprietary nuclear magnetic resonance (NMR) signal to accurately measure the fat content of any product without the need for method development. Total protein and water-soluble protein (WSP) components were determined using the SprintTM Rapid Protein Analyzer (CEM Corporation, NC,
USA), previously standardized for crude protein determination according to Kjeldahl method (AOAC, 2000). The tests were performed in triplicate.
Water-soluble protein extraction
Two grams of ginger powder were weighed accurately and suspended in 100 mL Milli-Q water. The samples were shaken overnight (12-15 hours) at room
temperature using the LABOSHAKE shaker (Gerhardt GmbH, 53639 Konigswinter, Germany), centrifuged at 2,500 ×g for 20 min, then filtered using the Whatman No.1 filter paper. The supernatant was used for protein determination (WSP %) as described in section 2.10. Each ginger powder sample was extracted in triplicate.
Microstructure of the ginger powder
The differences of the microstructure characteristics of the ginger powders as a function of different drying temperatures were analysed using a Hitachi S700 scanning electron microscope (SEM) (Hitachi, Berkshire SL6 8YA, England). All the samples were scattered and mounted on SEM aluminium stubs, sputter-coated with gold under vacuum (EMITECH-K550, Ashford, England). The SEM images were obtained by examining the powder particles at 1.5 KV at a magnification of 1000 x.
Statistical Analysis
The analysis of variance (ANOVA) was performed with Minitab® 18.1 (MINITAB
Inc., Coventry, UK), using the general linear model (GLM) procedure and the Tukey’s test for pairwise comparison. The Pearson correlation analysis was used to explore the relationship between variables. All measurements were carried out in triplicate and the results were expressed as the mean value ± standard deviation (SD).
Results and Discussion
Drying kinetic and moisture loss
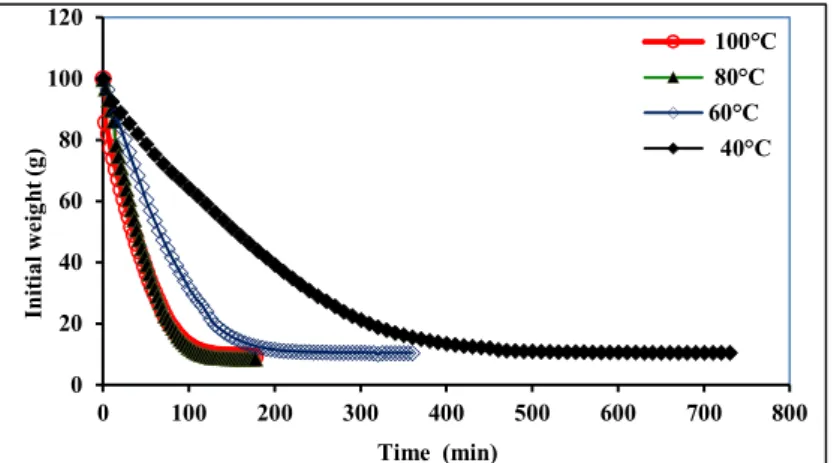
The ginger slices were dried from an initial moisture content of 90% to less than 10% using different temperatures. The drying kinetics and the moisture content profiles are presented in Figure 1.
Figure 1. Drying kinetics and moisture loss of the ginger samples obtained at different drying temperatures 0 20 40 60 80 100 120 0 100 200 300 400 500 600 700 800 In it ia l w ei gh t ( g) Time (min) 100°C 80°C 60°C 40°C
As expected, the drying times were inversely related to the applied drying temperatures. Drying at 40°C showed the lowest moisture loss rate, the drying process being accomplished after 710 min.
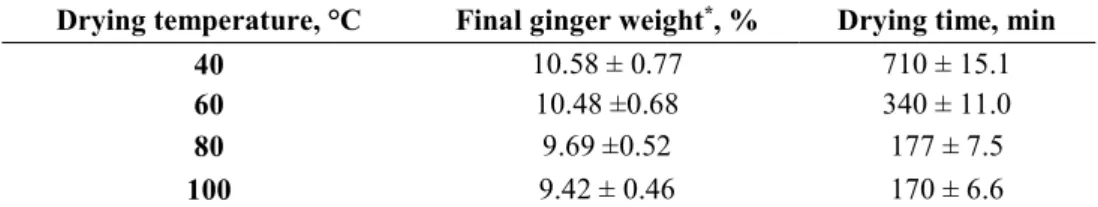
As it can be seen from the Table 1, the drying time was reduced by more than 50% when the drying temperature increased from 40°C to 60°C. These findings are in agreement with those of Arslan and Ozcan (2011), who reported a faster water loss at high drying temperatures. As shown in Fig. 1, the drying process was fast in the initial phase due to the high water content, which led to a high moisture evaporation rate. Therefore, the major drying process occurred in the range of the falling rate period, which resulted from the predominance of the internal diffusion mechanism due to the presence of bound-water (Karathanos and Belessiotis, 1990; Kaymak-Ertekin, 2002).
Table 1. Drying time and final weight at the end of the ginger powders drying process Drying temperature, °C Final ginger weight*, % Drying time, min
40 10.58 ± 0.77 710 ± 15.1
60 10.48 ±0.68 340 ± 11.0
80 9.69 ±0.52 177 ± 7.5
100 9.42 ± 0.46 170 ± 6.6
Values are the means of triplicate analysis ±standard deviation.
* Final ginger weight was recorded at a constant interval time (min) until achieving a constant weight, which is expressed as percentage.
In this context, Baker (1997) reported that the water in larger capillaries was removed first, followed by that in smaller capillaries with a decrease of the evaporation rate. By approaching the end of the drying process, the drying rate decreases so that water becomes more difficult to be removed due to the high bound-water to the sites of the food components; i.e. protein and starch.
Total phenolic, flavonoid and carotenoids compounds Phenolic content
Total phenolic contents (TP) of different dried ginger samples, expressed as mg of gallic acid per gram of dry sample, are given in Table 2. TP values in the ginger extracts were significantly different (P<0.05) and were positively related to the drying temperatures. The ginger sample dried at 100°C exhibited the highest TP value (24.15 mg GAE/g) compared to the samples dried at lower temperatures; i.e. 16.36, 14.48 and 12.21mg GAE/g for the samples dried at 80°, 60° and 40°C, respectively. It is known that thermal processing is the most critical factor that may influence the amount of the phenolics. Kubra and Rao (2012) reported that heat energy may cause the breakdown of the cellular constituents leading to a higher release of polyphenols from the matrices, which may explain the high content of TP obtained at 100°C in the current study. On the other hand, Jelled et al. (2015) concluded that a decline trend of the TP values could be attributed to the degradation of phenolic compounds during the drying process, powdering and
storage. Different values of phenolic compounds have been reported by other studies on dried ginger. For instance, An et al. (2016) and Gumusay et al. (2015) have reported values of 9.69 mg GAE/g and 3.54 mg GAE/g, respectively, for the ginger powder dried at 60°C.Whereas, Li et al. (2016) reported a content of 27.40 mg GAE/g for the dried ginger obtained at 40°C. The differences among these results could be attributed to the variety, genetics and the origin of the ginger rhizomes used.
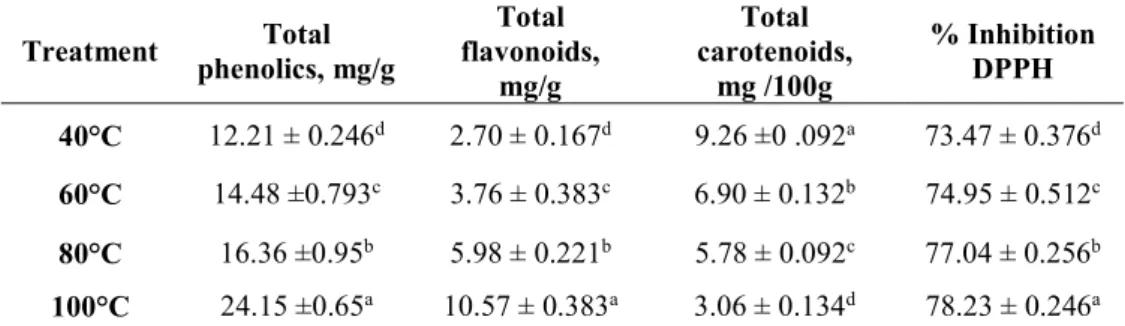
Table 2. Effect of drying temperatures on total phenolic, flavonoid, carotenoid content and the antioxidant activity of ginger powder
Treatment phenolics, mg/g Total flavonoids, Total mg/g Total carotenoids, mg /100g % Inhibition DPPH 40°C 12.21 ± 0.246d 2.70 ± 0.167d 9.26 ±0 .092a 73.47 ± 0.376d 60°C 14.48 ±0.793c 3.76 ± 0.383c 6.90 ± 0.132b 74.95 ± 0.512c 80°C 16.36 ±0.95b 5.98 ± 0.221b 5.78 ± 0.092c 77.04 ± 0.256b 100°C 24.15 ±0.65a 10.57 ± 0.383a 3.06 ± 0.134d 78.23 ± 0.246a
The values presented are the means ± standard deviation (n=3). The means in the same column bearing a different superscript letter differs significantly (P< 0.05).
Flavonoid content
The total flavonoid content (TF) exhibited the same trend as TP. As it can be seen from the data in Table 2, the TF values significantly (P<0.05) increased by rising the drying temperatures. The highest amount of TF (10.57 mg CE/g) was noticed in the ginger powder dried at the high temperature of 100°C. This amount decreased to 5.98 mg for the ginger dried at 80°C, and a further TF loss was obtained by decreasing the drying temperature so that at 40°C a 2.7 mg CE/g value was reached. Our results are in accordance o those of An et al. (2016) and Shieber et al. (2001) who reported that a long period of time and a high temperature during the drying process are among the crucial factors that influence the flavonoids content. High drying temperatures contribute to the destruction of cellular constituents, which release the flavonoids and make them available during extraction. On the other hand, a short exposure time during the drying process makes it advantageous in terms of flavonoid preservation.
Carotenoid content
The total carotenoids (TC) were assessed in different ginger powders and the results are illustrated in Table 2. The results showed significant differences (P<0.05) for the (TC) contents in the ginger powders with an inverse bearing of the drying temperature. The highest (TC) content (9.26 mg/100 g) was recorded for the ginger dried at 40°C. This value steadily decreased by increasing the drying temperature to reach a TC concentration reduction almost of 2-folds at 100°C (3.06 mg/100 g). It has been reported that carotenoids are heat sensitive components that
can be significantly deteriorated by high temperature treatments (Rodriguez-Amaya and Kimura 2004). In comparison to the TC values obtained in our study, Gopalan et al. (2004) and Sangwan et al. (2014) reported very low concentrations of carotenoids ranging from 0.68 to 0.81 mg/100 g in the ginger powder prepared by different drying methods such as shade, solar, oven and microwave. The obtained differences may be due to the effect of the applied treatment on the ginger, the sensitivity of the carotenoids and the varietal difference in the ginger selected for the study.
Analytical characteristics by HPLC
6-Gingerol, 6- shogaol and zingerone compounds
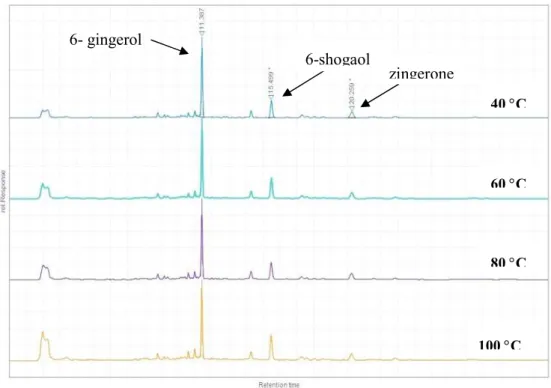
Ginger contains a number of important phenolic and pharmacologically active compounds particularly gingerols and shogaols. The pungency of fresh ginger is attributed to the presence of gingerols with 6-gingerol compound (1-[4'- hydroxy-3'-methoxyphenyl]-5'-hydroxy-3-decanone) as the major compound. The identification and quantification of the 6-gingerol, 6-shogaol and zingerone components were performed by HPLC assay as described in section 2. 8, and a representative typical chromatogram is shown in Figure 2 and the mean values are given in Table 3.
Figure 2. HPLC chromatograms of 6-gingerol, 6- shogaol and zingerone of the four ginger powders obtained at different drying temperatures
The results clearly showed that these components in the dried gingers were significantly (P<0.05) influenced by the drying temperatures. The amount of
6-6- gingerol 6-shogaol zingerone 40 C 60 C 80 C 100 C
gingerol gradually decreased as the applied drying temperature increased. As it is shown in Table 3, the value of 6-gingerol decreased from 4.96 mg/g at 40°C to reach the lowest value of 2.84 mg/g at 100°C. This finding is in agreement to that of Bhattarai et al. (2001) and Li et al. (2016). Gingerols are thermally labile molecules. During a drying process, a higher applied temperature would promote the decomposition and transformation of gingerols (6- gingerol, 8- gingerol and 10-gingerol) to shogaols (6-shogaol, 8-shogoal and 10-shagoal) (Huang et al., 2011; Puengphian and Sirichote, 2008). Consequently, the amount of 6- gingerol decreased as the drying temperature increased. Additionally, it should be noted that different 6-gingerol contents have been reported by other studies in dried ginger powders. An et al. (2016) reported a lower value (2.50 mg/g) of 6-gingerol in the ginger powder obtained at 60°C compared to the relevant result obtained in this study, whereas, Li et al. (2016) reported a higher content (5.7 mg/g) of 6-gingerol in the ginger samples dried at 40°C. These findings highlight the sensitivity of 6-gingerol to high temperatures which leads to its transformation to shogaols. With respect to the shogaols compounds, which are the dehydrated form of gingerols, the increasing of the drying temperature over 60°C led to a significant (P<0.05) increase for the 6-shogaol compound that reached the highest content (5.82 mg/g) under the 100°C treatment (Table 3). In agreement to these findings, Huang et al. (2011) reported that the 80°C hot air drying led to a higher conversion rate of 6-shogaol compared to that obtained at 40°C. Moreover, Cheng et al. (2011) and Li et al. (2016) reported a similar trend in the 6-shogaol conversion rate and concluded that the transformation process of gingerols to shogaols is conditioned by the employed drying temperature and the drying time.
Table 3. Effect of drying temperatures on 6-gingerol, 6-shogoal, Zingerone and β-carotene compounds obtained by HPLC assay
Treatment 6-gingerol, mg/g 6-shogaol, mg/g Zingerone, mg/g β-carotene, mg/100g
40°C 4.96 ± 0.17a 4.88 ± 0.18c 0.20 ± 0.04b 2.56 ± 0.23a
60°C 4.31 ± 0.21b 4.96 ± 0.14c 0.22 ± 0.06ab 2.36 ± 0.42ab
80°C 4.08 ± 0.10c 5.43 ± 0.16b 0.23 ± 0.04ab 2.02 ± 0.81ab
100°C 2.84 ± 0.04d 5.82 ± 0.20a 0.25 ± 0.01a 1.79 ± 0.52b
The values presented are the means ± standard deviation (n=3). The means in the same column bearing a different superscript letter differ significantly (P< 0.05)
Like shogaols, zingerone (4-(4-hydroxy-3-methoxyphenyl)-2-butanone) is another compound that is absent in fresh ginger and generated during the processing of ginger at high temperature. As it can be seen from the data in Table 3, the zingerone content was positively related to the applied drying temperature. The drying process at 100°C exhibited a significantly higher (P<0.05) value of zingerone (0.25 mg/g) compared to the one obtained after the 40°C treatment (0.20 mg/g). In this context, Li et al. (2016) reported a similar trend for the dried ginger samples and concluded that zingerone concentrations are enhanced by high
processing temperatures. However, these authors reported a lower content of zingerone (0.158 mg/g) compared to our results.
β-carotene compound
A comparison between the β-carotene contents as obtained by the HPLC assay after different ginger treatments is presented in Table 3. The results revealed that β-carotene values were inversely related to the applied drying temperature. The ginger powder dried at 40°C showed significantly (P<0.05) the highest β-carotene content (2.56 mg/100 g), which decreased constantly by rising the drying temperature so as to at 100°C it reached the lowest value (1.79 mg/100 g). These results are in accordance to the total carotenoids (section 3.2.3, Table 2) and are also in agreement to those of Georgé et al. (2011), Arkoub-Djermoune et al. (2016) and Lu et al. (2018) who elucidated the inverse relationship between β-carotene and high temperature processing, light and storage period. These factors may cause the isomerisation and oxidation of β-carotene, followed by a cleavage due to its unsaturated structure.
Compositional properties of the ginger powders
The mean values of moisture, total protein, water-soluble proteins and fat contents determined by rapid techniques (see section 2.10) are given in Table 4. The moisture content of the ginger powders significantly (P<0.05) decreased once the drying temperatures were increased. In this context, Shirin Adel and Prakash (2010) and Sangwan et al. (2014) reported moisture values of 6.67% and 15.02% for the ginger powder obtained by drying at 40° and 50°C, respectively.
Contrary to the moisture result trend, the fat content was positively related to the drying process temperatures. This result could be attributed to the increased total solids in the ginger powders by increasing the drying temperatures. It should be noted that the difference between the highest and the lowest obtained fat values were 0.18%, though the differences were significant (P<0.05). In comparison to our results, Shirin Adel and Prakash (2010) and Odebumni et al. (2010) reported a higher fat content for the ginger powder dried at 40°C (3.72- and 5.62%, respectively), while Sangwan et al. (2014) found a less fat content (0.78%) at 50°C.
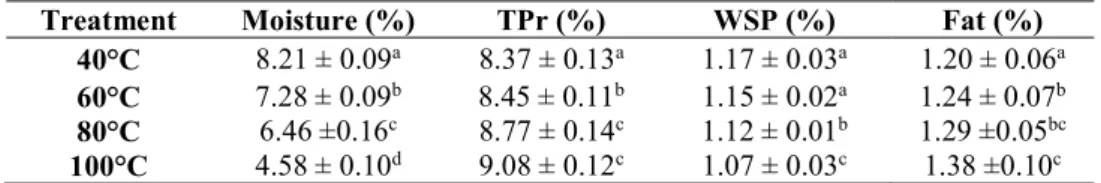
Table 4. Chemical composition of the ginger extracts obtained at different drying temperatures
Treatment Moisture (%) TPr (%) WSP (%) Fat (%)
40°C 8.21 ± 0.09a 8.37 ± 0.13a 1.17 ± 0.03a 1.20 ± 0.06a
60°C 7.28 ± 0.09b 8.45 ± 0.11b 1.15 ± 0.02a 1.24 ± 0.07b
80°C 6.46 ±0.16c 8.77 ± 0.14c 1.12 ± 0.01b 1.29 ±0.05bc
100°C 4.58 ± 0.10d 9.08 ± 0.12c 1.07 ± 0.03c 1.38 ±0.10c
The values presented are the means ± standard deviation (n=3). The means in the same column bearing a different superscript letter differ significantly (P<0.05). TPr: Total protein; WSP: Water-soluble protein.
With respect to the protein determination, the total protein (TPr %) content increased significantly (P<0.05) in the ginger powders by increasing the drying
process temperatures. The ginger powder obtained after the drying process at 100°C exhibited the highest TPr value (9.08%). This value was steadily and significantly decreased by decreasing the drying temperatures to reach the value of 8.37% TPr in the ginger powder obtained after the 40°C treatment (Table 4). Other studies on oven dried ginger reported a lower TPr values compared to the results obtained in this study. Shirin Adel and Prakash (2010) found a 5.09% protein content in the ginger powder dried at 40°C, while Sangwan et al. (2014) reported a total protein content of 5.70% in the ginger dried at 50°C. The level of water-soluble proteins (WSP) was determined as an indicator for the impact of the drying temperatures on the availability of small and soluble proteins in the ginger powder. Contrary to the TPr, the WSP contents were inversely related to the applied drying temperatures. The highest amount (1.17 %) was obtained at 40°C. This amount steadily decreased to reach the lowest value (1.07 %) at 100°C. This decrease is most likely attributed to the denaturation and changes in the molecular and structural characteristics of the small proteins by increasing the drying temperature that caused more proteins to bind and to become insoluble in water. With respect to the statistical analysis, although the differences among the WSP values were very small, they appeared significantly different (P<0.05) most likely due to the very low values of the adjusted mean square error obtained in comparison to the means (0.0004). Overall, it is worth noting that the differences in the chemical composition of the ginger powders obtained in this study compared to other studies could be attributed to the geographic origin, the atmospheric conditions and the maturity of the used rhizomes.
Antioxidant activity
To evaluate the influence of different drying temperatures on the antioxidant activity of ethanol ginger extracts, the DPPH radical scavenging assay was performed and the results are presented in Table 2. The results revealed that the inhibition percentage of the DPPH radical was significantly increased (P<0.05) in ginger by increasing the drying temperatures. The ginger sample dried at 100°C showed the highest DPPH scavenging activity equivalent to 78.23%, whereas the minimum DPPH scavenging activity value corresponding to 73.47% was obtained at 40°C. It has been reported that phenolic compounds are potential antioxidants and free radical-scavengers and a good correlation should be obtained between the content of phenolic compound and the antioxidant activity (Kumar et al., 2008; An et al., 2016). This result is in accordance with the result of total phenolic and total flavonoid contents of the same treatments (Table 2), thus reflecting the higher antioxidant activity obtained by increasing the drying temperature. In agreement to these findings, Praven et al. (2007), and Hasna and Afidah (2009) concluded that the ginger with high levels of TP and TF contents exhibited a high free radical scavenging activity. Furthermore, the obtained DPPH scavenging ability showed a significant (P<0.01) positive correlations with the TP and TF contents (0.89 and 0.92, respectively). Similar trend of the correlations was reported by Velioglu et al. (1998), and Shirin Adel and Prakash (2010). In addition, a significant (P<0.01) inverse correlation was obtained between the radical scavenging activity and TC
content (-0.96). This correlation would be expected, since TC values showed a significant reduction trend by increasing the drying temperatures and were in contrast to TP and TF contents (Table 2). Accordingly, these findings may suggest that the high antioxidant activity of ginger extracts may be attributed to the phenolic compounds including flavonoids and other released compounds that are not considered in the current study, rather than carotenoids.
Microstructure of ginger powders
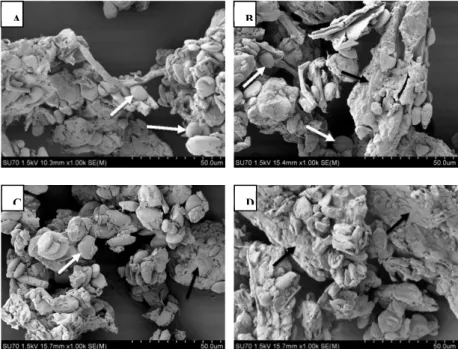
The effects of the applied oven drying temperatures on the microstructure characteristics of the ginger powder are shown in Figure 3. The irregularly aggregated parenchyma tissue formed the main matrix (pointed with black arrows), and the scattered starch grains (pointed with white arrows) throughout the parenchyma made the structural dimensions of these images. The SEM micrographs clearly showed the destruction of the parenchyma cell wall and the absence of the oils cells in the ginger powders as a result of the drying process. The same observations were reported by Azian et al. (2004) and An et al. (2016). Fig. 3A and 3B which represented the ginger powders dried at 40°C and 60°C showed abundant starch grains of well-retained shape that were dispersed all over the parenchyma matrix and were more pronounced compared to the ginger’s structure after the100°C treatment (Figure 3D). It should be noted that the starch grains of the ginger dried at 80°C (Figure 3C) were markedly destructed and embedded within the parenchyma matrix compared to the 40°C and 60°C treatments.
Figure 3. SEM micrographs (1000x) of the ginger powders obtained at four different drying temperatures. (A) 40°C; (B) 60°C; (C) 80°C and (D) 100°C. Black arrows indicate the ginger parenchyma tissue aggregates while the white arrows indicate the starch grains.
Scale bar is 50 μm
A B
Additionally, the microstructure of the ginger powder obtained after the 100°C drying process, as shown in Figure 3D, revealed a denser structure, with a more pronounced degree of gelatinization and a higher destruction degree of the strach granules compared to those of the ginger powders obtained at lower drying temperatures 40°, 60°, and 80°C (Figures 3A, 3B and 3C, respectively). This observation is in agreement to the one of Huang et al. (2011) who reported a serious broken down phenomenon of the ginger starch dried at 80°C. In this context, An et al. (2016) reported that a high temperature and a rapid drying process make the inner water difficult to remove. This fact led the cellular structures to crosslink together so that the starch grain showed an important degree of gelatinization.
Conclusions
The present study provided some comparative results on the chemical and bioactivity characteristics of the ginger powders obtained through oven drying process using four different temperatures (40°, 60°, 80° and 100°C). The results led to the conclusion that using an elevated temperature is beneficial in the drying process due to certain associated advantages. For instance, it exhibited a positive effect on the preservation of the total polyphenols, total flavonoids, and consequently higher antioxidant activity. Zingerone, 6-shogaol, total protein and fat contents of the ginger powders were significantly and positively related to the applied drying temperatures. Whereas, 6-gingerol and total carotenoids were inversely related to the drying temperatures, most probably due to the degradation of these compounds caused by high drying temperatures. Accordingly, the 100°C treatment revealed the most appropriate drying temperature in terms of ginger powder quality attributes. Overall, this study emphasized the profound influence of both of the drying time and the drying temperature on the final composition of the ginger powder. The obtained results offer a better comprehension of the influence of the oven drying process on the ginger powder functional properties and structure characteristics, allowing the optimization and the development of food and pharmaceutical industries applications.
Acknowledgments
The authors would like to thank Dr. Ehab Romeih at Cairo University for performing the statistical analysis and his helpful editing of the manuscript. The authors would acknowledge Bernal Institute (University of Limerick, Ireland) for supporting this work.
References
Afshari, A.T., Shirpoor, A., Farshid, A., Saadatian, R., Rasmi, Y., Saboory, E., et al. 2007. The effect of ginger on diabetic nephropathy, plasma antioxidant capacity and lipid peroxidation in rats. Food Chemistry, 101, 148-153.
An, K., Zhao, D., Wang, Z., Wu, J., Xu, Y., Xiao, G. 2016. Comparison of different drying method on Chinese ginger (Zingiber officiale Roscoe): Changes in volatiles, chemical profile, antioxidant properties, and microstructure. Food Chemistry, 197, 1292-1300. AOAC. 2000. Official methods of analysis. Arlington, USA, Association of Official
Analytical Chemists.
Arkoub-Djermoune, L., Boulekbache-Makhlouf, L., Zeghichi-Hamri, S., Bellili, S., Boukhalfa, F., Madani, K. 2016. Influence of the thermal processing on the physicochemical properties and the antioxidant activity of a solanaceae vegetable: eggplant. Journal of Food Quality, 39, 181-191.
Arslan, D., Ozcan, M.M. 2011. Dehydration of red bell-pepper (Capsicum annuum L). Change in drying behaviour, Colour and Antioxidant Content. Food and Bioproducts Processing, 89, 504-513.
Azian, M.N., Mustafa Kamal, A. A., Azlina, M. N. 2004. Changes of cell structure in ginger during processing. Journal of Food Engineering, 62, 359-364.
Baker, C.G.J. (Ed.). 1997. Industrial Drying of Food. Blackie Academic and Professional/Chapman and Hall, London, 7-30.
Bartley, A., Jacobs, A. 2000. Effects of drying on flavour compounds in Australian grown ginger Zingiber officinale. Journal of the Science of Food and Agriculture, 80, 209-215. Benmeziane, A., Boulekbache-Makhlouf, L., Mapelli-Brahm, P., Khaled Khodjaa, N.,
Remini, H., Madani, K., Meléndez-Martínez A, J. 2018. Extraction of carotenoids from cantaloupe waste and determination of its mineral composition. Food Research International, 111, 391-398.
Bhattarai, S., Tran, V.H., Duke, C.C. 2001. The stability of gingerol and shoagoal in aqueous solution. Journal of Pharmaceutical Sciences, 10, 1658-1663.
Brand-Williams, W., Cuvelier, M.E., Berset, C. 1995. Use of a free radical method to evaluate antioxidant activity. Food Science and Technology, 28, 25-30.
Chan, E.W.C., Lim, Y.Y., Wong, L.F., Lianto, F.S., Wong, S.K., .Lim, K.K., Joe, C.E., Lim, T.Y. 2008. Antioxidant and tyrosinase inhibition properties of leaves and rhizomes of ginger species. Food Chemistry, 109(3), 477-483.
Cheng, X.L., Liu, Q., Peng, Y.B., Qi, L.W., Li, P. 2011. Steamed ginger (Zingiber officinale): Changed profile and increased anticancer potential. Food Chemistry, 129, 1785-1792.
Gong, F., Li, F., Zhang, W., Li, J., Zhang, Z. 2012. Effect of crude flavonoids from Tatary buckwheat on alloxan induced oxidative stress in mice. Bangladesh Journal Pharmacological, 7, 124-130.
Gopalan, C., Ramasastri, B.V., Balasubramanium, S.C. 2004. Nutritive value of Indian foods. National Institute of Nutrition, Indian Council of Medical Research, Hyderabad, 48-50.
Georgé, S., Tourniaire, F., Gautier, H., Goupy, P., Rock, E. 2011. Changes in the contents of carotenoids, phenolic compounds, and vitamin C during technical processing and lyophilisation of red and yellow tomatoes. Food Chemistry, 124, 1603-1611.
Gumusay, A.K., Borazan, A.A., Ercal, N., Demirkol, O. 2015. Drying effects on the antioxidant properties of tomatoes and Ginger. Food Chemistry, 173, 156-162.
Hasna, O., Afidah, A. 2009. Antioxidant activity and phenolic content of Paederiafoetida and Syzygiumaqueum. Molecules, 14, 970-978.
Huang, T.C., Chung, C.C., Wang, H.Y., Law, C.L., Chen, H.H. 2011. Formation of 6-shogaol of ginger oil under different drying conditions. Drying Technology, 29, 248-255.
Jayashree, E., Visvanathan, R., John Zachariah, T. 2014. Quality of dry ginger (Zingiber officinale) by different drying methods. Journal of Food Science and Technology, 51, 3190-3198.
Jelled, A., Fernandes, A., Barros, L., Chahdoura, H., Achour, L., Ferreira, I.C.F.R., Ben Cheikha, H. 2015. Chemical and antioxidant parameters of dried forms of ginger rhizomes. Industrial Crops and Products, 77, 30-35.
Jia, Z., Tang, M., Wu, J. 1999. Determination of flavonoid contents in mulberry and their scavenging effects on superoxide radicals. Food Chemistry, 64(4), 555-559.
Jiang, H., Solyom, A.M. Timmermann, B.N., Gang, D.R. 2005. Characterization of gingerol-related compounds in ginger rhizome (Zingiber Officinale Rosco) by high-performance liquid chromatography/ electrospray ionizations mass spectrometry. Rapid Communications in Mass Spectrometry, 19, 2957-2964.
Kahkonen, M., Hopia, A., Vuorela, H., Rauha, J., Pihlaja, K., Kujala, T., Heinonen, M. 1999. Antioxidant activity of plant extracts containing phenolic compounds.Journal of Agricultural Food Chemistry, 47, 3954-3962.
Karathanos, V.T., Belessiotis, V.G. 1997. Sun and artificial air drying kinetics of some agricultural products. Journal of Food Engineering, 31, 35-46.
Kaymak-Ertekin, F. 2002. Drying and rehydrating kinetic of green and red peppers. Journal of Food Science, 67, 168-175.
Kubra, I.R., Rao, L.J.M. 2012. Microwave drying of ginger (Zingiber Officinale Rosco) and its effect on polyphenolic content and antioxidant activity. International journal of Food Science and Technology, 479(11), 2311-2317.
Kumar, R., Sivakumar, T., Sunderam, R., Manjusha Saroha, K., Singh, N., Vashishta, B. 2008. Antioxidant and free radical scavenging potential of Citrulluscolocynthis (L.) Schrad. methanolic fruit extract. Acta Pharmaceutica, 58, 215-220.
Li, F., Nitteranon, V., Tang, X., Liang, J., Zhang, G., Parkin, K.L., Hu, Q. 2012. In vitro antioxidant and anti-inflammatory activities of 1- dehydro-[6]-gingerdione shogaol, 6-dehydroshogaol and hexahydrocurcumin. Food Chemistry, 135, 332-337.
Li, Y., Hong, Y., Han, Y., Wang, Y., Xia, L.2016. Chemical characterization and antioxidants activities comparison in fresh, dried, stir-frying and carbonized ginger. Journal of Chromatography B, 1011, 223-232.
Lu, Q., Peng, Y., Zhu, C., Siyi Pan, S. 2018.Effect of thermal treatment on carotenoids, flavonoids and ascorbic acid in juice of orange cv. Cara Cara. Food Chemistry, 265, 39-48.
Minghetti, P., Sosa, S., Cilurzo, F., Casiraghi, A., Alberti, E., Tubaro, A., Loggia, R.D., Montanari, L. 2007. Evaluation of the topical anti-inflammatory activity of ginger dry extracts from soluion and plasters. Planta Medica, 73, 1525-1530.
Miyoshi, N., Nakamura, Y., Ueda, Y., Abe, M., Ozawa, Y., Uchida, K., Osawa, T. 2003. Dietary ginger constituents galanals A and B are potent apoptosis inducers in human T lymphoma jurkat cells. Cancer Letters, 199, 113-119.
Mukherjee, S., Mandal, N., Dey, A., Mondal, B. 2014. An approach towards optimization of the extraction of polyphenolic antioxidants from ginger (Zingiber officinale). Journal of Food Science and Technology, 51(11), 3301-3308.
Nwinuka, N., Ibeh, G.,Ekeke, G. 2005. Proximate composition and levels of some toxicants in four commonly consumed spices. Journal of Applied Sciences and Environmental Management, 9, 150-155.
Odebunmi, E., Oluwaniyi, O., Bashiru, M. 2010. Comparative proximate analysis of some food condiments. Journal of Applied Science Research, 6, 272-274.
Ozgoli, G., Goli, M., Simbar, M. 2009. Effects of Ginger Capsules on Pregnancy, Nausea, and Vomiting. The Journal of Alternative and Complementary Medicine, 15(3), 243-246.
Prasad, J., Vijay, V.K., Tiwari, G.N., Sorayan, V.P.S. 2006. Study on performance evaluation of hybrid drier for turmeric (Curcuma longa L.) drying at village scale. Journal of Food Engineering, 75, 497-502.
Praven, K., Ramamoorty, A., Awang, B. 2007. Antioxidant activity, total phenolic and flavonoid content Morindacitrifolia fruit. Journal of Engineering Science, 2, 70-80. Puengphian, C., Sirichote, A. 2008. 6-Gingerol content and bioactive properties of ginger
(Zingiber officinale Roscoe) extracts from supercritical CO2 extraction. Asian Journal of
food and Agro-Industry, 1, 29-36.
Pulido, R., Bravo, L., Saura-Calixto, F. 2000. Antioxidant activity of dietary polyphenols as determined by a modified ferric reducing antioxidant power assay. Journal of Agricultural and Food Chemistry, 40, 3396-3402.
Rodriguez-Amaya, D.B., Kimura, M. 2004 Harvest Plus Handbook for Carotenoid Analysis, International Food Policy Research Institute (IFPRI), Washington, DC. pp. 1-52.
Sait, S., Hamri-Zeghichi, S., Boulekbache-Makhlouf, L., Madani, K., Rigou, P., Brighenti, V., PioPrencipe, F., Benvenuti, S.F., Pellati, F. 2015. HPLC-UV/DAD and ESI-MSn analysis of flavonoids and antioxidant activity of an Algerian medicinal plant: Paronychia argentea Lam. Journal of Pharmaceutical and Biomedical Analysis, 111, 231-240.
Sangwan, A., Kawatra, A., Sehgal, S. 2014. Nutritional composition of ginger powder prepared using various drying methods. Journal of Food Science and Technology, 51, 2260-2262.
Sass-Kiss, A., Kiss, J., Milotay, P., Kerek, M.M., Toth-Markus, M. 2005. Differences in anthocyanin and carotenoid content of fruits and vegetables. Food Research International, 38, 1023-1029.
Shieber, A, Keller, P., Carle, R. 2001. Determination of phenolic acids and flavonoids of apple and pear by high- performance liquid chromatography. Journal of Chromatography A, 910(2), 265-273.
Shirin Adel, P.R., Prakash, J. 2010. Chemical composition and antioxidant properties of ginger root (Zingiber officinale). Journal of Medicinal Plants Research, 4, 2679-2679. Stinco, C.M., Benítez-González, A.M., Hernanz, D., Vicario, I.M., Meléndez-Martínez,
A.J. 2014. Development and validation of a rapid resolution liquid chromatography method for the screening of dietary plant isoprenoids: Carotenoids, tocopherols and chlorophylls. Journal of Chromatography A, 1370, 162-170.
Stoilova, I., Krastanov, A., Stoyanova, A., Denev, P.S.,Gargova, S. 2007. Antioxidant activity of a ginger extract (Zingiber officinale). Food Chemistry, 102, 764-770.
Velioglu, Y., Mazza, G., Gao, L., Oomah, B. 1998. Antioxidant activity and total phenolics in selected fruits, vegetables, and grain products. Journal of Agricultural Food Chemistry, 46, 4113-4117.
Yu, Y., Huang, T., Yang, B., Liu, X., Duan, G. 2007. Development of gas chromatography-mass spectrophotometry with microwave distillation and simultaneous solid-phase micro-extraction for rapid determination of volatile constituents in ginger. Journal of Pharmaceutical and Biomedical Analysis, 43, 24-31.