HAL Id: hal-02565273
https://hal.archives-ouvertes.fr/hal-02565273
Submitted on 18 Nov 2020
HAL is a multi-disciplinary open access
archive for the deposit and dissemination of
sci-entific research documents, whether they are
pub-lished or not. The documents may come from
teaching and research institutions in France or
abroad, or from public or private research centers.
L’archive ouverte pluridisciplinaire HAL, est
destinée au dépôt et à la diffusion de documents
scientifiques de niveau recherche, publiés ou non,
émanant des établissements d’enseignement et de
recherche français ou étrangers, des laboratoires
publics ou privés.
Distributed under a Creative Commons Attribution - NoDerivatives| 4.0 International
scleractinian and calcitic gorgonian deep-sea corals
Justine Kimball, Robert Eagle, Robert Dunbar
To cite this version:
Justine Kimball, Robert Eagle, Robert Dunbar. Carbonate ”clumped” isotope signatures in aragonitic
scleractinian and calcitic gorgonian deep-sea corals. Biogeosciences, European Geosciences Union,
2016, 13 (23), pp.6487-6505. �10.5194/bg-13-6487-2016�. �hal-02565273�
Biogeosciences, 13, 6487–6505, 2016 www.biogeosciences.net/13/6487/2016/ doi:10.5194/bg-13-6487-2016
© Author(s) 2016. CC Attribution 3.0 License.
Carbonate “clumped” isotope signatures in aragonitic scleractinian
and calcitic gorgonian deep-sea corals
Justine Kimball1,2, Robert Eagle1,3, and Robert Dunbar2
1Department of Atmospheric and Oceanic Sciences, Institute of the Environment and Sustainability,
University of California, Los Angeles, CA 90095, USA
2Department of Environmental Earth System Science, Stanford University, Stanford, CA 94025, USA
3European Institute of Marine Sciences (IUEM), Université de Brest, UMR 6538/6539, Rue Dumont D’Urville,
and IFREMER, Plouzané, France
Correspondence to:Robert Eagle (robeagle@g.ucla.edu)
Received: 27 October 2015 – Published in Biogeosciences Discuss.: 4 December 2015 Revised: 11 August 2016 – Accepted: 22 August 2016 – Published: 12 December 2016
Abstract. Deep-sea corals are a potentially valuable archive of the temperature and ocean chemistry of intermediate and deep waters. Living in near-constant temperature, salinity, and pH and having amongst the slowest calcification rates observed in carbonate-precipitating biological organisms, deep-sea corals can provide valuable constraints on pro-cesses driving mineral equilibrium and disequilibrium iso-tope signatures. Here we report new data to further develop “clumped” isotopes as a paleothermometer in deep-sea corals as well as to investigate mineral-specific, taxon-specific, and growth-rate-related effects. Carbonate clumped isotope ther-mometry is based on measurements of the abundance of the
doubly substituted isotopologue 13C18O16O2 in carbonate
minerals, analyzed in CO2gas liberated on phosphoric acid
digestion of carbonates and reported as 147values. We
ana-lyzed 147in live-collected aragonitic scleractinian
(Enallop-sammia sp.) and high-Mg calcitic gorgonian (Isididae and
Coralliidae) deep-sea corals and compared results to pub-lished data for other aragonitic scleractinian taxa. Measured
147values were compared to in situ temperatures, and the
re-lationship between 147and temperature was determined for
each group to investigate taxon-specific effects. We find that aragonitic scleractinian deep-sea corals exhibit higher values than high-Mg calcitic gorgonian corals and the two groups of coral produce statistically different relationships between
147–temperature calibrations. These data are significant in
the interpretation of all carbonate clumped isotope calibra-tion data as they show that distinct 147–temperature
calibra-tions can be observed in different materials recovered from
the same environment and analyzed using the same instru-mentation, phosphoric acid composition, digestion
tempera-ture and technique, CO2gas purification apparatus, and data
handling.
There are three possible explanations for the origin of these different calibrations. The offset between the corals of different mineralogy is in the same direction as published theoretical predictions for the offset between calcite and aragonite although the magnitude of the offset is different. One possibility is that the deep-sea coral results reflect high-Mg and aragonite crystals attaining nominal mineral equi-librium clumped isotope signatures due to conditions of ex-tremely slow growth. In that case, a possible explanation for the attainment of disequilibrium bulk isotope signatures and equilibrium clumped isotope signatures by deep-sea corals is that extraordinarily slow growth rates can promote the oc-currence of isotopic reordering in the interfacial region of growing crystals. We also cannot rule out a component of a biological “vital effect” influencing clumped isotope sig-natures in one or both orders of coral. Based on published experimental data and theoretical calculations, these biologi-cal vital effects could arise from kinetic isotope effects due to the source of carbon used for calcification, temperature- and
pH-dependent rates of CO2hydration and/or hydroxylation,
calcifying fluid pH, the activity of carbonic anhydrase, the residence time of dissolved inorganic carbon in the calcify-ing fluid, and calcification rate. A third possible explanation is the occurrence of variable acid digestion fractionation fac-tors. Although a recent study has suggested that dolomite,
calcite, and aragonite may have similar clumped isotope acid digestion fractionation factors, the influence of acid digestion
kinetics on 147 is a subject that warrants further
investiga-tion.
1 Introduction
“Clumped”-isotope paleothermometry is an approach to de-termining carbonate mineral formation temperatures (Ghosh et al., 2006; Schauble et al., 2006; Eiler, 2007); like the oxy-gen isotope thermometer before it, it is founded on thermo-dynamic predictions of the distribution of isotopes. Crucially, instead of relying on an isotopic exchange reaction between
different phases (e.g., CaCO3 and H2O), clumped isotope
thermometry relies on internal isotopic exchange between isotopes in a single phase (Schauble et al., 2006). This means that, in theory, all that is needed to determine mineral for-mation temperatures is the clumped isotope composition of the solid and not the water from which it grew (Schauble et al., 2006; Eiler, 2007). When considering carbonate min-erals, statistical thermodynamics predicts that heavy stable isotopes of carbon (13C) and oxygen (18O) will increasingly bond or “clump” in a mineral as temperature decreases and will conform to isotopic equilibrium constants for reactions such as
X12C18O16O2+X13C16O3←→gX12C16O3+X13C18O16O2, (R1)
where X refers to cations such as Ca2+, Mg2+, Sr2+, and
Ba2+. In practice, the determination of 13C–18O bonds in
carbonate minerals is accomplished by measurement of mass
47 CO2(predominantly13C18O16O) liberated by phosphoric
acid digestion (Ghosh et al., 2006).13C–18O bonding is
re-ported as a per mil enrichment from that which would be
expected in the liberated CO2 if the sample had a
stochas-tic distribution of C and O isotopes among all
isotopo-logues and is designated by the parameter 147. Following
the initial calibration of synthetic calcites and some coral taxa (Ghosh et al., 2006), several studies have focused on in-depth calibrations of biogenic carbonates that represent potential paleoclimate proxies. Proxy material calibrations thus far have included aragonitic scleractinian zooxanthel-late corals (Ghosh et al., 2006; Saenger et al., 2012; Tri-pati et al., 2015), aragonitic scleractinian non-zooxanthellate deep-sea corals (Ghosh et al., 2006; Thiagarajan et al., 2011), aragonitic otoliths (Ghosh et al., 2007), calcitic and arago-nitic foraminifera (Tripati et al., 2010), mollusks and bra-chiopods (Came et al., 2007, 2014; Eagle et al., 2013; Henkes et al., 2013) and land snails (Zaarur et al., 2011; Eagle et al., 2013), calcitic speleothems (Affek et al., 2008; Daëron et al., 2011), bioapatite (Eagle et al., 2010), and calcitic micro-bialites (Petryshyn et al., 2015).
It has been noted that calibration data on different biogenic carbonates generated in the same laboratory at Caltech and
using similar analytical methods produce a relationship
be-tween temperature and 147values that was similar to the
ini-tial inorganic calcite calibration (Ghosh et al., 2006; Eagle et al., 2013). However, there are differences in inorganic cal-cite calibrations produced in different laboratories (Ghosh et al., 2006; Dennis and Schrag et al., 2010; Zaarur et al., 2013; Tang et al., 2014; Wacker et al., 2013; Kluge et al., 2015) that are thought to either reflect methodological differences in clumped isotope measurements or differences in how syn-thetic carbonates were precipitated (Tripati et al., 2015). It is clear from studies in mollusks (Henkes et al., 2013; Ea-gle et al., 2013; Douglas et al., 2014; Petrizzo et al., 2014) and brachiopods (Henkes et al., 2013; Came et al., 2014) that calibrations of the same types of materials in different labora-tories can yield different relationships between temperature
and 147values.
More recent studies have discussed some possible sources of methodological effects on clumped isotope calibrations relating to data handling and mass spectrometric effects (Wacker et al., 2013; Petrizzo et al., 2014; Defliese et al., 2015). It is also possible that phosphoric acid digestion tech-nique and temperature may be playing a role (Wacker et al., 2013; Defliese et al., 2015), as is known to be the case
for conventional δ18O measurements (Swart et al., 1991).
Nonetheless, carbonate standards and a deep-sea sclerac-tinian coral were found to yield broadly comparable results in an inter-lab comparison study between four different lab-oratories (Dennis et al., 2011).
To date, there are relatively little published data attempt-ing to resolve whether different biogenic calibrations may originate from methodological differences between laborato-ries by simply measuring multiple types of biogenic carbon-ates interspersed with each other using the same methods. Therefore, it remains difficult at this time to distinguish be-tween methodological differences and genuine differences in clumped isotope compositions of different materials, for ex-ample biologically mediated fractionations or “vital effects”. The little work that has been done includes Porites corals that appear to exhibit a kinetic isotope effect that drives their 147
values significantly out of equilibrium (Ghosh et al., 2006; Saenger et al., 2012) and a temperate coral Oculina
arbus-culacultured at the same temperature and variable pH that
exhibits large kinetic effects (Tripati et al., 2015).
Here we explore 13C–18O bond abundances in deep-sea
coral species from the orders Scleractinia and Gorgonacea and precipitate aragonite and high-Mg calcite, respectively. As these corals were recovered from the same environment, analyzed by the same methods and mass spectrometer during the same analytical period, and subject to the same data pro-cessing, they represent an opportunity to explore the potential role of mineralogy and biology in governing clumped isotope signatures. We discuss results in the context of recent stud-ies including of acid digestion fractionation (Deflstud-iese et al., 2015) and theoretical models and experimental data that have been used to constrain differences in clumped isotope
com-J. Kimball et al.: Carbonate “clumped” isotope signatures 6489 position between different dissolved inorganic carbon (DIC)
species (Hill et al., 2014; Tripati et al., 2015), as it has been suggested that in cases where a carbonate mineral may in-herit an isotopic signature of DIC, then factors effecting DIC speciation such as pH, salinity, and temperature may also influence carbonate clumped isotope signatures (Hill et al., 2014; Tripati et al., 2015).
Deep-sea corals in paleoceanography
Deep-sea corals represent a potentially valuable archive of intermediate and deep-ocean temperatures and have been a target for models of stable isotope fractionation (Adkins et al., 2003; Gaetani et al., 2011). These archives could give valuable insight into the natural variability of regions of the ocean that play an active role in large-scale climate dynam-ics. With fossil deep-sea coral recorded for at least the last 225 000 years (Robinson et al., 2007; Thiagarajan et al., 2013), it is a proxy with the potential to extend our observa-tions of ocean physics and climate into the Pleistocene with decadal to centennial resolution. It has been established that deep-sea corals have significant skeletal vital effects (dise-quilibrium stable isotope fractionations) that compromise the
classic δ18O paleotemperature method (Emiliani et al., 1978;
McConnaughey, 1989a, 2003; Adkins et al., 2003; Smith et al., 2000; Rollion-Bard et al., 2003, 2010; Lutringer et al., 2005; Hill et al., 2011; Kimball et al., 2014). Attempts to circumvent these kinetic effects have focused on the “lines” method that recovers an average temperature over the life-time of a coral (Smith et al., 2000; Lutringer et al., 2005; Hill et al., 2011; Kimball et al., 2014) and a Rayleigh-based mul-tielement (e.g., Mg / Ca, Sr / Ca, Ba / Ca) paleotemperature method (Gaetani et al., 2011).
Despite deep-sea coral species showing significant
dise-quilibrium in δ13C and δ18O values, sometimes termed
vi-tal effects, initial calibration work using clumped isotopes in scleractinian corals (Thiagarajan et al., 2011) revealed a good agreement between aragonitic scleractinian deep-sea
coral 147 and the inorganic calcite calibration of Ghosh et
al. (2006). Therefore, at least some species that show signif-icant vital effects on δ13C and δ18O yield apparent
equilib-rium 147 values, an observation also made on foraminifera
and coccoliths (Tripati et al., 2010). Recently scleractinian
deep-sea coral 147 measurements have been used in
ap-plied paleoceanographic reconstructions (Thiagarajan et al., 2014).
2 Samples and methods
2.1 Samples
Thirteen live-collected specimens of deep-sea coral were ex-amined. One specimen, PV 703-7 was mostly dead with patches of living tissue. Specimens were collected by deep-sea submersible diving on Warwick Seamount, Gulf of
Figure 1. Sampling locations of three expeditions from which coral specimens were collected by deep-sea submersible diving. Lo-cations approximate Warwick Seamount, Gulf of Alaska (DSRV Alvin, 2004), Hawaiian and Northwest Hawaiian Islands (DSRV Pisces V, 2005 and 2007), and Line Islands (DSRV Pisces IV, 2006).
Alaska (DSRV Alvin, 2002); the Hawaiian Islands (DSRV Pisces V, 2007); and Line Islands (DSRV Pisces IV, 2005) (Fig. 1). The 13 corals belong to the Gorgonacea (gorgonian) and Scleractinia (scleractinian) orders. Gorgonian corals rep-resent the Isididae and Coralliidae families and scleractinian corals are Enallopsammia rostrata. Isididae samples were identified as Keratoisis, Isidella, or Acanella spp. (collec-tively referred to as bamboo corals) and the Coralliidae sam-ple as Corallium sp., most likely Corallium secundum (Ta-ble 1). Identification at the time of collection represents the current and best available taxonomic understanding.
Temperature data from Warwick Seamount is averaged from two Seabird conductivity–temperature–depth (CTD) casts taken at the dive location during the dive, while in situ temperature was measured on DSRV Pisces V and IV at the time of collection for Hawaiian and Line Island corals. Tem-perature ranges from Hawaiian Island coral were calculated from Hawaiian Ocean Time Series (HOTS) (data collected at Station ALOHA during the years 1990–2012. Although Station ALOHA is located about 328 miles east of our sam-ples, a comparison between the HOTS vertical temperature profile matches closely with CTD profiles taken from the sample locations. Additionally, Station ALOHA was origi-nally chosen as a monitoring station because it is believed to be representative of the North Pacific subtropical gyre and we take it to represent conditions experienced by Hawaiian corals. Temperature ranges from Warwick Seamount are
es-timated from CTD casts taken at approximately 48.02◦N,
−130.66◦W during 11 cruises during 1972–1998 at
dif-ferent times of the year. Temperature data was extracted from National Oceanic Data Center at 634 ± 5 m, 704 ± 5 m, 720 ± 5 m, and 872 ± 5 m to assess temperature variability at
Table 1. Thirteen scleractinian and gorgonian deep-sea corals were collected live by submersible diving, with depth and temperature mea-sured at the time of collection. Temperature ranges are mean with standard deviation and come from Hawaii Ocean Time Series (Karl and Lukas, 1996) and cruises extracted from the National Ocean Database (Boyer et al., 2013). NWHI: Northwest Hawaiian Islands.
ID Order Coral Location Latitude Longitude depth T T range
(m) (◦C) (◦C)
ALV 3806-1 Gorgonacea Isididae Warwick, AK 48◦040N 132◦480W 872 3.2 3.4 ± 0.1
ALV 3808-1 Gorgonacea Isididae Warwick, AK 48◦040N 132◦480W 758 3.5 3.5 ± 0.1
ALV 3808-3 Gorgonacea Isididae Warwick, AK 48◦040N 132◦480W 720 3.5 3.7 ± 0.1
ALV 3808-4 Gorgonacea Isididae Warwick, AK 48◦040N 132◦480W 704 3.6 3.7 ± 0.1
ALV 3808-5 Gorgonacea Isididae Warwick, AK 48◦040N 132◦480W 634 3.6 3.8 ± 0.2
PV 703-5 Gorgonacea Coralliidae Twin Banks, NWHI 23◦070N 163◦080W 942 4 4.2 ± 0.1
PV 592-1 Gorgonacea Isididae Big Island, HI 19◦480N 156◦070W 386 9.4 10.3 ± 0.2
PV 694-13 Gorgonacea Isididae East French Frigate 23◦540N 165◦230W 356 11.2 10.6 ± 0.6
Shoals, NWHI
PV 694-3 Gorgonacea Isididae East French Frigate 23◦540N 165◦230W 351 11.2 11.1 ± 0.7
Shoals, NWHI
PV 703-2 Scleractinia E.rostrata Twin Banks, NWHI 23◦070N 163◦080W 1108 3.7 3.7 ± 0.1
PIV 146-6 Scleractinia E.rostrata Kingman Reef 06◦26.00N 162◦27.50W 788 4 5.5 ± 0.2
PIV 148-2 Scleractinia E.rostrata Palmyra Atoll 05◦50.7840N 162◦06.7410W 588 6.5 6.9 ± 0.4
PV 703-7 Scleractinia E.rostrata Twin Banks, NWHI 23◦070N 163◦080W 534 6.7 6.7 ± 0.3
the depths the corals were collected at in the same oceanic re-gion. Similarly temperature ranges from the Line Islands are estimated from CTD casts extracted from National Oceanic
Data Center taken at approximately 6◦N, −160◦W during 9
to 27 cruises (depending on depth) during 1972-1998.
2.2 Sample preparation
Disks were cut from near the base for all coral skeletons, except PV 703-7, which was dead at the base. For this specimen, a disk was cut from the living branch for sam-pling. Disks were cleaned by the simple method of sonica-tion in nanopure water and air-drying at room temperature
(∼ 25◦C). All specimens lacked visual organic
contamina-tion of any kind, and following the findings of Thiagara-jan et al. (2011) and Eagle et al. (2013), who found clean-ing steps to be unnecessary in deep-sea corals and mollusks, respectively, no further cleaning was performed. For most corals, sample powders of ca. 50–70 mg were milled using a Merchantek micromill from the outer portions of disks which represent the most recently accreted part of the skele-ton (Fig. 2). In one sample, PV-703-5, a sample was milled from both the center and outer edge of the disk. In a few cases (PIV 148-2, PV 703-2 PIV 146-6, PV 3, PV 694-13) samples were first milled from the outer edge and later, to obtain additional sample, whole disks were ground into powder using a mortar and pestle. Although milling was pre-ferred, in some cases, disks were small enough that the entire disk was necessary to yield the required weight of sample for
replica 147measurements.
In order to explore intra-coral heterogeneity and sampling effects, specimen PIV 146-6 is sampled both along the outer edge by micromilling as well as by grinding and
homogeniz-Figure 2. (a) A bamboo coral from Warwick Seamount, ALV 3808-4. The bottommost internode is cut and the disk used for milling along the outer, most recently accreted portion. (b) A portion of a radial disk from PV 703-5 in which samples were milled from the center and outer portion.
ing an entire disk, while PV 703-5 was micromilled in the center and outer edge (Fig. 2). In this way, intra-specimen reproducibility and the effects of sampling were assessed.
2.3 Notation and reference frame
The parameter 147 is a measure of the enrichment in per
mil of13C18O16O in CO2relative to the predicted stochastic
abundance:
147=(R47/R∗47−1)−(R46/R46∗ −1)−(R45/R45∗−1)×1000,
where R47, R46, and R45are the measured abundance ratios
of masses 47/44, 46/44, and 45/44 in the sample and R47∗,
J. Kimball et al.: Carbonate “clumped” isotope signatures 6491 masses in the sample if it had a stochastic distribution of C
and O isotopes among CO2isotopologues.
Standard gases of different bulk compositions were
equi-librated at different temperatures (25 or 1000◦C) and
mea-sured each day. Values of 147 are reported in the
abso-lute reference frame (ARF) and calculated as described in another publication using equilibrated gases (Dennis et al., 2011). Published data are presented in the absolute reference frame with conversion of data from Thiagarajan et al. (2011) and Ghosh et al. (2006) to the ARF, as reported in Eagle et al. (2013).
2.4 Analytical measurement of 147
Isotopic measurements were conducted on a dual inlet Thermo Scientific MAT 253 mass spectrometer coupled to a custom-built semiautomated sample digestion and purifi-cation system located at the University of California, Los Angeles. The setup is modeled on that used at Caltech and Johns Hopkins, which are described in Passey et al. (2010) and Henkes et al. (2013). Samples were run during two separate time periods (winter: January 2013–March 2013; summer: May 2013–July 2013) and samples of scleractinian (aragonite) and gorgonian (high-Mg calcite) were run inter-changeably during both time periods. For each analysis (pre-viously referred to as extraction) 8–10 mg of material was used to yield sufficient gas to maintain a steady signal at ex-tended counting times. Also, recent results suggest that the digestion of samples that are significantly smaller might un-dergo secondary equilibration with water, resulting in
ele-vated 147values compared to > 7 mg size samples (Wacker
et al., 2013).
Mass spectrometric configuration was set to measure ion beams corresponding to m/z = 44, 45, 46 (amplified by 3 × 10⁸to 1 × 10¹¹resistors) and 47, 48, 49 (amplified by
1012resistors) with the ion bean m/z = 44 fixed at ∼ 16 V.
Each analysis contains eight measurements of seven cycles between sample and reference gas with 26 s of integration per cycle. The total integration time of 1456 s is sufficiently long that errors should be able to approach shot noise er-ror predictions (Thiagarajan et al., 2011; Huntington et al.,
2009). Internal precision of 147was ca. 0.005–0.012 ‰, 1σ
(based on eight measurements of seven cycles of sample and reference gas comparison within a single analysis, (Table 2, Supplement Table S1) and external precision was ca. 0.004– 0.008 ‰, 1σ (determined from repeat analyses of standards, Table 3). To increase external precision, samples were mea-sured three to seven times each, which resulted in standard
errors for 147 of 0.002–0.010 ‰ for the corals in this study
(Table 2).
The semiautomated sample digestion system allows for a sample to be introduced as either a carbonate powder or a gas. Carbonate powders are introduced via a Costech au-tosampler which drops samples in vacuo into a common
∼103% phosphoric acid (ρ ≈ 1.91 mg mL−1) bath held at
90◦C and allowed to react for 20 min. Evolved CO2 from
acid digestion is then passed through a cooled ethanol trap
(−78◦C) and collected in a liquid nitrogen trap (−200◦C).
CO2 is liberated by warming with the same ethanol trap
(−78◦C) and, with a helium carrier gas, passes through a
Porapak Q 120/80 mesh GC (gas chromatograph) column
at −20◦C and silver wool, which removes organic
contam-inants and scavenges sulfur compounds, respectively. After
GC passage, CO2is again collected in liquid nitrogen and
un-dergoes one final cryogenic purification step in vacuo before
introduction to the mass spectrometer. Gaseous CO2can also
be prepared on a vacuum line and introduced using quartz tubes. A tube cracker which leads into the second cooled
ethanol trap prior to the GC step allows CO2to pass through
the autoline in the same way as carbonate samples, minus the common acid bath.
In addition to carbonate powders, on most days, at least
one gaseous “equilibrated CO2” sample is analyzed for use in
defining the absolute reference frame for 147measurements.
Producing equilibrated CO2gases with varying bulk isotopic
(δ13C and δ18O) composition is accomplished by utilizing
a very depleted CO2(δ13C = −25 ‰, δ18O = 3.6 ‰ Vienna
Standard Mean Ocean Water (VSMOW)) and
equilibrat-ing Oztech CO2 (δ13C = −3.6 ‰ Vienna Pee Dee
Belem-nite (VPDB), δ18O = 23.6 ‰ VSMOW) with isotopically
“heavy” water (18O enriched and produced by boiling house
DI). These two isotopical end member gases are then
ei-ther heated at 1000◦C for 2 h to produce a nearly
stochas-tic distribution of isotopes among isotopologues or
equili-brated in a water bath held at 25◦C. Equilibrated CO2 is
then cryogenically purified on a vacuum line and captured into quartz tubes. This procedure produces four isotopically
unique gaseous CO2 samples which define the empirical
transfer function (ETF) used to covert 147values to the ARF
scale (Dennis et al., 2011). The carbonate standards Carrara marble, Carmel chalk, TV01, and 102-GC-AZ01 were run in concert with samples and were shown to have values that were indistinguishable from those determined in the Caltech lab (Table 3).
An acid fractionation factor of 0.092 ‰ was applied to all data and to theoretical predictions to normalize to previously
reported data at 25◦C (Henkes et al., 2013). In tables and
figures, we also report results calculated using a value of 0.082 ‰ (Passey et al., 2010; Defliese et al., 2015) as well as other acid digestion fractionation factors (e.g., Wacker et al., 2013).
3 Results
3.1 Scleractinian coral 147
When compared with previously reported deep-sea coral data the aragonitic scleractinian coral results from this study agree very closely with those measured in Thiagarajan et
Table 2. Coral specimens analyzed for δ13C, δ18O, and 147. 147is reported relative to the absolute reference frame (ARF). Standard error, 1σ , is reported with number of replicate measurements (n). Individual analyses are reported in Table S1. Values are calculated using a 25 to
90◦C AFF = 0.092 (denoted by 1; Henkes et al., 2013) and AFF = 0.082 (denoted by 2; Defliese et al., 2015, and Passey et al., 2010).
ID Order Mineral n δ13C δ18O 147
(‰ VPDB) (‰ VPDB) (‰ ARF; 90◦C results) (‰ ARF; adj. 25◦C1) (‰ ARF; adj. 25◦C2)
ALV 3806-1 Gorgonacea high-Mg calcite 8 −3.74 (±0.091) 0.76 (±0.109) 0.663 (±0.004) 0.744 (±0.004) 0.734 (±0.004)
ALV 3808-1 Gorgonacea high-Mg calcite 3 −3.15 (±0.024) 0.53 (±0.064) 0.650 (±0.004) 0.731 (±0.004) 0.721 (±0.004)
ALV 3808-3 Gorgonacea high-Mg calcite 2 −4.58 (±0.04) 0.08 (±0.025) 0.639 (±0.002) 0.720 (±0.002) 0.710 (±0.002)
ALV 3808-4 Gorgonacea high-Mg calcite 6 −3.15 (±0.208) 0.66 (±0.095) 0.649 (±0.01) 0.730 (±0.01) 0.720 (±0.01)
ALV 3808-5 Gorgonacea high-Mg calcite 3 −5.87 (±0.131) −0.21 (±0.043) 0.657 (±0.004) 0.738 (±0.004) 0.728 (±0.004)
PV 703- 5 Gorgonacea high-Mg calcite 6 −6.35(±0.543) −1.09 (±0.345) 0.662 (±0.007) 0.743 (±0.007) 0.733 (±0.007)
PV 592-1 Gorgonacea high-Mg calcite 2 −2.42 (±0.068) −0.18 (±0.029) 0.646 (±0.004) 0.727 (±0.004) 0.717 (±0.004)
PV 694-13 Gorgonacea high-Mg calcite 4 −0.71 (±0.019) 0.10 (±0.018) 0.641 (±0.004) 0.722 (±0.004) 0.712 (±0.004)
PV 694-3 Gorgonacea high-Mg calcite 5 −4.19 (±0.108) −0.05 (±0.154) 0.626 (±0.008) 0.707 (±0.008) 0.697 (±0.008)
PV 703-2 Scleractinia aragonite 8 −1.91 (±0.19) 2.11 (±0.338) 0.709 (±0.008) 0.790 (±0.008) 0.780 (±0.008)
PIV 146-6 Scleractinia aragonite 7 −2.90 (±0.166) 1.40 (±0.083) 0.710 (±0.006) 0.791 (±0.006) 0.781 (±0.006)
PIV 148-2 Scleractinia aragonite 7 −3.90 (±0.351) 0.70 (±0.044) 0.715 (±0.004) 0.796 (±0.004) 0.786 (±0.004)
PV 703-7 Scleractinia aragonite 3 −3.10 (±0.065) 0.40 (±0.038) 0.665 (±0.002) 0.746 (±0.002) 0.736 (±0.002)
al. (2011) and Ghosh et al. (2006) (Figs. 3 and 4). Mea-sured and predicted coral isotopic measurements are pre-sented in Table 4. Since specimen PV 703-7 was mostly a dead coral except in small sections when collected and there-fore could have had a more complicated life history, it was excluded from calibration analysis.For the purpose of cali-bration, we focus on data from live-collected specimens to compare with in situ temperature measurements to eliminate any uncertainty in growth temperatures or post-formation dissolution when considering proxy systematics. When the scleractinian corals are combined with the data from
Thi-agarajan et al. (2011), a similar 147-T relationship to that
originally reported is found. In a plot of 147 vs. 106/T2
the linear regression of the 11 corals from Thiagarajan et al. (2011) (slope: 0.0643 ± 0.008; intercept: −0.029 ± 0.103;
R2=0.934) is almost identical to that of the combined data
set of 14 scleractinian corals (slope: 0.0582 ± 0.008;
inter-cept: 0.0452 ± 0.103; R2=0.81). As noted in Thiagarajan
et al. (2011), this is closely similar to that of the Ghosh et al. (2006) calibration of inorganic calcite (slope: 0.0620; in-tercept: −0.0021).
The temperature sensitivity of the combined sclerac-tinian coral calibration (slope: 0.0582 ± 0.008; intercept:
0.0452 ± 0.103; R2=0.81) was examined. At high (17.4◦C)
and low (2.3◦C) temperatures, 95 % confidence intervals of
147 give ±0.0165 and ±0.0105 ‰, which correspond to
temperature uncertainties of ca. ±4–5 and ±3–4◦C,
respec-tively. At the average temperature of the data set (9.6◦C),
uncertainty can be as good as ±0.0075 ‰ or ±2◦C.
Uncer-tainty in 147 is converted to uncertainty in temperature in
accordance with Huntington et al. (2009).
3.2 Gorgonian coral 147
Gorgonian deep-sea corals precipitate skeletal carbonate in
the form of high-Mg calcite, with 5–10 mol % MgCO3(Noé
and Dullo, 2006; Kimball et al., 2014). Compared to
scle-12.0 12.5 13.0 13.5 0.70 0.75 0.80 0.85 106/T2(K); T in oC Scleractinian deep-sea corals
Gorgonian deep-sea corals (live-collected) Scleractinian deep-sea corals (live-collected)
Δ47
(‰)
This study
16 4
Thiagarajan et al. ( 2011)
Scleractinian deep-sea coral (not live-collected)
Figure 3. Scleractinian and gorgonian deep-sea coral compared to deep-sea corals reported in Thiagarajan et al. (2011) and average
147 values recalculated relative to ARF from Eagle et al. (2013).
Sample 703-7 is not included in the calibration and is not considered live-collected.
ractinian deep-sea coral and all other previously reported
biogenic carbonates, 147 is depleted in gorgonian deep-sea
corals. In a plot of 147 vs. 106/T2, the linear regression
through data derived from nine gorgonian deep-sea corals analyzed in this study gives a significantly shallower slope
(slope: 0.025 ± 0.01; intercept: 0.403 ± 0.129, R2=0.48)
and 147offset of ca. 0.04–0.07 ‰ in the temperature range
of 3.2–11.2◦C compared to scleractinian corals as well as
compared to the Ghosh et al. (2006) calibration. It is, how-ever, more similar to the inorganic calibration of Dennis and Schrag (2010) (Fig. 3). Temperature sensitivity of the
gor-J. Kimball et al.: Carbonate “clumped” isotope signatures Figure 4 6493 11.5 12.0 12.5 13.0 13.5 0.65 0.70 0.75 0.80 0.85 106/T2(K)
Eagle et al. (2013) biogenic compilation calibration Eagle et al. (2013) molluscan calibration
∆47
(
‰)
Ghosh et al. (2006) inorganic calibration
Gorgonian deep-sea corals Scleractinian deep-sea corals Zaruur et al. (2013) inorganic calibration
Dennis and Schrag (2010) inorganic calibration
Figure 4. Scleractinian corals from this study and Thiagara-jan et al. (2011) are combined (slope: 0.0582 ± 0.008; intercept:
0.0452 ± 0.103; R2=0.81) and, along with gorgonian deep-sea
corals, are compared to other reported calibration studies.
gonian coral calibration was not examined due to poorness of fit (R2=0.48).
3.3 Intra-specimen sampling
Intra-specimen measurements from sampling different por-tions of the skeleton gives insight into the 147heterogeneity
present in an individual coral. Specimen PIV 146-6 was sam-pled both along the outer edge by micromilling as well as by grinding and homogenizing an entire disk, while PV 703-5 was micromilled in the center and outer edge. In both corals, aliquots produced from a given sampling method are signifi-cantly different in bulk isotopes. PIV 146-6 has differing bulk isotopic compositions between the two aliquots of more than
1 ‰ in δ13C and 0.4 ‰ in δ18O. PV 703-5 has almost a 3 ‰
difference in δ13C and 0.5 ‰ in δ18O (Table 5). 1
47of the
aliquots are approximately 0.03 and 0.02 different from each other in PIV 6 and PV 703-5, respectively. For PIV 146-6, the average of all seven measurements is 0.791 ± 0.008 and for the two aliquots the averages are 0.779 ± 0.007 and 0.803 ± 0.01. For PV 703-5 the average of all six measure-ments is 0.744 ± 0.007, and the averages for the two aliquots are 0.734 ± 0.005 and 0.754 ± 0.010.
4 Discussion
4.1 Trends in deep-sea coral data
The scleractinian corals analyzed in this study are solely
Enallopsammiasp. In contrast, the deep-sea corals presented
in Ghosh et al. (2006) and Thiagarajan et al. (2011) are scle-ractinian Desmophyllum, Enallopsammia, and Caryophyllia sp. All scleractinian species precipitate a skeleton composed of aragonite, although growth habits vary between species.
Desmophyllum sp., also known as cup corals, grows in a
rosette shape, whereas Caryophyllia and Enallopsammia sp. have a dendritic growth habit. The E. rostrata specimens measured in Thiagarajan et al. (2011) allow comparison be-tween deep-sea corals of the same species measured in this study.
The scleractinian deep-sea coral data from this study have values that overlap with those reported by Thiagarajan et al. (2011). In contrast, the gorgonian corals show
signifi-cantly lower 147values compared to the scleractinian corals
for the same temperature range. An analysis of covariance (ANCOVA) between the scleractinian and gorgonian coral data gives a P value < 0.01, which indicates that the dif-ferences between the two groups are statistically signifi-cant. This 0.04–0.07 ‰ offset between scleractinian and gor-gonian corals is observed in non-acid-digestion-corrected
147 values. Possible explanations for this offset are
dis-cussed below.
4.2 Comparison with other published 147calibration
data sets
Since its inception, numerous theoretical, inorganic, and bio-genic calibrations have been put forward to calibrate the 147–T relationship in different carbonate materials. To date,
at least seven synthetic calibrations have been published (Ghosh et al., 2006; Dennis and Schrag, 2010; Zaarur et al., 2013; Tang et al., 2014; Defliese et al., 2015; Kluge et al., 2015; Tripati et al., 2015). Numerous biogenic carbonate ma-terials have been studied to assess their agreement with inor-ganic and theoretical studies (Ghosh et al., 2006; Thiagarajan et al., 2011; Saenger et al., 2012; Eagle et al., 2013; Henkes et al., 2013). The scleractinian corals in this study agree well with the inorganic calibrations of Ghosh et al. (2006), Zaarur et al. (2013), and Tripati et al. (2015), while the gorgonian corals show agreement with the Dennis and Schrag (2010), Tang et al. (2014), and Kluge et al. (2015) inorganic calibra-tions (e.g., Fig. 4).
4.3 Comparison with theoretical predictions
Theoretical modeling of 163for different carbonate minerals
(Schauble et al., 2006; Hill et al., 2014; Tripati et al., 2015) has been combined with theoretical acid digestion
fractiona-tions to give predicted 147values for a variety of carbonate
minerals. These predictions generally agree with measured inorganic and biogenic studies; however, they are more
de-pleted in 147 for a given temperature. Further, offsets due
to mineralogy, while predicted in these theoretical modeling studies, have not been resolved in measured samples. Com-pared to deep-sea coral 147, theoretical predictions are more
Table 3. Average standard values with standard error reported for the two periods of time when samples were measured compared to accepted
values. 147values are in ‰ relative to the absolute reference frame. Values are calculated using a 25 to 90◦C AFF = 0.092 (denoted by 1;
Henkes et al., 2013) and AFF = 0.082 (denoted by 2; Defliese et al., 2015 and Passey et al., 2010).
147UCLA 147UCLA Accepted 147(Caltech)
Standard n (‰ ARF; adj. 25◦C1) (‰ ARF; adj. 25◦C2) (‰ ARF; adj. 25◦C)
Carrara marblea 8 0.395 (±0.008) 0.385 (±0.008) 0.395 Carrara marbleb 15 0.390 (±0.005) 0.380 (±0.005) 0.395 Carmel chalka 7 0.688 (±0.004) 0.678 (±0.004) 0.697 Carmel chalkb 13 0.695 (±0.004) 0.685 (±0.004) 0.697 102-GC-AZ01a 5 0.729 (±0.004) 0.719 (±0.004) 0.713 102-GC-AZ01b 3 0.699 (±0.006) 0.689 (±0.006) 0.713 TV01/TV03b 7 0.720 (±0.007) 0.710 (±0.007) 0.713 aWinter.bSummer 2013.
Table 4. Coral specimens analyzed for δ13C, δ18O, and 147. Average 147for all replicate measurements is reported relative to the absolute
reference frame (ARF). δ47is reported relative to intra-laboratory working gas (WG).
ID δ18Ocoral δ18Owater δ18O predicted δ47(‰ WG)c 147 147predicted
(‰ VPDB) (‰ VPDB)a (‰ VPDB)b (‰ ARF; adj. 25◦C) (‰ ARF; adj. 25◦C)d
ALV 3806-1 0.78 (±0.123) −0.2 2.6 14.79 0.744 (±0.004) 0.833 ALV 3808-1 0.53 (±0.064) −0.2 2.53 15.12 0.731 (±0.004) 0.831 ALV 3808-3 0.08 (±0.025) −0.2 2.53 13.2 0.720 (±0.002) 0.831 ALV 3808-4 0.66 (±0.095) −0.2 2.51 15.24 0.730 (±0.01) 0.831 ALV 3808-5 −0.21 (±0.043) −0.2 2.51 11.66 0.738 (±0.004) 0.831 PV 703- 5 −1.70 (±0.165) −0.05 2.26 10.11 0.743 (±0.007) 0.828 PV 592-1 −0.18 (±0.029) 0.1 0.87 15.1 0.727 (±0.004) 0.797 PV 694-13 0.10 (±0.018) 0.1 0.45 16.97 0.722 (±0.004) 0.786 PV 694-3 −0.05 (±0.154) 0.1 0.45 17.03 0.707 (±0.008) 0.786 PV 703-2 2.00 (±0.318) −0.1 3.13 18 0.790 (±0.008) 0.830 PIV 146-6 1.40 (±0.083) −0.1 3.06 16.289 0.791 (±0.006) 0.828 PIV 148-2 0.70 (±0.044) 0.1 2.28 14.62 0.796 (±0.004) 0.813 PV 703-7 0.40 (±0.038) 0.1 1.6 14.94 0.746 (±0.002) 0.796 aδ18O
watervalues are from WOCE and HOTS.bδ18O predicted values are calculated using the equations reported in Kim and O’Neil (1997) for calcite and Kim et al. (2007) for aragonite.cδ
47is relative to intra-laboratory working gas with a known isotopic composition.d147predicted value is calculated from the inorganic calibration of Ghosh et al. (2006); similar values are predicted from other inorganic calibrations including Zaarur et al. (2013) and Tripati et al. (2015).
depleted for aragonite; however, the calcite prediction agrees well with the calcitic gorgonians from this study (Fig. 5). The offset of 0.03 ‰ between aragonite and calcite is at the lower end of what we observe. A recent theoretical modeling effort
(Hill et al., 2014) has produced similar predicted 147values
for aragonite and calcite although with more depleted (less agreement) values between predicted and observed aragonite
147and a smaller offset between aragonite and calcite.
4.4 Acid digestion fractionation factor uncertainties
It is possible that uncertainties in the acid digestion
fraction-ation factor for carbonates digested at 25 and 90◦C may
ac-count for some of the above offsets. Three values have been proposed for the acid digestion fractionation factor (AFF)
for reporting data at 90◦C and converting them to 25◦C
on the absolute reference frame. To explore the sensitivity
of results to the choice of acid digestion fractionation fac-tor, Figs. 6–9 show calculations using a range of acid di-gestion fractionation factors of isotope ratios and apparent deviations of measured isotopic ratios from isotopic equi-librium. Passey et al. (2010) calculate and use a value of 0.081 ‰, whereas Henkes et al. (2013) suggest a value of 0.092 ‰ ± 0.012 ‰, which is within error of the Passey et al. (2010) value. Defliese et al. (2015) propose a value of 0.082 ‰ ± 0.014 ‰, which is within error of both values,. In a recent study Wacker et al. (2013) suggest there may be mineral-specific AFF, which is also predicted in the theoret-ical study by Guo et al. (2009). Application of the Wacker
et al. (2013) 125−90correction to the aragonite and calcite
147data can explain 0.009 ‰ of the 0.03–0.07 ‰ offset
ob-served in our aragonite and calcite data. Based on theoretical predictions for dolomite (Guo et al., 2009), a further offset might be expected due to Mg incorporation in calcite. Still,
J. Kimball et al.: Carbonate “clumped” isotope signatures 6495
Table 5. Two coral specimens were analyzed using different portions of their skeletons. PIV 146-6 was sampled by micromilling the outer portion of a disk (outer) as well as grinding an entire disk (whole). PV 703-3 was micromilled in both cases but was milled in both the center and outer portion of a disk. All data and averages are reported as well as standard error, 1σ .
ID n δ13C δ18O 147predicted (‰ VPDB) (‰ VPDB) (‰ ARF; adj. 25◦C)d PIV 146-6 (outer) 4 −2.67 (±0.161) 1.33 (±0.02) 0.796 (±0.007) PIV 146-6 (whole) 3 −3.37 (±0.086) 1.77 (±0.042) 0.820 (±0.010) PIV 146-6 (average) 7 −2.90 (±0.166) 1.40 (±0.083) 0.808 (±0.008) PV 703-5 (center) 3 −7.76 (±0.038) −1.70 (±0.165) 0.760 (±0.010) PV 703-5 (outer) 3 −4.95 (±0.116) −0.47 (±0.025) 0.740 (±0.005) PV 703-5 (average) 6 −6.35(±0.543) −1.09 (±0.345) 0.750 (±0.007) 11.5 12.0 12.5 13.0 13.5 0.65 0.70 0.75 0.80 0.85 106/T2(K)
Theoretical aragonite (Schauble et al., 2006) + 0.280 Theoretical calcite (Schauble et al., 2006) + 0.278 Theoretical dolomite (Schauble et al., 2006) + 0.263
Δ47
(
‰)
Gorgonian deep-sea corals Scleractinian deep-sea corals
Figure 5. Scleractinian and gorgonian corals from this study and Thiagarajan et al. (2011) are compared to the theoretical predictions
for 163for aragonite, calcite, and dolomite. Acid fractionation
val-ues were added to convert to 147.
experimental (Wacker et al., 2013; Defliese et al., 2015) and theoretical (Guo et al., 2009) studies suggest that acid diges-tion differences due to mineralogy may not be large enough to explain the ca. 0.04–0.07 ‰ offset that we observe.
Deep-sea coral 147 was corrected using 125−90 AFF
of 0.082 ‰ (Defliese et al., 2015) – identical to the value from Passey et al., 2010 – 0.092 ‰ (Henkes et al., 2013) and 0.066 ‰ (Wacker et al., 2013, aragonite), and 0.075 ‰ (Wacker et al., 2013, calcite). Figure 6 shows the result of the AFF sensitivity analysis and indicates that although the
ab-solute values of the 147change with the application of AFF
values, the offset between aragonite and calcite is unaffected except in the case of the application of mineral-specific AFF from Wacker et al. (2013). The application of Wacker et al. (2013) mineral-specific AFF values results in a decrease
11.5 12.0 12.5 13.0 13.5 0.70 0.75 0.80 0.85 106/T2(K) Wacker et al., 2013 (gorgonian) AFF 0.075
Δ47
(
‰)
Wacker et al., 2013 (scleractinian) AFF 0.061 Henkes et al., 2013 (scleractinian) AFF 0.092
Passey et al., 2010 (scleractinian) AFF 0.081 (similar to Defliese et al., 2015)
Henkes et al., 2013 (gorgonian) AFF 0.092
Passey et al. , 2010 (gorgonian) AFF 0.081 (similar to Defliese et al., 2015)
Figure 6. Sensitivity analysis of varying acid digestion fractionation
factor (125−90)on results.
in the offset between the aragonite and calcite deep-sea coral
147of only 0.009 ‰, therefore not altering our conclusions.
However, we acknowledge that the kinetics of acid
diges-tion and the effects on clumped isotope signatures on 147
values is relatively poorly constrained. It is possible there are variable acid digestion fractionation factors that are in-fluencing these observations, possibly due to cation substi-tution into carbonates (Guo et al., 2009), mineral bulk iso-tope composition (Guo et al., 2009), the presence of organic matter, as well as other factors. Until systematic studies of acid digestion are undertaken to investigate each of these fac-tors, the contribution of acid digestion fractionation to the ob-served differences between aragonitic scleractinian and high-Mg calcitic gorgonian corals cannot be accurately quantified.
4.5 Analytical procedure, data comparison
Since its inception, the analytical measurement of 147 has
-6 -4 -2 0 2 4 -0.10 -0.05 0.00 0.05 0.10 δ18O measured - δ18O expected (‰) Δ47 Ghosh residual (gorgonian corals) Δ47 Ghosh residual (scleractinian corals)
Δ47 measured - Δ47 predicted (‰ )
Δ47 Ghosh residual (scleractinian corals) Δ47 Zaruur residual (scleractinian corals)
Δ47 Dennis residual (scleractinian corals) Δ47 Dennis residual (scleractinian corals)
Figure 7. 147residuals are calculated from average measured 147
values for each coral relative to the inorganic calibrations of Ghosh et al. (2006), Zaarur et al. (2013), and Dennis and Schrag (2010).
δ18O residuals are calculated from average measured δ18O values
relative to the calibrations of Kim and O’Neil (1997) and Kim et al. (2007) for calcite and aragonite, respectively.
spectrometric analysis (e.g., development of automated sam-ple digestions and purification systems, abbreviated to auto-line, and higher counting times) and standardization of re-porting procedures (Huntington et al., 2009; Dennis et al., 2011). Because the methods involved in producing and
re-porting 147have changed over time, the comparison of data
between laboratories and even within laboratories can be an issue. For relevant comparisons between previously reported data and this study’s data, we refer to the recalculations of
147performed in Eagle et al. (2013) using standard values
to project onto the absolute reference frame. Still, we cannot exclude the possibility that analytical artifacts remain. For instance, Zaarur et al. (2013) noted that the shorter count-ing times and fewer replications of the trailblazcount-ing work of Ghosh et al. (2006) may contribute to any discrepancies between data sets. We assess interlaboratory comparability from standards, which indicate accuracy and precision com-parable to what has been reported for other laboratories (Ta-ble 2; Dennis et al., 2011). Furthermore, we note that good agreement between the aragonitic scleractinian corals of this study and that of Thiagarajan et al. (2011) reinforces the comparability of our data to the wider body of measurements reported from other laboratories.
Interlaboratory comparability should not be a critical is-sue for the interpretation of data presented herein since the
offset between aragonitic and calcitic corals was observed in data generated within our lab, while running samples inter-changeably using the same analytical procedure. Standards were also run concurrently during these time periods (Ta-ble 3) and found to be in good agreement with accepted val-ues. We therefore conclude it is unlikely that the offset is due to internal analytical variability.
4.6 Mixing and intra-specimen 147heterogeneity
It has been shown that both scleractinian and gorgonian deep-sea corals exhibit significant disequilibrium in δ13C and δ18O of several per mil within an individual coral (eg. Smith et al., 2000; Adkins et al., 2003; Rollion-Bard et al., 2003, 2010; Lutringer et al., 2005; Kimball et al., 2014). Because of the
subtle saddle-shaped curvature in 147 relative to δ13C and
δ18O (Eiler and Schauble, 2004; Thiagarajan et al., 2011;
Defliese and Lohmann, 2015), 147 is sensitive to the
mix-ing of end member δ13C and δ18O values and will result
in non-conservative mixing (Fig. 10). Deep-sea corals, with their several per mil range in δ13C and δ18O values will be particularly susceptible to this effect. In fact, both banding and spatial variability in δ13C and δ18O values within deep-sea coral skeletons vary on the scale of ten to hundreds of microns (Smith et al., 2000; Adkins et al., 2003; Rollion-Bard et al., 2003, 2010; Lutringer et al., 2005; Kimball et al., 2014). Any small-scale spatial variability makes the pos-sibility of sampling within a skeletal band or an area with
homogenous δ13C and δ18O values for 147 measurements
unfeasible, and therefore there is the potential for mixing
ef-fects in 147which we address here.
Both Thiagarajan et al. (2011) and Henkes et al. (2013) have addressed mixing in biogenic carbonates by
calculat-ing the 147 effect from mixing samples of differing bulk
isotope composition. The end members from the Thiagara-jan et al. (2011) calculations are similar to the most
ex-treme values that we observe (δ13C = 2 ‰, δ18O = 5 ‰ and
δ13C = −10 ‰, δ18O = −2 ‰). Using these end member
values, Thiagarajan et al. (2011) calculated a positive 147
increase as large as 0.02 ‰ for the resulting mixture if 50 % of each end member is used. They note that while this mix-ing effect is not consistent with their data, mixmix-ing and then re-equilibration could potentially result in the trend seen in their data. Since sampling an isotopically homogenous area of a deep-sea coral is unfeasible (especially given the sam-ple size requirements for clumped isotopes), we estimate the maximum artifacts in our data arising from mixing. The es-timate for mixing artifacts from Thiagarajan et al. (2011) is based on observed variability in stable isotope values in scle-ractinian deep-sea coral, and represents an extreme example for this study, as they use δ13C and δ18O values of end mem-bers that differ by 12 and 7 ‰, respectively. Such differences in scleractinian coral represent systematic isotopic depletions in centers of calcification compared to fibers (Adkins et al., 2003), as well as variability associated with density bands;
J. Kimball et al.: Carbonate “clumped” isotope signatures 6497 -6 -4 -2 0 2 4 -0.10 -0.05 0.00 0.05 0.10 δ18O measured - δ18O expected (‰) Δ47 Eagle biogenic compilation residual (gorgonian corals) Δ47 Eagle biogenic compilation residual (scleractinian corals)
Δ47 measured - Δ47 predicted (‰
) Δ47 Eagle mollusk residual (gorgonian corals)
Δ47 Eagle mollusk residual (scleractinian corals)
Figure 8. 147residuals are calculated from average measured 147
values for each coral relative to the biogenic calibrations of Eagle
et al. (2013). δ18O residuals are calculated from average measured
δ18O values relative to the calibrations of Kim and O’Neil (1997)
and Kim et al. (2007) for calcite and aragonite, respectively.
-6 -4 -2 0 2 4 -0.10 -0.05 0.00 0.05 0.10 δ18O measured - δ18O expected (‰) Δ47 theoretical calcite residual (gorgonian corals) Δ47 theoretical aragonite residual (scleractinian corals)
Δ47 measured - Δ47 predicted (‰ )
Δ47 theoretical dolomite residual (gorgonian corals)
Figure 9. 147 residuals are calculated from average measured
147 values for each coral relative to the theoretical calibration of
Schauble et al. (2006) paired with theoretical acid digestion
frac-tionations from Guo et al. (2009). δ18O residuals are calculated
from average measured δ18O values relative to the calibrations of
Kim and O’Neil (1997) and Kim et al. (2007) for calcite and arago-nite, respectively.
no centers of calcification have been reported in gorgonian corals. The calculations from Thiagarajan et al. (2011) repre-sent an estimate of the maximum artifact to arise from mix-ing for either taxon given the range of carbon and oxygen isotope values observed in scleractinian and gorgonian deep-sea coral. We also observed little variability in δ13C and δ18O of different preparations of the same coral, with standard de-viations of < 1 ‰.
As a further investigation into intra-specimen heterogene-ity, effects on 147portions of two coral samples that differed
in bulk isotopic composition were analyzed. In two corals –
PIV 146-6 (scleractinian) and PV 703-5 (gorgonian) – δ13C,
δ18O, and 147were measured from intra-specimen aliquots
of carbonate produced from sampling portions of the skele-ton which differed significantly in their bulk isotopic
com-position (Table 5). Although 147of the aliquots are
approxi-mately 0.02 ‰ different from each other in both corals, this is similar to that reported in other studies between a few repli-cates (Huntington et al., 2009; Thiagarajan et al., 2011).
Ad-ditionally, no consistent trend is observed between δ18O and
147; as for coral PIV 146-6, the aliquot with the more
pos-itive δ18O also has the higher 147, but the opposite is
ob-served for coral PV 703-5. We therefore interpret the
dif-ference in 147 values between the aliquots as noise in the
measurements, which further reinforces the need to run many replicates.
4.7 Diffusion
Both Thiagarajan et al. (2011) and Saenger et al. (2012)
have suggested the diffusion of CO2 across the
calicoblas-tic membrane in corals as a possible mechanism for the
frac-tionation of 147. A generalized schematic of a scleractinian
coral-calcifying region is shown in Fig. 11. Thiagarajan et
al. (2011) calculated 0.7 and 1.6 ‰ decreases in δ18O and
δ13C, respectively, and a 0.036 ‰ increase in 147 for
liq-uid phase diffusion of CO2(Fig. 10). For this 147
fraction-ation to be heritable by the mineral, however, the mineral must preserve the isotopic state of ordering of the DIC rather than obtain internal equilibrium within the mineral carbon-ate itself. Additionally carboncarbon-ate mineral growth would have to occur before isotope clumping could reach equilibrium. Furthermore, this fractionation only applies to DIC produced
from diffused CO2and therefore the ratio of DIC from
dif-fused DIC to DIC derived from seawater “leaking” directly to the calcifying environment would also have to be known. Both Thiagarajan et al. (2011) and Saenger et al. (2012)
found fractionation associated with CO2diffusion across the
calicoblastic layer or, additionally proposed by Saenger et al. (2012), across a boundary layer developed between the growing mineral and calcifying fluid to be an unlikely expla-nation of the trends observed in their data. Additionally, gor-gonian corals are not known to have calicoblastic cells (Noé and Dullo, 2006), so this is relevant to scleractinian corals or
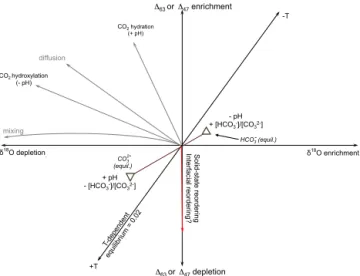
CO2 hydroxylation (- pH) CO2 hydration (+ pH) δ18O depletion . +T δ18O enrichment -T diffusion mixing Δ63 or Δ47 depletion Δ63 or Δ47 enrichment - pH + [HCO3-]/[CO32-] HCO3- (equil.) CO3 (equil.) 2- + pH - [HCO3-]/[CO32-] So lid -st ate re ord eri ng In te rf aci al re ord eri ng ?
Figure 10. Schematic illustrating general trajectories for different
processes on stable isotope signatures (163 or 147 values and
δ18O), relative to an arbitrary point. Equilibrium temperature
de-pendence is shown (Ghosh et al., 2006). Note that mixing of DIC
from different sources results in curved trajectories (in δ18O space,
mixing is linear, whereas in 147space can be nonlinear) (Eiler and
Schauble, 2004; Thiagarajan et al., 2011; Defliese and Lohmann, 2015). Diffusion results in enrichment of clumped species and
de-pletion in δ18O (Thiagarajan et al., 2011). CO2 hydration
reac-tions are strongly temperature pH-dependent and also result in
en-richment of clumped species and depletion in δ18O (Affek, 2013;
Tang et al., 2014; Tripati et al., 2015). At any given temperature, equilibrium DIC species have differing clumped and oxygen iso-tope signatures, potentially also giving rise to pH effect (Hill et al., 2014; Tripati et al., 2015). Solid-state diffusion processes (Passey and Henkes, 2012; Henkes et al., 2014), including hypothesized re-ordering in the interfacial region (Tripati et al., 2015) only influence clumped isotope signatures and not bulk isotopic signatures (e.g.,
δ18O).
if there is a similar functional cell playing a role in this for gorgonian corals.
It is possible the observed pattern could be explained if scleractinian deep-sea corals contain a larger fraction of
dif-fused CO2 compared to gorgonian coral if this CO2 then
underwent relatively little isotopic equilibration in the calci-fying fluid (Fig. 10). In cross plots of δ18O and 147
resid-uals, scleractinian corals do exhibit elevated 147 and
de-pleted δ18O values, relative to Zaarur et al. (2013), Dennis
and Schrag (2010), and theoretical aragonite (Schauble et al., 2006; Guo et al., 2009) in accordance with calculated dif-fusion effects. However, since scleractinian deep-sea corals generally conform to the majority of reported biogenic and synthetic calibrations, this would have to be a widespread ef-fect occurring in other materials reported as well.
4.8 Mineralogy and 147
Despite Epstein et al. (1953) originally finding that the nacre-ous layer (aragonite) and prismatic layer (calcite) of
mol-Low pH
High pH Ca2+
2H+
HCO3- CO32-
High [CO2](aq)
Lipid bilayer
Ca2+
CO32- + 2H+ ⇔ HCO3-+ H+ ⇔ H2O + CO2(aq)
Low [CO2](aq) Kinetic model CaATPase CO32- + 2H+ ⇔ HCO3-+ H+ ⇔ H2CO3 Ca2+ pH/entrapment/interfacial models CO32- + H+ ⇔ HCO3-⇔ OH- + CO2(aq) CaOH+ Cell wall Extracellular calcifying fluid Biogenic CaCO3 with organic macromolecules Seawater Interfacial region Slow
Seawater DIC leak
Ca32+ CO32- Ca32+ CO32- Ca32+ CO32- Ca32+ CO32- Ca32+ CO32- Ca32+ CO32- Ca32+ CO32- Ca32+ CO32- Ca32+ CO32- Ca32+ CO32- Ca32+ CO3CO2- Ca32+ CO32- Ca32+ CO32- Ca32+ 32- Ca32+ CO32- Ca32+ CO32- Ca32+ CO32- Ca32+ Ca32+ CO32- Ca32+ CO32- Ca32+ CO32- Ca32+ CO32- Ca32+ CO32- Ca32+ KCO32 + K2+ Ca
Figure 11. Schematic of the scleractinian coral-calcifying region (modified from McConnaughey, 1989a; Adkins et al., 2003) illus-trating processes that are hypothesized to result in stable isotope signatures observed in corals. Calcium pumping across the cell wall establishes a pH gradient between seawater and the extracellular calcifying fluid. Within the calcifying fluid, carbon can be sourced
from CO2that is diffusively transported across the cell wall and/or
through seawater leakage. The hydration and/or hydroxylation of
CO2are slow reactions, particularly at low temperature and at high
pH, driving disequilibrium in δ18O and in clumped isotope
signa-tures. The enzyme carbonic anhydrase will catalyze this reaction if
present and sufficiently active. At a given temperature, both HCO−3
and CO2−3 ions have distinct clumped isotope and δ18O signatures,
and therefore changes in extracellular calcifying fluid pH may also affect the isotopic composition of minerals, as explored through var-ious models including the pH, surface entrapment, and interfacial models mentioned in the text. Surface kinetic and interfacial pro-cesses and properties (e.g., surface speciation, attachment or detach-ment rates for isotopologues, the occurrence of defects, the nature of protein and saccharide macromolecules) also affect crystal growth and chemistry.
lusks showed no oxygen isotopic offset, it has since been
recognized that aragonite is enriched in18O and 13C
rela-tive to calcite both in theory and experiment (Tarutani et al., 1969; Kim and O’Neil, 1997; Kim et al., 2007; Mavroma-tis, 2013). An analogous mineralogical offset is predicted for
147 (with aragonite predicted to have a greater abundance
of13C–18O bonds than calcite that formed at the same
tem-perature) (Schauble et al., 2006; Guo et al., 2009; Hill et al., 2014; Tripati et al., 2015).
The corals in this study differ in mineralogy, with scler-actinian corals precipitating a fully aragonitic skeleton and gorgonian corals secreting carbonate in the form of high-Mg calcite. To date, a combination of aragonitic and calcitic bio-genic materials have been analyzed. Calcitic specimens have been represented by certain species of mollusks (Eagle et al., 2013; Henkes et al., 2013), brachiopods (Came et al., 2007; Henkes et al., 2013), and foraminifera (Tripati et al., 2010).
J. Kimball et al.: Carbonate “clumped” isotope signatures 6499 Aragonitic specimens have included deep-sea (Thiagarajan
et al., 2011) and shallow (Ghosh et al., 2006; Saenger et al., 2012) scleractinian corals, mollusks (Eagle et al., 2013; Henkes et al., 2013), and land snails (Zaarur et al., 2011), all of which have not revealed statistically significant min-eralogical offsets from the synthetic calibrations of calcite (Ghosh et al., 2006; Dennis et al., 2010; Zaarur et al., 2013). More careful study, however, of the X-ray diffraction (XRD) data of Ghosh et al. (2006) has revealed that aragonite was also present in their precipitates (Zaarur et al., 2013).
Despite not observing this offset between calcite and
aragonite 147 in synthetic or biogenic carbonates, it has
been predicted in theoretical studies. By combining a
pre-vious theoretical model of 13C–18O clumping in
carbon-ate minerals (Schauble et al., 2006) with their theoretical model of kinetic isotope effects associated with phospho-ric acid digestion, Guo et al. (2009) proposed predicted
147–T relationships for a number of carbonate minerals.
For the temperature range 0–30◦C, 147, aragonite-calcite≈0.02
and 147, aragonite-dolomite ≈0.04 ‰, with the direction of
fractionation in agreement with the offset that we observe (Fig. 5). A similar pattern was reported by Hill et al. (2014) and Tripati et al. (2015). If these models of mineral-specific
147–T relationships are correct, then this could potentially
explain a substantial portion of the offset we observe be-tween the aragonite and high-Mg calcite corals in this study. We discuss possible reasons for observed mineralogical ef-fects in deep-sea corals and not in other types of carbonates in more detail below.
4.9 Calcification in scleractinian deep-sea corals
Nonequilibrium partitioning of oxygen and carbon isotopes has been observed in numerous calcifying organisms and in-organic precipitation experiments and linked to calcification processes (e.g., McConnaughey, 1989a; Spero et al., 1997; Zeebe, 1999; Adkins et al., 2003: Watson, 2004; DePaolo, 2011; Gabitov et al., 2012; Watkins et al., 2014). Clumped isotopes represent another tool that can be used to probe mechanisms for disequilibrium isotopic signals in biological carbonates and to determine when equilibrium precipitation has occurred, through the coupling of theoretical calculations and inorganic precipitation experiments with culturing stud-ies (Thiagarajan et al., 2011; Tripati et al., 2015). Figure 10 shows a framework for how multiple paired stable isotope measurements can be used to trace the origin of disequilib-rium effects.
In scleractinian corals, precipitation of carbonate is be-lieved to occur in a space between the calicoblastic layer and the hard skeleton (Fig. 11). It is likely that calcifying fluid chemistry (pH, salinity) as well as growth rate and DIC equi-librium can all be potential sources of nonequiequi-librium signals preserved in the solid. The chemical composition and DIC sources from which the carbonate mineral forms have been a
main focus for understanding nonequilibrium δ13C and δ18O
values observed in corals. Biomineralization in shallow sym-biotic scleractinian corals has been well-studied over the past few decades (see Cohen and McConnaughey, 2003, for a re-view). Early studies of shallow symbiotic scleractinian corals
revealed time-independent δ18O and δ13C offsets from
the-oretical carbonate–water fractionation curves. This was ad-dressed through species-specific calibration studies, which allowed offsets to be corrected for, revealing the underlying environmental signals (Weber and Woodhead, 1972; Dun-bar and Wellington, 1981). In contrast, linear trends
be-tween δ18O and δ13C with depletions of several per mil are
observed in an individual deep-sea coral. Living in near-constant temperature, salinity, and pH environments, these large disequilibrium signals are attributed to their biomin-eralization mechanism (i.e., vital effects). Different
mecha-nistic models aimed at explaining nonequilibrium δ13C and
δ18O values seen in deep-sea corals have been proposed to
account for these so-called vital effects.
The first of these models, proposed by
Mc-Connaughey (1989a), calls on a kinetic fractionation during the hydration and hydroxylation steps of DIC specia-tion in which precipitaspecia-tion outpaces the ability of the system to reach isotopic equilibrium (“Kinetic model” in Fig. 11). The range of δ13C and δ18O values is therefore a reflection of a spectrum of varying amounts of equilibrium being attained amongst DIC species. The master variable in this case being time, McConnaughey (1989b), using calcification rates, calculated that calcification could outpace the time it took for isotopic equilibrium to be reached. Henkes et al. (2013) further noted that at lower temperatures, days to weeks are required for oxygen isotopic equilibrium to be reached in DIC.
The second model proposed by Adkins et al. (2003) ex-tensively examines potential sources of DIC to the extracel-lular calcifying fluid and introduces the concept of a vari-able pH environment as the master controller on skeletal
δ13C and δ18O (“pH model” in Fig. 11). For oxygen
iso-tope processes, they draw on work characterizing the
oxy-gen isotopic fractionation between DIC species (i.e., CO2,
H2CO3,, HCO−3, CO 2−
3 ) (McCrea, 1950; Usdowski et al.,
1991; Zeebe and Wolf-Gladrow, 2001; Beck et al., 2005; Zeebe, 2007; Rollion-Bard et al., 2011). Their model sug-gests that the mineral preserves the oxygen isotopic ratio of
HCO−3 /CO2−3 . Because each DIC species has a unique
oxy-gen fractionation relative to water, the oxyoxy-gen isotope
frac-tionation between the sum of DIC (DICsum)species and
wa-ter will vary depending on the proportion of the DIC species. For seawater, at high pH (pH > 9), DIC will be dominated by CO2−3 , which has the lowest fractionation factor and will therefore result in a more depleted δ18O value of the DICsum
from which the mineral precipitates. At lower (pH 6–9) fluid pH, as the HCO−3 /CO2−3 ratio of the fluid rises, so does the
precipitated mineral’s δ18O value. δ13C is not expected to