A 250 GHz Photonic Band Gap Gyrotron
Amplifier
by
Emilio A. Nanni
M.S. (EECS), Massachusetts Institute of Technology (2010)
B.S. (EE), University of Missouri
-
Rolla (2007)
B.S.
(Physics), University of Missouri
-
Rolla (2007)
Submitted to the
Department of Electrical Engineering and Computer Science
in partial fulfillment of the requirements for the degree of
Doctor of Philosophy
at the
MASSACHUSETTS INSTITUTE OF TECHNOLOGY
June 2013
@
2013 Massachusetts Institute of Technology. All rights reserved.
A u th o r ...
...
.
...
Department of Electrical Engineering and Computer Science
March 26, 2013
C ertified by ...
...
.
Richard J. Temkin
Senior Research Scientist, Department of Physics
Thesis Supervisor
Accepted by
...
..
..
.Professor Leslie A.Zaodziejski
Chairman, Committee on Graduate Students
Department of Electrical Engineering and Computer Science
A 250 GHz Photonic Band Gap Gyrotron Amplifier
by
Emilio A. Nanri
Submitted to the Department of Electrical Engineering and Computer Science on March 26, 2013, in partial fulfillment of the
requirements for the degree of Doctor of Philosophy
Abstract
This thesis reports the theoretical and experimental investigation of a novel gyrotron traveling-wave-tube (TWT) amplifier at 250 GHz. The gyrotron amplifier designed and tested in this thesis has achieved a peak small signal gain of 38 dB at 247.7 GHz, with a 32 kV, 0.35 A electron beam and a 8.9 T magnetic field. The instantaneous -3 dB bandwidth of the amplifier at peak gain is 0.4 GHz. A peak output power of 45 W has been measured. The output power is not saturated but is limited by the 7.5 mW of available input power. The amplifier can be tuned for operation from 245-256 GHz. With a gain of 24 dB and centered at 253.25 GHz the widest instantaneous -3 dB bandwidth of 4.5 GHz was observed for a 19 kV, 0.305 A electron beam. To achieve stable operation at these high frequencies, the amplifier uses a novel photonic band gap (PBG) interaction circuit. The PBG interaction circuit confines the TE0 3
-like mode which couples strongly to the electron beam. The PBG circuit provides stability from oscillations by supporting the propagation of TE modes in a narrow range of frequencies, allowing for the confinement of the operating TE0 3-like mode
while rejecting the excitation of oscillations at lower frequencies. Experimental re-sults taken over a wide range of parameters, 15-30 kV and 0.25-0.5 A, show good agreement with a theoretical model. The theoretical model incorporates cold test measurements for the transmission line, input coupler, PBG waveguide and mode converter. This experiment achieved the highest frequency of operation (250 GHz) for a gyrotron amplifier. At present, there are no other amplifiers in this frequency range that are capable of producing either high gain or high-output power. With 38 dB of gain and 45 W this is also the highest gain observed above 94 GHz and the highest output power achieved above 140 GHz by any conventional-voltage vacuum electron device based amplifier. The output power, output beam pattern, instan-taneous bandwidth, spectral purity and shot-to-shot stability of the amplified pulse meet the basic requirements for the implementation of this device on a pulsed dy-namic nuclear polarization (DNP) nuclear magnetic resonance (NMR) spectrometer. Thesis Supervisor: Richard J. Temkin
Acknowledgments
If I learned one thing in graduate school its that research is a process which benefits tremendously from the efforts, contributions and thoughts of the many collaborators involved. First in this regard is my adviser, Richard Temkin, to whom I owe a huge debt of gratitude. I would like to thank Michael Shapiro for answering every question I asked and Ivan Mastovsky, whose help in the lab was of utmost importance.
My fellow graduate students made my time here so enjoyable and interesting. I thank Brian Munroe for breaks at the gym; David Tax for coffee, granola bars and the Bruins; Sasha Soane for enriching all of our lives; Jason Hummelt for reminding me to take a deep breath and enjoy life; and Elizabeth Kowalski for being an awesome and patient office mate. I thank Samantha Lewis, the most exceptional UROP, for her help in the lab. I also thank my Waves and Beams co-workers and friends Colin Joye, Antonio Torrezan, Roark Marsh, JieXi Zhang, Sam Schaub, Sergey Arsenyev, Xueying Liu, Sudheer Jawla, Alan Cook, Hae Jin Kim and Paul Woskov for many chats and lots of help.
A special thank you to Sam Schaub, Sasha Soane and Elizabeth Kowalski for their comments and edits on my thesis.
I can't forget my friends from the FBML: Prof. Robert Griffin, Alexander Barnes, Vladimir Michaelis and the other graduate students and postdocs. Keep up the good work. For always being ready and willing to lend a hand, I thank Ron DeRocher, Ajay Thakkar, Michael Mullins and Jeff Bryant.
Finally and most importantly, I need to thank my loving family for all their support. My mother and father who gave me the best childhood, filled with so many unique experiences and opportunities. My sister who is the most caring person I know and my brother for reminding me I'm lucky because I get to do something I love. My wonderful wife Sarah, you were there every step of the way. I can't imagine going through this experience without you. I am so blessed to have met you.
Contents
1 Introduction 19
1.1 M otivation . . . . 19
1.2 Gyrotron Oscillators and Amplifiers . . . . 20
1.3 Background of Gyrotron Amplifiers . . . . 24
1.4 Photonic Band Gap Structures . . . . 26
1.5 THz Dynamic Nuclear Polarization NMR . . . . 29
1.5.1 Mechanisms of DNP . . . . 30
1.5.2 Time Domain DNP . . . . 35
1.6 Current Effort . . . . 35
2 Theory of Gyrotron Oscillators and Amplifiers 37 2.1 Axial and Azimuthal Bunching of Electrons . . . . 37
2.2 Fundamentals of Gyrotron Oscillators . . . . 40
2.2.1 Nonlinear Theory of Gyrotron Oscillators . . . . 41
2.2.2 A nalysis . . . . 48
2.3 Theory of Gyrotron Amplifiers . . . . 51
2.3.1 Nonlinear Equations of Motion . . . . 52
2.3.2 Derivation of Linear Gain . . . . 55
2.3.3 A nalysis . . . . 56
3 THz Waveguides: Theory and Experiment
3.1 Attenuation in Waveguides ...
3.2 Fundamental Rectangular Waveguide . . 3.2.1 Split-Block Choke . . . . 3.2.2 Components . . . . 3.3 PBG Waveguide . . . . 3.3.1 Photonic Band Gaps . . . . 3.3.2 PBG Defect Modes . . . . 3.4 Overmoded Corrugated Waveguide . . . 3.4.1 Introduction . . . .
3.4.2 High-Power Low-Loss Corrugated Metallic THz L ines . . . .
3.4.3 Theory of Ohmic Losses in Corrugated Waveguid
3.4.4 Simulations in HFSS . . . . 3.4.5 3.4.6 3.4.7 Transmission
es.. . . . .
Fabrication of Helically-Tapped Transmission Line Components Straight Waveguide Measurements . . . .
Discussion and Conclusions . . . .
4 PBG Gyrotron Amplifier Design
4.1
Introduction . . . .
4.2 PBG Interaction Circuit...
4.3 Input Coupler . . . .
4.4 Output Coupler . . . .
4.5 Linear and Nonlinear Simulations 4.6 Conclusions . . . . 5 Experimental Setup 5.1 High-Voltage Modulator... 5.2 Superconducting Magnet... 5.3 Electron Gun . . . . 5.4 Solid-State Driver . . . .65
65
67
67 70 72 72 7880
81 84 89 91 94 95 100103
103 105 111 113 117 126 127 127 131 135 1445.5 Control Software . . . . 144
5.6 Heterodyne Frequency Detection . . . . 147
6 Experimental Results 151 6.1 Solid Model . . . . 151
6.2 Cold Tests . . . . 155
6.2.1 Wraparound Coupler and Launcher . . . . 155
6.2.2 Overmoded Transmission Line . . . . 155
6.2.3 Component Calibration . . . . 157
6.3 A ssem bly . . . . 163
6.4 Gyrotron Amplifier Results . . . . 167
6.4.1 Output Beam Pattern . . . . 168
6.4.2 Frequency Measurements . . . . 168
6.4.3 Instantaneous Bandwidth . . . . 174
6.4.4 Linear Gain . . . . 176
6.4.5 Effect of Current and Voltage Variations . . . . 177
6.4.6 Future Improvements . . . . 183
List of Figures
1-1 Power output for vacuum electron and solid state devices [111]. 23
1-2 Schematic of an optical Bragg reflector. . . . . 28
1-3 Bragg reflector optimized for operation at 800 nm. . . . . 28
1-4 Common DNP polarization transfer mechanisms . . . . 34
2-1 The solution to Equation (2.5) for Q/-yow, = 10 and -yo = 1.02 . . . . 40
2-2 Cross section of the interaction region . . . . 42
2-3 Dispersion diagram for cyclotron resonance . . . . 42
2-4 Cross section of the interaction region . . . . 44
2-5 Contour plot for efficiency of the 1st harmonic . . . . 50
2-6 Contour plot for efficiency of the 2nd harmonic . . . . 50
2-7 The fraction of electron energy that is extracted . . . . 51
2-8 Dispersion diagram for a 1st harmonic gyrotron amplifier . . . . 52
2-9 Contour plot for the perpendicular efficiency of the 1st harmonic . . . 57
2-10 The perpendicular efficiency as a function of circuit . . . . 58
2-11 Electron orbital phase for 16 of the 32 electrons . . . . 58
2-12 Comparison between linear an nonlinear simulations for identical . . . 60
2-13 Effect of attenuation on the linear gain of a gyrotron amplifier . . . . 62
2-14 (a) Dispersion diagram for the system being analyzed . . . . 63
3-1 Cross section of waveguide for various fabrication techniques . . . . . 69
3-3 Measured and simulated 3 dB and 10 dB couplers . . . . 71
3-4 Triangular lattice of metallic rods . . . . 74
3-5 Reciprocal triangular lattice where b' 4. ... 74
3-6 Master/slave boundaries for the PBG unit cell . . . . 76
3-7 Normalized eigenmode frequencies as a function of k1 for a/b = 0.2 77 3-8 Normalized eigenmode frequencies as a function of k1 for a/b = 0.43 77 3-9 The global band gap plot for a triangular lattice, where a is . . . . . 78
3-10 Comparison between hexagonal and PBG waveguide . . . . 80
3-11 Illustration of a corrugated metallic waveguide which . . . . 85
3-12 The 250 GHz transmission line . . . . 87
3-13 The 460 GHz transmission line . . . . 88
3-14 Ohmic losses in overmoded circular corrugated waveguide . . . . 91
3-15 The magnitude of the electric field from HFSS simulations . . . . 93
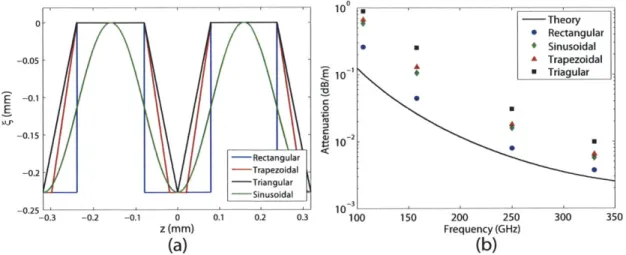
3-16 Groove shapes simulated in HFSS . . . . 94
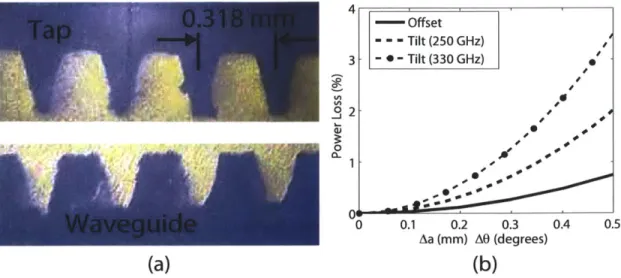
3-17 (a) Photos of the 330 GHz tap and waveguide cross sections. . . . . . 96
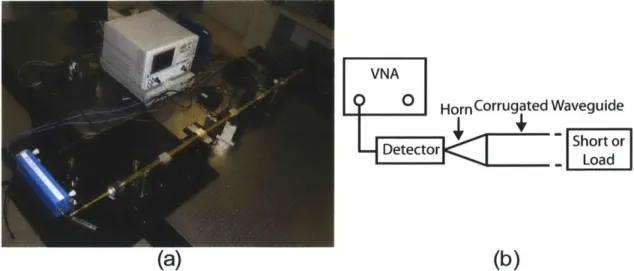
3-18 VNA setup for 330 GHz waveguide loss measurements. . . . . 97
3-19 Predicted (black line) and measured (red dot) signal from the VNA . 99 3-20 Measured transmission through 19 mm ID corrugated waveguide . . 100
4-1 Dispersion relation for a circular waveguide . . . . 104
4-2 The global band gap plot . . . . 106
4-3 The magnitude of the electric field for the TE0 3 mode . . . . 108
4-4 The magnitude of the electric field for the TE0 3-like mode . . . . 108
4-5 Attenuation as a function of frequency for the TE03-like mode. . . . . 110
4-6 Normalized coupling coefficient comparison . . . . 110
4-7 Band gaps in at triangular lattice. . . . . 112
4-8 S-parameters for the wraparound input coupler simulated in HFSS. 112 4-9 Dimensions of the up-taper simulated in CASCADE and HFSS. . . . 115
4-10 Ray tracing diagram for a step cut launcher . . . . 115
4-12 Dispersion relation for the parameters in Table 4.1 . . . . 119
4-13 Linear gain in dB/cm from linear and nonlinear theory. . . . . 119
4-14 The circuit gain for the device . . . . 121
4-15 Dimensions of circuit simulated in MAGY. . . . . 121
4-16 Output power as a function of frequency . . . . 123
4-17 Input power as a function of frequency required to reach saturation . 123 4-18 Output power as a function of the input power for 252 GHz . . . . . 124
4-19 Dispersion relation for alternate parameters . . . . 124
4-20 Circuit gain for a low a simulation. . . . . 125
4-21 Circuit gain for a high a simulation. . . . . 125
5-1 The 250 GHz gyrotron amplifier laboratory setup. . . . . 129
5-2 Scandinova Systems AB high-voltage modulator . . . . 130
5-3 High-voltage modulator pulse into the gyrotron load. . . . . 130
5-4 Cross-sectional CAD drawing of the 9.6 T magnet. . . . . 132
5-5 The Cryomagnetics, Inc. 9.6 T magnet. . . . . 132
5-6 Helium gas being vented from the magnet during a training quench. . 133 5-7 The magnetic field plotted as a function of distance . . . . 133
5-8 The main magnetic field . . . . 134
5-9 Gun parameters calculated using equations derived by Baird . . . . . 137
5-10 Schematic of the electron gun design . . . . 137
5-11 Electric field distribution for the cathode at -32 kV . . . . 139
5-12 Operational parameters for the electron gun . . . . 140
5-13 Bell jar tests conducted at CPI, Inc., courtesy of Kevin Felch . . . . . 142
5-14 Correct wiring schematic for a heater power supply. . . . . 143
5-15 I-V characteristics for the electron gun . . . . 143
5-16 VDI solid state driver . . . . 144
5-17 Various programs used to operate the gyrotron amplifier. . . . . 146
5-18 Schematic of the heterodyne receiver system . . . . 149
6-2 6-3 6-4 6-5 156 156 158 158 6-6 6-7 6-8 6-9 6-10 6-11 6-12 6-13 6-14 6-15 6-16 6-17 6-18 6-19 6-20 6-21 6-22 6-23 6-24 6-25 6-26 6-27 6-28
Structure used in the cold tests for the TE03 wraparound . . .
Measured and calculated S2 1 for the TE0 3 wraparound . . . .
Structure used in the cold test of the PBG waveguide. . . . . . Setup for testing a 4 m helically-tapped corrugated waveguide VNA measurements for component calibration . . . . The VNA setup during the testing of the variable attenuator . Gentec-EO Pyroelectric Joulemeter probe calibration . . . . . Fully assembled PBG circuit . . . . Fully assembled amplifier insert . . . . Photograph of the assembled amplifier . . . . Diode trace measured at the gyrotron amplifier output . . . . Maximum power recorded as a function of frequency . . . . . The radiated field pattern of the amplifier . . . . Simulated output beam pattern from HFSS. . . . . Oscillation and amplification frequency spectrum . . . . Down-converted spectrum of amplification at 253.632 GHz . . High-gain operating point which provides peak output power . Three wide-bandwidth operating points . . . . Three high-gain operating points . . . . Input power vs. output power . . . . Gain as a function of the electron beam voltage . . . . Saturated gain as a function of the electron beam voltage . . . Gain as a function of the electron beam current . . . . Gain as a function of the electron beam current and voltage New wraparound input coupler design and testing . . . . . Photograph of the combined Vlasov launcher input and output Experiment for a combined Vlasov launcher . . . .
. . . . 160 . . . . 161 . . . . 162 . . . . 164 . . . . 165 . . . . 166 . . . . 170 . . . . 170 . . . . 171 . . . . 171 . . . . 172 . . . . 173 . . . . 175 . . . . 177 . . . . 178 . . . . 179 . . . . 181 . . . . 181 . . . . 182 . . . . 182 . . . . 184 . . . . 185 . . . . 185
List of Tables
1.1 Illustrative THz Gyrotron Oscillator Experiments . . . . 22
1.2 Recent Gyrotron Amplifier Experiments . . . . 25
3.1 Simulation Parameters to Investigate Brillouin Zone . . . . 76
3.2 Corrugation Shape Depth Correction . . . . 93
3.3 Modes at the Aperture of the Corrugated Waveguide . . . . 97
3.4 Normalized Attenuation Coefficient for Metallic Waveguide . . . . 101
4.1 Design Operating Parameters . . . . 118
Abbreviations and Acronyms
AC Alternating current
BWO Backward-wave oscillator
CE Cross effect
CPI Communication and Power Industries, Inc. CVD Capacitive voltage divider
CW Continuous wave
DAQ Data acquisition
DC Direct current
DNP Dynamic nuclear polarization EIO Extended interaction oscillator ECRH Electron cyclotron resonance heating EPR Electron paramagnetic resonance HFSS High Frequency Structure Simulator IAP Institute of Applied Physics
IF Intermediate frequency
LO Local oscillator
MAGY Maryland Gyrotron self-consistent code MAS Magic angle spinning
MIG Magnetron injection gun
MIT Massachusetts Institute of Technology NMR Nuclear magnetic resonance
NRL U.S. Naval Research Laboratory NTHU National Tsing Hua University
PBG Photonic band gap
RF Radio frequency
SE Solid effect
TE Transverse electric
TM Transverse magnetic
TWT Traveling-wave tube
VDI Virginia Diodes, Inc. VNA Vector network analyzer
Chapter
Introduction
1.1
Motivation
High-power sources in the millimeter wave, sub-millimeter wave and THz regime of the electromagnetic spectrum are of great interest due to their potential applications in spectroscopy, communications and radar. Many of these applications require the source to provide phase stability and control. However, there are currently no com-mercially available devices that can meet this requirement while providing output powers > 100 W. Among the most exciting applications for high power THz sources is pulsed dynamic nuclear polarization (DNP) nuclear magnetic resonance (NMR) spectroscopy. Microwave-driven DNP experiments are now recognized as a powerful method of enhancing signals in solid state and solution NMR and imaging. DNP improves the sensitivity of NMR spectra by about a factor of 100 [17]. DNP has been demonstrated successfully up to 16.4 T (1H/e- frequencies of 700 MHz
/
460 GHz)using a gyrotron oscillator [18]. However, modern NMR spectroscopy is moving to higher magnetic fields, where much better spectral resolution is achieved. This in-crease in magnetic field results in a dein-crease in the achievable enhancement as WO for the cross effect and wo2 for the solid effect [71], where wo is the frequency of operation. Circumventing these reductions in DNP enhancements requires the use of time domain-DNP (pulsed-DNP) experiments. The extension of pulsed-DNP to higher magnetic fields requires the development of THz sources at the relevant
fre-quencies with phase control and the ability to generate the required pulse sequences. Gyrotron amplifiers are the most promising technology available because they offer the possibility of achieving high gain and broad bandwidth even as the frequency of operation moves into the THz band.
1.2
Gyrotron Oscillators and Amplifiers
The generation of millimeter and sub-millimeter wavelength radiation at high power has proved to be a significant challenge. Solid state devices cannot be considered as a possibility for high power generation at such high frequencies (hundreds of GHz) due to scalability and efficiency issues. Classical microwave tubes, e.g. klystrons and traveling wave tubes, can produce high power (kW) electromagnetic radiation up to 100 GHz [73], but these slow wave devices require physical structures in the interaction cavity that are smaller than the wavelength of operation. This small element size produces difficulties with thermal damage and manufacturing of the interaction cavity. Gyrotrons are a form of electron cyclotron resonance maser capable of producing kilowatts to megawatts of output power in the microwave, millimeter wave and terahertz bands [63, 42, 70, 122, 159]. Gyrotrons were initially proposed due to the cyclotron resonance instability that was discovered independently in the late 1950s by R. Twiss [166], J. Schneider [144] and A. Gaponov [66]. This led to the invention of the gyrotron in a similar configuration to the one described in Section 2.2 by Gaponov et al. [67] with 190 W continuous wave (CW) power at 12 mm wavelength. This was followed by the design of gyrotrons in the 1970s that could produce several kW of power at frequencies up to 300 GHz by Zaytsev et al. [181]. To minimize the thermal load, the production of pulse gyrotron oscillators with several hundred kW of power and high frequencies was completed in the 1980s [157]. In the past two decades the focus has shifted from simply achieving higher frequency devices to providing useful millimeter and sub-millimeter wave sources for Electron Cyclotron Resonance Heating (ECRH) of plasmas [156], DNP NMR and Electron Paramagnetic Resonance (EPR) experiments [17]. This shift changed the focus to
providing reliability, efficient power conversion and delivery, larger bandwidth and signal stability.
Gyrotrons operate by the resonant interaction between the eigenmodes of an in-teraction cavity, typically cylindrical, and a mildly relativistic electron beam that is gyrating in a constant axial magnetic field. The most basic configuration of a gyrotron consists of a magnetron injection gun (MIG) that launches an annular electron beam into the hollow bore of a solenoidal, often superconducting, magnet. The orientation of the DC electric field that extracts the electron beam from the cathode produces a beam that has both a perpendicular and parallel velocity component to the axial field produced by the solenoidal magnet. As the electron beam travels into the cen-tral bore, it undergoes adiabatic compression that increases its orbital momentum. The beam enters a metallic cavity that has an eigenmode resonance that is close to a harmonic of the frequency at which the electron gyrates around the magnetic field line. The electron beam surrenders some of its kinetic energy to the electromagnetic mode through stimulated emission. The electrons exit the cavity and are deposited on a metallic collector. In its simplest configuration, the collector can also hold an axial dielectric window that couples the electromagnetic radiation out of the device. However, it is often convenient to convert the wave into a Gaussian beam that can be efficiently extracted in a transverse direction using mirrors.
Table 1.1 shows some leading CW and pulse gyrotron experiments in terms of frequency of operation, power output, and bandwidth. In Figure 1-1, the achieved single device power output for solid state and vacuum electron devices is plotted. The THz gap is clearly visible with conventional gyrotrons having a clear supremacy for the 100-500 GHz range.
A new class of device called the gyrotron traveling-wave-tube (TWT) amplifier (gyrotron amplifier, gyro-TWT, gyro-amplifier) also emerged from the discovery of the cyclotron resonance instability [44], described in Section 2.3 of this paper. In recent years, gyrotron amplifiers have demonstrated high-output power levels with significant gain bandwidths [43, 36, 25]. A gyrotron amplifier works on the same
Table 1.1: Source Year MIT[19] MIT[165] CPI[141] Fukui[85] MIT[163] IAP[179] MIT[81] MIT[97] IAP[181] Fukui[86] 2012 2011 2010 2010 2010 2009 2004 2000 1973 1998
Illustrative THz Gyrotron Oscillator
Frequency Cyclotron Mode
(GHz) Harmonic (TEmnp) 250 1 TE5,2,1 330 2 TE4,3,1 263 1 TEo,3,1 395 2 TEo,6,1 460 2 TEu,2,1 260 2 TEO,6,1 460 2 TEO,6,1 250 1 TEo,3,1 326 2 TE2,3,1 301 1 TEo,3,1 Experiments V I (kV) (A) 12 0.18 10.1 0.19 13 0.05 12 0.300 13 0.1 13 0.4 12.4 0.13 12 0.05 27.9 0.9 14 0.08
fundamental principles as a gyrotron oscillator for the extraction of energy from an electron beam. However, the amplifier is operated under conditions that suppress self-start oscillations, including backward wave oscillations (BWOs) that could disrupt the operation of the device. Amplification is achieved in a gyrotron amplifier by a convective instability that results from the interaction of a mildly relativistic, annular, gyrating electron beam and a transverse electric (TE) mode in a waveguide immersed in a strong static axial magnetic field (Bo), described in Section 2.1. The grazing intersection between the dispersion relation lines of the cyclotron resonance and a
TE waveguide mode near the waveguide cutoff results in high gain and moderate
bandwidth. The Doppler shifted electron beam resonance condition is given by
w - sG/7 - kzvz = 0 (1.1)
and the waveguide mode dispersion relation is
w2
-kc 2
-k2c 2
= 0, (1.2)
where w is the frequency of the wave; Q = eBo/me is the non-relativistic cyclotron frequency of the gyrating electrons; e and me are, respectively, the charge and the rest mass of the electron; y is the relativistic mass factor; s = 1 is the cyclotron
har-P
(W)
35 18 80 40 16 100 8 25 1500 17Vacuum Devices
106
-
--
==+
Gyrotron
10
Klystron
Gridded Tubes
4 10FA
-
Helix TWT
WT
103
DNP NMR
~10
0
BT
Gyrotrons
102
10FET
BWO
1
Solid State
10
Devices
10-2
IMPATT
0.0001
0.001
0.01
0.1
1
10
Frequency (THz)
Figure 1-1: Power output for vacuum electron and solid state devices [111]. monic number; k, and k1 are the longitudinal and transverse propagation constants,
respectively, of the waveguide mode; v_ is the axial velocity of the electrons and c is the speed of light. This requires the design of an interaction circuit that supports the propagation of a mode at the correct frequency while appearing lossy to frequencies and modes outside the region of interest. This is usually performed by inserting lossy ceramics, severs and selecting geometries with favorable dispersion relations [91]. Fur-ther complications arise when considering the design of an amplifier above 100 GHz because the operational mode of the amplifier cannot be a fundamental mode due to compression restrictions of the electron beam. When the transverse dimension of the electron beam is on the order of the operational wavelength a higher order mode interaction circuit is required. In a gyrotron amplifier, the signal of interest must be efficiently coupled into the cavity at the beginning of the interaction region. The wave propagates along the amplifier circuit while extracting energy from the electron beam until it is removed from the device with an output coupler in a similar fashion to the oscillator.
the gyro-klystron and the gyro-twystron. The gyro-klystron consists of a series of isolated cavities with electromagnetic coupling for the first cavity and the final cavity
[180, 52, 29, 30]. The bunching mechanism is driven by the input signal in the first
cavity. The gyro-klystron can achieve significant efficiencies and it is insensitive to velocity spread similar to the gyrotron oscillator. However, the bandwidth of the gyro-klystron is limited and it requires precise tuning of the cavities. The gyro-twystron is a hybrid between the gyrotron TWT amplifier and a klystron. The gyro-twystron consists of an initial bunching cavity followed by a traveling wave section for the output [28, 27]. This configuration limits the sensitivity of the amplifier to the frequency of the initial cavity, but it decreases the gain with respect to a gyro-klystron and the bandwidth is still limited when compared to a gyrotron TWT amplifier.
1.3
Background of Gyrotron Amplifiers
Gyrotron TWT amplifiers were first studied in the early 1970s, mainly at the Naval Research Laboratory (NRL), with devices in the X and Ku bands that operated in the fundamental waveguide mode [20, 132]. These early studies showed how the promise of high gain and high-output power in gyrotron amplifiers was limited by the strong forward and backward wave gyrotron oscillations near the waveguide cutoff and interaction at higher harmonics.
More recently, a scheme of distributed loading was proposed by the research group at the National Tsing Hua University (NTHU) in Taiwan to suppress the gyrotron backward wave oscillations (gyro-BWO) and forward wave gyrotron oscillations near the waveguide cutoff. A proof-of-principle device demonstrated over 70 dB of gain at
35 GHz [43]. This device operated in the fundamental TE1 1 waveguide mode.
Subse-quently, a TEOi high average power device based on this concept was demonstrated at NRL [121] and a TEOi device was demonstrated at 94 GHz by Communication and Power Industries, Inc. (CPI) [26]. A comparison of recent gyrotron amplifier experiments is shown in Table 1.2.
Table 1.2: Recent Gyrotron Amplifier Experiments
Frequency Gain Pot Voltage Current
(GHz)
(dB)
(kW)
(kV)
(A)
UESTC (2010) [169] 34 40 160 70 10 MIT (2008) [91] 140 34 0.8 37 2.7 CPI (2005) [26] 95 43 1.5 30 1.8 NRL (2004) [134] 35 60 78 70 6 MIT (2003) [148] 140 29 30 65 7 NTHU (1998) [43] 35 70 93 100 3.5Operation at fundamental modes is not feasible at high frequencies such as 250 GHz where the radius of the interaction structure would be on the order of a fraction of a millimeter. This results in high ohmic losses and presents a significant challenge in transporting an electron beam over long distances (-300 mm) without causing beam interception on the waveguide walls. In prior research at MIT, gyrotron am-plifiers with high power (30 kW) and low power (0.8 kW) have been successfully demonstrated at 140 GHz [150, 91]. These experiments used a novel quasioptical, overmoded interaction structure which allows for single mode operation in a higher order mode. The interaction circuit consists of a confocal waveguide with severs for additional suppression of oscillations. Such a mode-selective open waveguide imparts
high diffractive losses to the lower order modes which tend to interact with the beam
more strongly. This selective loading of the lower order modes allows for stable oper-ation in a higher order mode. Though mode selective, the confocal waveguide has an azimuthally asymmetric field profile which reduces its interaction efficiency with the annular beam produced by the MIG that is typically used in gyrotrons.
Instantaneous gain bandwidth often plays a role in determining the successful implementation of an amplifier. One important application of millimeter waves is in spectroscopy, where coherent pulses are needed for optical pumping of molecu-lar states. The pulses must be shorter than the relaxation time, typically requiring sub-nanosecond (or picosecond scale) pulse lengths [23]. Sub-nanosecond microwave pulses have been demonstrated in a vacuum electron device by super-radiance [69], but such pulses cannot be used for spectroscopy. Sub-nanosecond pulses must
con-tain a spectral bandwidth exceeding the transform limit of fBW ~ 1 GHz. In the conventional microwave bands at frequencies of one to several GHz, the required gain bandwidth to amplify such picosecond pulses is generally not available, since
fBW
is a large fraction of the carrier frequency. In recent years, high power, wideband amplifiers in the millimeter wave band have been developed that are suitable for amplifying picosecond pulses. For example, a form of klystron called an extended interaction klystron has been developed at 95 GHz with a gain bandwidth of about 1 GHz. This amplifier has been used to successfully amplify 1 kW output pulses as short as 800 ps [32]. A gyrotron amplifier at 95 GHz has been demonstrated with a gain bandwidth of 6.5 GHz at an output power level of 2 kW [25]. This gyrotron am-plifier could in principle be used to amplify a 150 ps pulse. Amplification of picosecond pulses was tested with the MIT 140 GHz wideband gyrotron amplifier [93]. Detailed studies were needed of the amplification process in gyrotron amplifiers because of the possibility of distortion in amplification of picosecond pulses. Pulses as short as 400 ps were amplified with minor distortion and 1 ns pulses were amplified with almost no distortion. The broadening of the pulses from waveguide dispersion and limited gain bandwidth was characterized and these were shown to be the contributing factors to the pulse distortion.
1.4
Photonic Band Gap Structures
As mentioned in Section 1.2, the gyrotron amplifier requires a circuit able to suppress the interaction between the electron beam and modes that are not of interest. At long wavelengths, when the operational mode is close to the fundamental mode of the waveguide, this circuit can be achieved with the use of dielectric loading which is placed such that it suppresses the undesired mode while having limited impact on the operational mode. However, at shorter wavelengths, where a highly overmoded circuit is required, dielectric loading becomes difficult to fabricate because of the decrease in size. Additionally, the design of the dielectric loading such that it suppresses all dan-gerous modes becomes difficult because of the increasing number of modes that must
be taken into account. Photonic band gap (PBG) structures offer the promise of a frequency selective circuit where the boundary condition at the waveguide "wall" can prevent undesired oscillations. A PBG is defined as a periodic structure in one, two or three dimensions that is composed of metal and/or dielectric components where certain frequencies are not allowed to propagate through the lattice. PBG structures have been demonstrated successfully as optical waveguides [98] and accelerator struc-tures [152]. A common example of a PBG is a Bragg reflector composed of alternating layers of dielectric. Bragg reflectors are often used in optics because of their frequency selective properties. Figure 1-2 is an example of a Bragg reflector made from AlAs and AlGaAs layering on a GaAs substrate. The reflected power for 25 paired layers is shown in Figure 1-3. Primarily metallic PBG structures are of interest for gyrotron oscillators [149] and amplifiers due to their inherent compatibility with the presence of the electron beam (negating concern of charge buildup on dielectric surfaces). The global band gap of a 2D triangular lattice of metallic rods and its implementation as a waveguide is described in Section 3.3.
Substrate
82
Figure 1-2: Schematic of an optical Bragg reflector.
0.6-
0.4-0.2
0-600
700
800
900
Wavelength (nm)
Figure 1-3: Bragg reflector optimized for operation at 800 unm.
80
1
0.8
00S SO1000
0 _01.5
THz Dynamic Nuclear Polarization NMR
NMR is the preferred spectroscopic approach for the solution of problems in many areas of science, including physics, chemistry, biology, materials science, and medicine. The excellent resolution of NMR is a consequence of long nuclear relaxation times that are due to the small magnetic moments of the nuclear spins that couple weakly to the surrounding lattice. The small size of these magnetic moments, however, leads to reduced sensitivity in NMR experiments.
DNP increases the sensitivity of NMR by transferring the large spin polarization
from stable paramagnetic centers to the nuclear spin reservoir [1]. In 1953 Overhauser
[131] proposed that it was possible to transfer polarization to nuclei from electrons
in metals by saturating the electron transition. This technique was experimentally verified by Carver and Slichter [38]. The DNP approach to NMR was extended to solid dielectrics by Abragam and Proctor [2] who first characterized the solid effect
(SE). In the 1980's, Wind, Yannoni, Schaefer and colleagues [3, 147, 171] performed DNP in conjunction with magic-angle-spinning (MAS) NMR.
Microwave-driven DNP experiments are now recognized as a powerful method of enhancing signals in solid state and solution NMR and imaging. DNP improves the sensitivity of NMR spectra by approximately a factor of 100, thus reducing the acquisition time in multidimensional NMR experiments by roughly 10' [17]. This en-hancement permits studies of larger molecules, reaction dynamics or high-throughput screening [74]. The theoretical maximum enhancement in the case of 1H spins is given
by the relationship ys/yi ~ 660 [131] where 7/s and y1 are the electron and nuclear
gyromagnetic ratios, indicating further developments to DNP methods and instru-mentation should result in still higher enhancements. The power level desired from the THz source in DNP is highly dependent on several experimental factors includ-ing the mechanism of polarization, sample temperature, sample volume, polarizinclud-ing agent and coupling efficiency of the source. Fundamentally, the power level needed is related to the electron relaxation rate which must be overcome in order to trans-fer polarization to the nucleus [172, 173]. Experimentally, the theoretical maximum
enhancement from DNP is not achieved and is often limited by the available THz power.
These early, successful efforts in microwave-driven DNP NMR could be extended to magnetic fields of up to about 3.4 T using commercially available sources, such as solid state multipliers, klystrons, etc., at a frequency of up to 94 GHz [10]. However, modern NMR spectroscopy has pushed to much higher magnetic fields, where much better spectral resolution is achieved. The extension of DNP NMR to high magnetic fields had to wait for the development of THz sources of radiation at the relevant frequencies. Fortunately, the development of the THz gyrotron enabled this extension of DNP NMR into the high magnetic field regime.
The first DNP NMR experiments using a gyrotron were conducted by Becerra et al. in 1993 at the MIT Francis Bitter Magnet Laboratory at a magnetic field of 5 T, corresponding to 211 MHz NMR frequency and 140 GHz microwave frequency [22]. This successful advance was followed at MIT by extension of the technique to 9 T with the development of a 250 GHz gyrotron for use in a 380 MHz spectrometer [15] and later to 16 T with the development of a 460 GHz gyrotron for a 700 MHz spectrometer [80, 18]. Research on the gyrotron also led to the discovery of broadband tuning of the gyrotron source, which could be useful in partially covering the electron spin resonance spectrum in DNP NMR experiments [80, 164].
As described by Griffin and Prisner in a recent article, DNP NMR is truly enjoying a "Crenaissance" at the present time [74]. Some examples of recently developed THz DNP NMR systems include a 260 GHz
/
400 MHz spectrometer in operation in Frankfurt, Germany [56, 8] and a 395 GHz/
600 MHz spectrometer operating at the Osaka Institute in Japan [105]. Instrumentation for a 263 GHz/
400 MHz DNP NMR system has been developed by industry and used in DNP NMR research [8, 141, 168].1.5.1
Mechanisms of DNP
The structure and function of biomolecules are strongly correlated. Determining three-dimensional structural detail of proteins at an atomic resolution is crucial to understanding how they work as machines, how they catalyze chemical reactions,
how they bind to each other, as well as how they interact with drugs and signaling molecules. By far, the most powerful technique available for structure determination is X-ray diffraction. However, there are certain drawbacks to X-ray crystallography; namely, the highly ordered crystalline environment required to record diffraction pat-terns does not accurately represent a biological environment. In vivo, proteins are present in solution, bound to or embedded inside the cellular membrane, intrinsically disordered, or arrange themselves into amyloid fibrillar strands. For such molecules in a biologically realistic environment, X-ray diffraction is not applicable, and the mag-netic resonance of nuclear and electron spins can be leveraged to determine structural detail. In particular, the site-specific signals of nuclear spins can reveal sub-angstrom level structural detail of proteins and molecules. Due to the excellent resolution of NMR spectra, NMR has evolved as the preferred spectroscopic approach for the so-lution of problems in many areas of science, including physics, chemistry, biology, materials science, and more recently, medicine. Nevertheless, the sensitivity of NMR experiments is low when compared to other spectroscopic approaches. Furthermore, since both high resolution solid and solution state NMR are utilized with increasing frequency in structural studies of macromolecular biological systems (proteins, nu-cleic acids, etc.), sensitivity continues to be an issue of paramount importance in the successful application of the technique.
DNP has successfully improved the sensitivity in NMR experiments by factors of 20-400 (corresponding to 400-160,000 in acquisition time) [104, 90], depending on the experimental conditions such as temperature, solvent composition, deuteration levels, radical type and concentration, etc. The increased signal intensity shortens the acquisition time, reduces the amount of sample required and allows the acquisition of multidimensional spectra with high signal to noise. The following subsections illustrate the mechanism of polarization transfer for efficient DNP at high fields and show that large DNP polarization enhancements are consistently obtained at high field. These results demonstrate applications to structural studies of biologically significant systems which would not be feasible without DNP.
experiments were incorporated into MAS experiments with a goal of increasing signal intensities in the spectra [147, 171]. MAS of samples in solid-state NMR (SSNMR) spectroscopy reduces line broadening in spectra by spinning at the magic angle of
54.7" with respect to the magnetic field, B0. These initial MAS DNP experiments
used 40 GHz microwaves (1.5 T) and the solid effect (SE); signal enhancements of
25 were observed at ~300 K [3, 4, 5, 7, 6]. Subsequently, DNP experiments were initiated at MIT at 140 and 250 GHz (5 and 9 T fields) [22, 15, 68, 142, 140, 16, 103]
using gyrotrons.
The two mechanisms that are most important for CW DNP processes in MAS experiments are the solid effect (SE) and the cross effect (CE). Which of the two mechanisms dominate (SE or CE) depends on the size of the inhomogeneous breadth,
A, and the homogeneous breadth, 6, of the electron paramagnetic resonance (EPR)
spectrum, compared to the nuclear Larmor frequency, woI.
The SE is a two spin process (Figure 1-4(a) left) that governs the polarization process when woI > A, 6 and thus requires a radical with a narrow line such as trityl (Figure 1-4(b), (d) left). The frequency dependence of the enhancement profile for trityl is illustrated in Figure 1-4(c) (left) and shows minima and maxima when the irradiation frequency is wos i wo1, where forbidden electron-nuclear flip-flops are
excited leading to a negative or positive enhancement. Since the SE utilizes forbidden transitions the enhancements scale as wo-2
and are therefore attenuated at higher fields
[71].
The CE, a three spin effect (Figure 1-4(a), right), is a DNP mechanism that has been shown to yield more efficient transfers at high-field. It relies on the fact that the resonance frequencies of two electrons in the EPR spectrum, wosi and wos2,
satisfy the condition WOSi - ws2 = W01 (Figure 1-4(b),(c) right) and, as such, the
enhancements scale as w. Furthermore, the CE works well with a large set of radicals such as nitroxides (TEMPO and its relatives), in which A > woi > 6 at
high field. Assuming dipole-dipole couplings exist amongst the two electrons and the nucleus, THz irradiation near either w0s or Wos2 flips one of the electrons up, and
between the two electron spins going into polarizing the nuclear spin.
The efficiency of CE depends on two spatial factors: (1) the distance between the electron spins, which determines the electron-electron dipolar coupling and (2) the relative orientation of the two radicals, which determines, via the g-anisotropy tensors, the frequency separation wosi - Wos2. For the case of biradical polarizing
agents, both of these factors can be optimized by design of the molecular linkage tethering two nitroxide groups such as that found in
1-(TEMPO-4-oxy)-3-(TEMPO-4-amino)propan-2-ol (TOTAPOL) [83] (Figure 1-4(d), right) and
bis-TEMPO-bis-ketal (bTbK) [104]. The magnitude of the maximum enhancement obtained with the
water-soluble TOTAPOL radical is ~175 at 212 MHz with 6 W of THz power [83],
an improvement by a factor of ~4 from monomeric nitroxides like TEMPO. Since the tether connecting the two TEMPO groups is relatively flexible, their relative orientation is not tightly constrained and many biradicals do not have the correct geometry corresponding to the desired separation frequency. Therefore, with a more rigid tether that can lock the two TEMPOs at a desired relative orientation, it is possible to further improve the performance of a polarizing agent. Enhancements of
250 with 4 W of THz power are achieved using bTbK, a new biradical connecting two
TEMPOs with a rigid bis-ketal tether [104]. Thus, significant gains in enhancements have been realized by optimization of polarizing agents for high-field DNP.
An important point illustrated in Figure 1-4(c) is that magnetic field (B0) has
to be swept to the appropriate point in the EPR spectrum in order to optimize the
DNP enhancement. In present day DNP spectrometers, this is accomplished with
a superconducting sweep coil that was installed on the magnet at the time it was manufactured. In NMR magnets that lack a sweep coil, a tunable source of THz radiation would be useful.
Other spectroscopic techniques are enabled by double resonance (NMR and mi-crowave) methods. The Overhauser effect (OE) [131] is important for conducting solids (metals, etc.) and solution samples. Thermal mixing involves a homogeneously broadened EPR spectrum [12] that is present at low magnetic field and, as such, is
Solid Effect
Cross Effect
a) S I S I S1S2 11 S21 b) 0.1404 0.1402 0.1400 0.1398 0.1404 0.1402 0.1400 0.1398 I I I I I I I I THz source+ S THz source -S2 CC ,/2n o,/2n C LU C) + E U) I I I I I I I 0.1404 0.1402 0.1400 0.1398 0.1404 0.1402 0.1400 0.1398 Frequency (THz) Frequency (THz) d) e CD NaOOC COONa 030 D3 CD3 0 /") Nj D3 63 OH D3 D3 COONaFigure 1-4: Common DNP polarization transfer mechanisms in solid dielectrics. (a) In the SE, one electron and one nuclear spin flip simultaneously with excitation from THz radiation, whereas the CE involves two electron spins and one nuclear spin. (b) EPR spectra of the radicals that are the polarization source in THz DNP experi-ments. (left) The SE utilizes narrow line radicals such as trityl. (right) EPR spectra of nitroxide radicals such as TEMPO or TOTAPOL are much broader and used for the CE. (c) Field/frequency dependent profiles of the two mechanisms. In the SE (left) the THz source is set to wo1 away from the center of the EPR line. (right) For the CE, the THz radiation is on resonance with one of the two electrons involved.
(d) Chemical structures of typical radicals used for the SE; trityl (left) has a mostly
isotropic environment around the unpaired electron density which results in a simi-lar resonance frequency (narrow line) across the powder average of the crystallites. TOTAPOL (right) for the CE, more anisotropic chemical environments around the electron density yield broader lines such that two electrons are separated by wo1 and
not applicable for THz DNP.
1.5.2
Time Domain DNP
The cross effect enhancements described in Section 1.5.1 were acquired at 211 MHz, and as one moves to higher magnetic fields these will scale as wo1. The CE relies on satisfying the matching conditions wosi - WOS2 = wo1, which becomes less likely as the EPR spectrum is broadened at higher fields, leading to the wo1 dependence. At 800 MHz, where much biological NMR is currently performed, enhancements will be reduced to -60. When the next generation NMR spectrometers at 1.2 GHz become available this number will drop to -40. For the solid effect (SE), the enhancement scales as wo2, since the mechanism involves mixing of states. So, if one observes a
SE enhancement of 100 at 200 MHz, then at 800 MHz the SE enhancement will be reduced to < 10. The SE relies on mixing of electron and nuclear states, which is reduced as the Zeeman frequencies are increased, leading to the wo2 dependence of
the transition moment. Time domain DNP experiments can be used to circumvent these reductions in DNP enhancements. These experiments are typically performed in the electronic rotating frame, and the electron Zeeman term is removed from any matching conditions and transition moments. Thus, these mechanisms do not scale with B0. Also, optimization of conditions accelerates the transfer, improving the rate
of DNP.
With the availability of a high power THz source capable of providing phase control and specific pulse sequences, one can explore approaches to pulsed DNP in-cluding: the integrated solid effect (ISE), nuclear rotating frame DNP (NRF-DNP), the dressed-state solid effect (DSSE) and nuclear-spin orientation via electron-spin locking (NOVEL).
1.6
Current Effort
This thesis presents the design, fabrication and testing of a PBG gyrotron TWT am-plifier. The circuit is based on a PBG structure made of a two dimensional triangular
lattice of metal rods. This novel interaction structure for gyrotron amplifiers is highly
mode selective and has strong coupling with the electron beam resulting in a high interaction efficiency. The dimensions of the lattice are tuned so that it acts as a re-flector in a narrow band of frequencies around the operating mode. A defect is created in the lattice by removing some rods, allowing a higher order mode to be confined with high a quality factor (Q). Other higher or lower frequency modes that can exist in the defect suffer significant losses because of the partially transparent lattice. This amplifier will ultimately be applied to coherent molecular spectroscopy. Therefore, the bandwidth has been an important consideration to ensure the amplification of very short pulses without distortion, since it is important to the application.
This thesis is organized as follows: Chapter 2 presents the theory of operation for gyrotron oscillators and amplifiers; Chapter 3 describes the development of low-loss THz waveguides needed to test and implement the amplifier; Chapter 4 explains the design of the PBG gyrotron amplifier; Chapter 5 details the experimental setup used to test the amplifier; Chapter 6 describes the testing methodology and experimental results of the amplifier; Chapter 7 contains concluding remarks.
Chapter2
Theory of Gyrotron Oscillators and
Amplifiers
2.1
Axial and Azimuthal Bunching of Electrons
An electron beam propagating along a magnetic field line is subject to a variety of instabilities. Of particular importance are the axial and azimuthal bunching mech-anisms of the electromagnetic electron cyclotron instability. The electron cyclotron maser instability is driven by the azimuthal bunching mechanism and requires a rel-ativistic treatment. The Weibel-type instability is driven by axial bunching and does not require relativistic treatment. Both mechanisms exist and compete against each other when an external magnetic field is present [45].
Assume an infinite homogeneous magnetic field, Bos, with the electron distribu-tion given by
fo
= 6(pi - pio)6(p.)/2rpi (2.1)where pi is the transverse momentum, p2 is the axial momentum and pLo is a con-stant. This distribution represents streaming electrons in the moving frame. This monoenergetic beam would be the ideal case for an experiment designed to extract energy from the electrons, and it approximates the electron beam produced by high quality electron guns.
If we perturb the electron beam with an electromagnetic wave, the system will require the linearized relativistic Vlasov equation,
a
a
ea
1
a
+ v--fi - -v x Bo -- f1=e E1+-vx -, -fo (2.2)
at
ax
c
ap
c
ap
and the combined Maxwell's equations,
1 82
4-r a
V x V x Ei=E 1 J 1- (2.3)
c2 8t2 c2 at
to fully describe the physics of the interaction. A subscript 0 or 1 represents the initial or perturbed quantity, respectively. The electron distribution is
f,
E is theelectric field, B is the magnetic field, and the current J is defined as
J1 = -e Jfivd3P. (2.4)
Simplifying the above equations and performing perturbative analysis for a wave that propagates as eikzz-iwt, we obtain the relativistic dispersion relation [45]:
w2 -kc 2 = -7rw pdp 1 dpz
[(
kzpz
afo
kz
2afo
(
k
-1
x W-YM P
am
p
+ - i (7 - kz-1
ym j\Ypzmwhere of = 47rne2
/m,
Q
= eBo/mc, andy
(1+p2/m 2c2+p /m 2c2)1/2. This expres-sion is for any generic distribution of the electrons. However, we can simplify further by considering the monoenergetic case from Equation (2.1) that is most relevant to practical devices. This reduces the dispersion relation to2 2
0i(2
L 2 -k2
2W -
k
cP
1 P
-(2.5)
yo uo - Q/yo 2(w - Q/0)2
where Yo = (1
+
pi/m2c2)i/ 2 and#1-o
= pLo/yomc. To extract some physicalin-terpretation from Equation (2.5) one should make note that the last term on the right hand side is where the axial and azimuthal bunching mechanisms reside. The
azimuthal and axial bunching are represented by the w2 and c2k2 terms respectively.
Furthermore, the denominator (w - Q/-yo) imposes a requirement that the frequency of oscillation for the wave must meet the condition w ~ Q/yo in order to produce a large instability. This can be understood as a requirement for synchronous behavior between the electrons and the electromagnetic wave. Additionally, if the phase veloc-ity of the wave is equal to the speed of light there is no instabilveloc-ity present, defining an inflection point between an instability dominated by axial and azimuthal bunching. If
W2/k
> c2, (2.6)the phase velocity of the wave is greater than the speed of light and azimuthal bunch-ing dominates. If
w2/k2 < c2, (2.7)
the phase velocity of the wave is less than the speed of light and axial bunching dominates. In Figure 2-1 the solution to Equation (2.5) is plotted for Q/yow, = 10 and -yo = 1.02. We note that the instability is only present when the frequency of the fast and slow wave meets the condition w/w, = 10 as required for synchronous behavior. The instability for the fast and slow wave is only present when Equations (2.6) and (2.7) are satisfied.
Fast Waveor
20 -
--
~bL Wav 10
VJSlow Wave
or
15 -
--
Slow Wave 100co
10 5-0 '
0
5 10 15 20 25k c
/o
z pFigure 2-1: The solution to Equation (2.5) for Q/yow, = 10 and '7o = 1.02. The real and imaginary part of w are labeled as wr and wi, respectively.
Gyrotrons oscillators and amplifiers are both fast wave devices that rely on the electron cyclotron maser instability, driven by the azimuthal bunching mechanism. Due to this bunching mechanism, a relativistic treatment is required to explain these devices properly.
2.2
Fundamentals of Gyrotron Oscillators
As mentioned in Section 1.2, electron cyclotron resonance masers (gyrotrons) are fast wave devices, i.e. the phase velocity of the wave is greater than the speed of light. They
are capable of producing high average power in the microwave, millimeter wave and sub-millimeter wave range. The most basic configuration of a gyrotron can be seen in Figure 2-2. The magnetron injection gun that launches an annular electron beam would be located to the left of Figure 2-2(a). The axial magnetic field is produced
by a solenoidal magnet than can either be a pulsed magnet or a DC superconducting
magnet. As the electron beam travels through the central bore, it enters a metallic cavity that has an eigenmode resonance that is close in frequency to a harmonic of the
frequency at which the electron gyrates around the magnetic field line. The electron beam surrenders some of its kinetic energy to the electromagnetic mode through stimulated emission.
In order for the electron to interact with the electromagnetic mode in the cavity, the relativistic electron frequency must be close to the frequency of oscillation for the cavity mode [44]. The relativistic cyclotron frequency is
QC = eBo (2.8)
'ymre
where B0 is the DC axial magnetic field, -y is the relativistic mass factor, me is the electron mass, e is the charge of the electron. In a cylindrical cavity the dispersion relation for TE modes is
- - =0, (2.9)
where k = w poco is the wave vector in free space, kt = vmp/rw is the transverse propagation constant, vm'p is the pth root of the mth order Bessel function and kz is the axial propagation constant. It can be shown [21] that the Doppler shifted resonance for the electron becomes
W - kzv - sQc = 0, (2.10) and when the frequency of the mode and the resonance intersect, as seen in Figure 2-3, oscillation and stimulated emission can occur. The blue and red line in Figure 2-3 are the electron beam dispersion relations for s = 1 and s = 2, respectively. The blue dot is a fundamental forward wave oscillation, the red dot is a second harmonic forward wave oscillation and the green dot is a fundamental backward wave oscillation.
2.2.1
Nonlinear Theory of Gyrotron Oscillators
To understand the operation of a gyrotron oscillator, we must describe the interaction between an energetic electron and the electromagnetic mode confined in the resonator or interaction cavity. Like all vacuum electron devices, gyrotrons extract kinetic
![Figure 1-1: Power output for vacuum electron and solid state devices [111].](https://thumb-eu.123doks.com/thumbv2/123doknet/13796068.440811/23.918.170.716.119.500/figure-power-output-vacuum-electron-solid-state-devices.webp)