Publisher’s version / Version de l'éditeur:
Canadian Geotechnical Journal, 7, 1, pp. 8-16, 1970-02
READ THESE TERMS AND CONDITIONS CAREFULLY BEFORE USING THIS WEBSITE. https://nrc-publications.canada.ca/eng/copyright
Vous avez des questions? Nous pouvons vous aider. Pour communiquer directement avec un auteur, consultez la première page de la revue dans laquelle son article a été publié afin de trouver ses coordonnées. Si vous n’arrivez pas à les repérer, communiquez avec nous à [email protected].
Questions? Contact the NRC Publications Archive team at
[email protected]. If you wish to email the authors directly, please see the first page of the publication for their contact information.
NRC Publications Archive
Archives des publications du CNRC
This publication could be one of several versions: author’s original, accepted manuscript or the publisher’s version. / La version de cette publication peut être l’une des suivantes : la version prépublication de l’auteur, la version acceptée du manuscrit ou la version de l’éditeur.
Access and use of this website and the material on it are subject to the Terms and Conditions set forth at
Frost heaving forces in leda clay
Penner, E.
https://publications-cnrc.canada.ca/fra/droits
L’accès à ce site Web et l’utilisation de son contenu sont assujettis aux conditions présentées dans le site LISEZ CES CONDITIONS ATTENTIVEMENT AVANT D’UTILISER CE SITE WEB.
NRC Publications Record / Notice d'Archives des publications de CNRC:
https://nrc-publications.canada.ca/eng/view/object/?id=f19a35b7-bd77-4cff-b26b-a9a58666f571 https://publications-cnrc.canada.ca/fra/voir/objet/?id=f19a35b7-bd77-4cff-b26b-a9a58666f571
Frost heaving forces in Leda CIayl
E. PENNERDivision of Building Research, National Research Council o f Cat~ada, Ottawa 7, Catlada
Received September 23, 1969
The frost heaving forces developed under a 1 ft (30.5 cm) diameter steel plate were mea- sured in the field throughout one winter. The steel plate was iixed at the ground surface with a rock-anchored reaction frame. Heave gauges and thermocouples were installed at various depths to determine the position and temperature of the active heaving zone.
The general trend was for the surface force to increase as the winter progressed. When the frostline approached maximum depth the force was in excess of 30 000 lb (13 608 kg). Estimates of the heaving pressure at the frostline ranged from 7 to 12 psi (0.49 to 0.84 kg/cm2) during this period.
The variation of surface heaving force was closely associated with weather conditions. Warm- ing trends resulting in a temperature increase of the frozen layer caused the forces to decline. Les forces de soulbvement dues au gel qui se sont produites sous une plaque d'acier de la pied (30.5 cm) de diambtre ont kt6 mesurees en nature durant un hiver. La plaque d'acier Btait fix& 21 la surface du sol ou moyen d'un cadre ancre au roc. Des jauges de soulbvernent et des thermocouples furent install& B differentes profondeurs pour determiner la position et la profondeur de la zone active de soulbvement.
En general, la force de soulbvement 2I la surface tendait B s'accroitre au cours de l'hiver. Lorsque la ligne de gel atteignit la profondeur maximum, la force de soulbvernent depassait 30 000 Ib (13 608 kg). Durant cette phiode, la pression de soulbvement au niveau de la ligne de gel a 6tB estimte 21 des valeurs comprises entre 7 et 10 p.s.i. (0.49 1 0.84 kg/cma).
La variation de la force de soulbvement 21 la surface a suivi de prbs les conditions climatiques. Durant les p a o d e s moins froides la temperature s'est &levee dans la zone de gel et les forces de soulbvement ont diminu6.
Introduction
An important engineering aspect of the frost action problem concerns the large forces that are sometimes associated with the heaving phe- nomenon in frost-susceptible soils. Each winter, frost heaving damage to permanent structures results in maintenance expenditures that could have been avoided by adequate consideration of the frost problem. In the case of temporary soil-bracing structures that are left exposed to freezing conditions, such forces must either be taken into consideration in the design or pre- vented by heated enclosures or insulation (McRostie and Schriever 1967; Pappas and Sexsmith 1968). In a recent paper, numerous examples are given of frost heaving that has displaced foundation units not adequately pro- tected during winter construction (Crawford
1968).
The field study described in this paper was undertaken to measure the heaving force de- veloped against a k e d plate at the ground surface and to estimate the heaving pressures (vertical stresses) developed at the frost line.
'NRCC 11131.
Canadian Geotechnical Journal, 7, 8 (1970)
A similar experiment, carried out previously in Japan (Kinosita 1967), was useful in planning the present study.
The need for these experiments arises be- cause it is still not possible to reliably predict heaving forces from soil properties, although some advances in this respect have been made recently. These results should give designers an appreciation for the magnitude of the forces that can be generated by frost heaving, and a decision can then be made whether to take them into account in design or to avoid such hazards by preventing the soil from freezing
(i.e., insulating or heating).
Heaving Forces and Ice Lensing Frost heaving in freezing soils is attributable mostly to the freezing of water that migrates to the freezing planeGnd freezes in the form of an ice lens. Ice lensing activity and the asso- ciated heave are thought to be greatest at the freezing plane, although in clays some water
-The freezing plane normally refers to the location which separates the unfrozen soil from the partially frozen soil.
PENNER: FROST I lEAVING FORCES 9
may move from the unfrozen soil into the frozen soil well beyond the freezing plane.
The water may originate from an outside source (high water table), or it may be sup- plied by decreasing the moisture content of the unfrozen soil; the actual situation may lie some- where in between. If the second alternative occurs, shrinkage may result in some soils. In such cases the total thickness of the ice lenses would be greater than the observed heaving at the ground surface.
It is well known that the ice-water ratio of so-called frozen soils is temperature dependent. Under normal climatic conditions in the field, the temperature of the frozen layer is lowered as the average daily air temperatures decrease. This results in an increase of the ice phase and a decrease of the water phase in the "frozen" layer, which also adds to the amount of heave observed. These aspects are noted here to draw attention to the complexity of the frozen soil system. It is thought, nonetheless, that the main cause of heaving pressures and frost- heave displacement is the formation of ice or ice lenses at the freezing plane.
The direction of displacement and heaving pressure is parallel to the direction of heat flow. For example, where the freezing plane progresses laterally in a vertical wall of an excavation, the movement induced by ice lens formation is also in the lateral direction. If the heat flow pattern can be anticipated for a par- ticular situation, the direction of heaving and the associated forces can be reliably predicted. On the other hand, the magnitude of the heaving pressures at the freezing plane cannot be reliably predicted for most natural soils, although the particle size distribution is a useful guide. Under similar conditions of temperature and moisture availability, the pressure de- veloped by ice lens growth is known to be related inversely to particle size. Pressures are low for fine sands, intermediate for silts, and high for clay soils.
Heaving pressures can be predicted from theory (Everett and Haynes 1965) for labora- tory prepared specimens of uniform-sized spherical particles with a given packing array. Such a prediction is not possible when the particle size varies, although recent studies (Pemer 1968) show that the smaller-sized fraction has a strong influence on the maximum
heaving pressures attainable. The theory of Everett and Haynes is based on the capillary ~henomena at the ice-water interface within
I
the porous medium. When most of the water is surface-adsorbed water, as might be the case in some clays, predictions are not possible on this basis. A further com~lication arises in the field due to lack of h&mogeneity along the freezing plane, caused by the natural structure of the soil. Ice may penetrate along fissures and channels instead of through the porous system, and much lower stresses would result. In the laboratory, maximum values are obtained when the soil is thoroughly mixed or remoulded to destroy the macrostructure, with the result that the frost line is held relatively stationary.
Methods and Materials
Reaction Frame for Force Measurernerzts
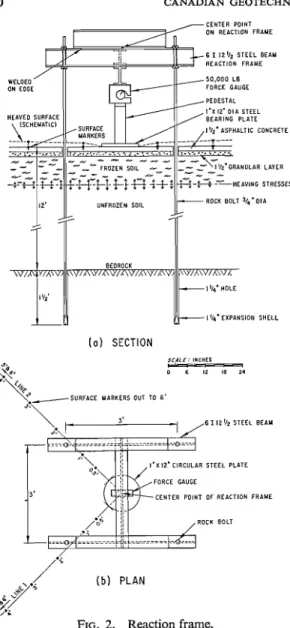
An H-shaped frame, consisting of twin 6 I 123 steel beams, was designed for the superstructure of the reaction frame (Figs. 1 and 2 ) . The frame was anchored to bedrock at the corners using in. (1.9 cm) rock bolts with 1% in. (3.2 cm) expansion shells. Competent limestone bedrock is located at a depth of about 12 ft (3.7 m) from the ground surface and the expansion shells were installed 18 in. (45.7 cm) below the bedrock surface. The reliability of the rock anchor assembly installations was tested sep- arately by applying a tension of 25 000 lb (11 340 kg) to the rock bolts for several hours.
A 50 000 Ib (22 680 kg) Dillon mechanical com- pression gauge was used for force measurements. It was covered with a plastic enclosure for protection from rain and snow. The surface plate, which was a 1 in. (2.54 cm) thick, 12 in. (30.5 cm) diameter circular steel plate, was welded to a 38 in. (8.89 cm) steel pipe. The force gauge was located between the pipe and the reaction frame. In order to position the surface plate correctly in contact with the thin
CANADIAN GEOTECHNICAL JOURNAL. VOL. 7, 1970 CENTER POINT OH REACTION FRAME 6 I 12'12 S T E E L BEAU REACTION F R A M E I ' X I 2 ' O I A STEEL BEARING PLATE 1%' ASPHALTIC CONCRETE UNFROZEN SOIL BEDROCK I llq' H O L E I l I ~ ' E X P A N S I O H S H E L L l a ) SECTION
\.
r 3( -1 6, I I 2 % STEEL E E P U ..\.ik
*a. X I 2 ' CIRCULAR S T E E L P L b T E . \ FORCE GAUGE 3' l!*!< CENTER POINT OF REACTION F R A M E
- .,-
/ (b) PLAN
.;k
,i"'
.
FIG. 2. Reaction frame.
asphaltic concrete layer, it was possible to adjust the frame levels at all four corners just prior to the onset of ground freezing. Two sets of surface markers were positioned radially at distances of +, 1, 2, 3, 4, 5, and 6 ft (0.15, 0.30, 0.60, 0.91, 1.26, 1.52, and 1.83 m ) out from the rim of the surface plate for heave measurements. The markers were 3 in. X -$ in. (7.62 x 0.95 cm) lag screws installed flush with the asphalt surface using an impact wrench.
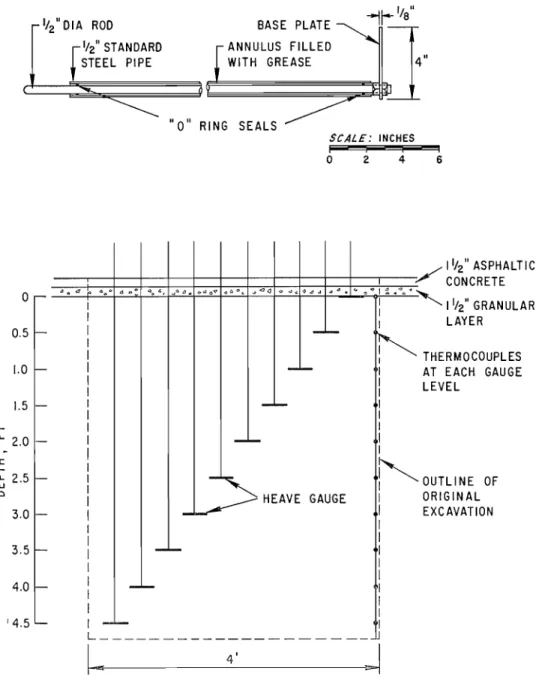
a depth of 4 t ft (1.37 m ) . The stainless steel base plate ( 4 x 4 X & in.) (10.2 x 10.2 x 0.32 cm) was attached to a 4 in. (1.27 cm) diameter steel rod. Adfreezing to the rod was avoided with a grease- filled protective steel pipe sleeve. The movement measured at the top of the rod was equal to the amount of heave at the base plates.
Twenty-gauge copper-constantan thermocouples at- tached to a wooden dowel were used to measure the soil temperatures at 3 ft (0.15 m ) intervals cor- responding to the depths of the heave location gauges. Eighteen inches (0.46 m ) of the thermo- couple cable was rolled around the dowel at each level to reduce errors due to conduction of heat along the cables to the thermocouple union.
The base plates of the heave gauges were driven into the walls of a narrow trench, which was back- filled with the excavated soil close to the original density. With this instrumentation it was possible to relate the zero degree isotherm position with the position of the active heaving zone as indicated by the heave gauges.
Soil and Site Conditions
The site is located on National Research Council of Canada property o n the Montreal Road near the eastern city limits of Ottawa. The natural grass sod was removed and replaced with a working surface consisting of a 13 in. (3.81 cm) layer of gravel and a 13 in. (3.81 cm) layer of asphaltic concrete. As is normal for this area, the ground water-table was near the ground surface before the first freeze occurred. The soil at the site is a post-glacial clay of marine origin (Crawford 1961). It is reasonably uniform with depth, and consists of 70% clay-sized and 30% silt-sized particles. The average moisture content in the autumn is about 44%.
Measurement Methods
Soil temperatures were measured daily at 0830 hours with a data acquisition system. Air temperature measurements were obtained from a meteorological station located a few hundred yards from the site. The Dillon force gauge was read daily at 0830 hrs. Occasional spot checks at other times of the day showed that the diurnal variation was small. A calibration check prior to installation showed the accuracy of the gauge to be better than 1% of the full range.
Level surveys, referenced to a stable bench mark, were carried out weekly to follow the progress of heaving for both surface and heave-position gauges. Level surveys were done also o n the center and corners of the reaction frame as a check o n its stability.
Heave Gauges and Temperature Measurements Results and Discussion
Heave and temperature measurements at various
depths were made at two locations on the snow- The average daily temperatures, the daily cleared site, at a distance of 18 and 30 ft (4.5 and force readings and the estimated frost penetra-
8.1 m ) from the reaction frame. The results given tion depth (0 O C ) are given in 4. ~h~~~ later in the paper are averages for the two locations.
The heave gauges (Fig. 3) were installed at 4 f t are shown together On the same graph (0.15 m ) intervals from the surface of the soil to SO that comparisons can be made easily. he
PENNER: FROST HEAVING FORCES
BASE PLATE '/2" STANDARD ANNULUS FILLED STEEL PIPE WITH GREASE
" 0 " RING SEALS
SCALE: INCHES
7
0 2 4 6
FIG. 3. Heave gauges and thermocouple locations. 0 0.5 1.0 1.5 I- 2.0 I I- n 2.5 w n 3.0 3.5 4.0
'
4.5maximum heave force measured with the 12 in. (30.5 cm) diameter surface plate was 30 000 lb (13 608 kg). It reached this value on 14 Feb- ruary 1969, after a period of prolonged cold weather and active heaving. Periods of moderat- ing weather reduced the force values; only when frost heaving was actively taking place did the total force increase. The center position on the frame moved 0.020 in. (0.05 cm) at maximum
-
-
THERMOCOUPLES - - - - OUTLINE OFEAVE GAUGE ORIGINAL
-
EXCAVATION-
-
-
force. This was fully recovered after the frame was unloaded (Fig. 4 ) .
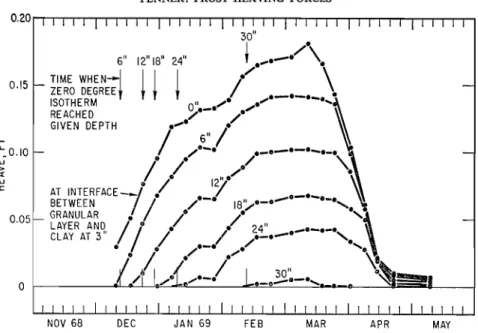
The vertical movement of the heave gauges are given in Fig. 5. These results show that the initial gauge movement corresponded closely to the time the 0 "C isotherm intercepted the gauge. The frost line position was determined daily, but heave movement readings were taken only once a week. Because of this, the exact
12 CANADIAN GEOTECHNICAL JOURNAL. VOL. 7, 1970
plate. The rate of heave calculated from the shaded portions on the graphs (heave between 3 to 10 February 1969) was used as one of the methods to estimate the vertical stress dis- tribution on the horizontal freezing plane. The particular time interval (shaded area) was selected because the surface heaving was ap- proaching a maximum (Fig. 4 ) , but the heave rate was still substantial under a slow rate of frost penetration.
Estimation of Average Surface Stress at Frost Line
The force measurements show a general in- crease as the winter progressed (Fig. 4). Varia- tions from this appear to be a gradual response to chanoin air temperatures and the resultant g
j, changes in ground temperatures. The force on
the surface plate is thought to reflect a balance
,,
between creep of the frozen soil under stress (Vialov 1965) and rate of heave. When the rate of creep exceeds the heave rate the force2 5 ,
measured at the surface reduces. A warming trend during the winter reduces the heave rate,
20: at the same time the rise in temperature of the
frozen layer causes the creep rate to increase. As would be expected, there is a time lag be- a tween the change in force and the associated
change in air temperatures.
lo
Figure 7 a gives the average surface stress on the plate as a function of frost depth. The trend
j is a general increase in surface stress with
depth of frost line, but responses to thermal conditions are also clearly evident.
O NOY 68 D E C 68 J A N 69 F E E 69 lllbi? 69 A P R 69 0
An attempt was made to estimate the vertical
FIG. 4. Temperature, force, and frost depth results. stress at the frost line by using the Boussinesq
elastic theory of stress distribution, taking into day when each gauge started moving is not account all the assumptions this implies, in-
known. cluding a uniform contact stress at the surface
The vertical distance between gauges re- plate. The results of the calculations are plotted mained almost constant after the frost line in Fig. 7 as a function of frost depth. The elas- passed their position. Slight increases in these tic modulus of the frozen layer, E,, and that of distances indicate some further lensing activity the unfrozen soil beneath, E,, are not known. within the "frozen" soil, but it can be con- Ef, which is probably temperature-dependent cluded that the main heaving activity was at because of the presence of ice and the fact that the freezing plane which corresponded closely the ratio of ice to water varies with tempera- with the 0 "C isotherm. ture, is greater than E,. Figure 70 presents the Figure 6 shows the results of the heave stress obtained assuming Ef = E,. The stress measurements along the two lines of surface obtained using Burmister's (1958) graphs for markers radiating out from the surface plate. E J E , equal to 5 and 10 is plotted in Figs. 7c The shape of the curves shows the manner in and 7d respectively. The tendency is for the which frost heaving was impeded near the load to spread and the stress at the freezing
1 1 1 1 1 1 1 1 1 1 1 1 1 1 1 1 1 1 1 1 1 1 1 1 1 1 1 1 1 1 1 1 1 1 1 1 1 1 1 1 1
NOV 68 DEC JAN 69 FEE MAR APR MAY
FIG. 5. Vertical heave and settlements at 6 in. (15 cm) depth intervals in the soil profile near reaction frame.
LlNE I __-cb I- U J _ 30 EEC 1968 - 0 0 m LL. 0 05 17 DEC 1968 __cCO - 0
i
e - a 0 I I I I I 1 2 DEC 1968 I I I I I I LlNE 2 (MAXIMUMI.
11 !dA8 '969-I
T
I0 FEB 1969 I 3 FEB7
30 DEC 1969 e -e -O /i
20 JAN l Y b Y I 17 DEC 1968 1 /@- /m O0- -7 0 I I I I I 1 2 DEC 19601
0 0.5 1 2 3 4 5 6DISTANCE FROM Rlhl OF PLATE, FT
CANADIAN GEOTECHNICAL JOURNAL. VOL. 7, 1970 5 0 19-24 DEC
-
3 0 V) V) k- 1 0 FROST D E P T H , F T ( I N C L U D E S 3 " ASPHALT Ei G R A V E L )FIG. 7. Average stress at surface and estimated stresses on centerline of plate at frost line. (f = frozen, u = un- frozen).
plane to decrease as the ratio increases. The stress at the freezing plane also tends to de- crease as the frost depth increases. These cal- culations show that the stress at the freezing plane is largest early in the season before the maximum heaving force has been developed. Values of the maximum in Figs. 7b to d range from 35 psi to 15 psi (2.46 kg/cm2 to 1.05 kg/cm2) (frost depth 0.75 ft (22.9 cm) ). Just prior to spring break up, when the total force
measured was highest (-30 000 lb (13 608 k g ) ) , the values range from 12 psi to 7 psi (0.84 to 0.49 kg/cm2). These field values are lower than might be expected for this type of soil from theory (Penner 1968).
Vertical Stress Distribzition on the Horizontal Plane at Frost Line
The dependence of frost heave at the surface on distance from the fixed plate (Fig. 6 ) pro-
PENNER: FROST HEAVING FORCES
6 5 4 3 2 I 0 I 2 3 4 5 6
DISTANCE, FT
I I I 1 I I I
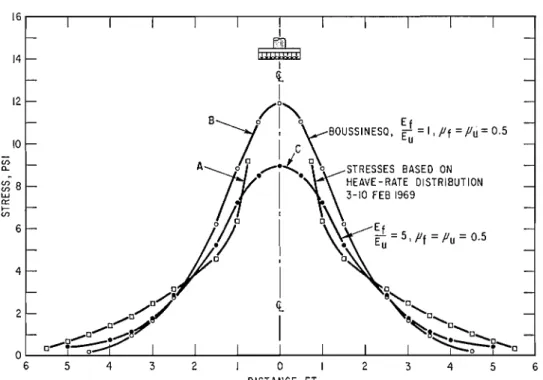
FIG. 8. Vertical stress distribution on horizontal plane at frozen-unfrozen interface (depth 2.75 ft, 0.836 m).
I I
vided a novel approach for assessing heaving pressures at the frost line. It is commonly known that the heaving rate of soil, as deter- mined in the laboratory, is inversely related to the pressure applied to the freezing plane. The results given by Linell and Kaplar ( 1959) for several soils conform to the following equa- tion:
[I] R = RoenP
where R o = heave rate at zero pressure a = constant for given soil type
(negative value) P = applied pressure R = heave rate at pressure P
The dependence of rate of heave on pressure at the freezing plane is not known for Leda clay; hence the value of "a" was taken from a similar soil that had been studied by L i e l l and Kaplar. The heave rate was calculated from the average of the movements of the two sets of surface markers as a function of distance from the plate for the period 3 to 10 February 1969 (shaded area in Fig. 6 ) when the force on the surface plate was near a maximum. Equation [I] was then used to calculate the pressure at the freezing plane. This is shown in Fig. 8
- - -
-
I-
F.-
--
-
-
-
--
-
STRESSES BASED ON HEAVE- RATE DISTRIBUTION 3-10 FEE 1969-
-
-
-
-
-
-
--
F. I I I Iplotted against distance from the plate (curve A). The value used for Ro, the heaving rate at zero pressure, was taken at a point some 7 ft (1.8 m ) away from the reaction frame not influenced by the fixed surface plate. The main assumption in this calculation is that the pres- sure at the freezing plane is related by Eq. [I] to the heaving rate observed at the surface of the ground directly above it.
Curve B in Fig. 8 is the Boussinesq vertical stress distribution on a horizontal plane at a depth of 2.75 ft (0.84 m ) , using the Newmark influence charts and Poisson's ratio of 0.5. Curve C was obtained by using Burmister's ( 1957) distribution when Ef/E,, the frozen- unfrozen elastic moduli ratio, is 5. The curves B and C are very similar except for the position directly below the center of the surface plate. This agreement indicates that at a depth of 2.75 ft (0.84 m) (5.5 X plate radius) the dif- ferences involved in applying incorrect elastic moduli ratios are relatively unimportant. The stress distribution calculated from heaving rates (curve A) tends to indicate a greater spreading of the surface force. Since the method depends on rate of heave, the stress on the center line of the fixed plate could not be evaluated.
16 CANADIAN GEOTECHNIC AL JOURNAL. VOL. 7, 1970 Conclusions
The results lead to the following conclusions: 1. The main heaving activity is thought to be mainly associated with the freezing plane-the interface between the frozen and unfrozen soil. The heaving activity within the frozen mass is shown by the results to be relatively small. 2. The maximum heaving force measured at the surface is unexpectedly high, although the estimates of the vertical stresses at the freezing plane (heaving pressure due to ice lens growth) are relatively small considering the texture of Leda clay. In natural Leda clay under field conditions, ice propagation probably occurs along fissures and channels; this would tend to reduce the heaving pressures that are pos- sible if ice propagation took place through all the pores of the soil.
3. Although the vertical stresses calculated are estimates, the agreement between the sev- eral methods used suggest they are of the right order.
4. The variation of the surface heaving force on a fixed plate is closely associated with weather conditions. Warming trends that in- crease the temperature of the frozen layer reduce the temperature gradients and hence the heaving rate, which results in a decline of the surface force.
5. The general trend is for the surface heaving
force to increase as the winter progresses and the frost depth increases. As the thickness of the frozen layer increases, the heaving pressure at the frost line decreases, but as the frost depth increases the surface heaving force increases. This is attributed to the increasing area of influence at the freezing plane.
Acknowledgments
The author wishes to thank his colleagues in the Geotechnical Section and in particular K. N. Burn and D. Eldred for assistance, com- ments, and criticism.
This paper is a contribution from the Divi- sion of Building Research, National Research Council of Canada, and is published with the approval of the Director of the Division.
BURMISTER, D. M. 1958. Evaluation of pavement systems of the WASH0 road test. Highway Res. Bd. Bull. 177, pp. 26-54.
CRAWFORD, C. B. 1961. Engineering studies of Leda clay soils in Canada. Roy. Soc. Can. Spec. Publ. No. 3, Univ. Toronto Press (revised edition 1965), pp. 200-217.
1968. Frost action-construction hazard. Eng. Contract Record, 81 ( I ) , pp. 51-57. EVERETT, D. H. and HAYNES, J. M. 1965. Capillary
properties of some model pore systems with reference to frost damage. R6union Internationale des Laboratoires dlEssais et de Recherches sur les Mat6reaux et les Constructions, Bull., New Series 27, pp. 31-38.
KINOSITA, S. 1967. Heaving force of frozen soils. Proc. Intern. Conf. on Low Temperature Science, 1 (2), pp. 1345-1360.
LMELL, I<. A. and KAPLAR, C. W. 1959. The factor of soil and material type in frost action. High- way Res. Bd. Bull. No. 225, pp. 81-125.
MCROSTIE, G. C. and SCHRIEVER, W. R. 1967. Frost pressures in the tie-back svstem at the National Arts Centre excavation. ~ nJ., ~50 . (3), pp. 17-21.
PAPPAS, N. D. and SEXSMITH, D. P. 1968. Per- formance monitoring of a deep cofferdam in sensitive clay. Can. Geotech. J., 5, pp. 80-94. PENNER, E. 1968. Particle size as a basis for pre-
dicting frost action in soils. Soils and Founda- tions, 8 (4), pp. 21-29.
VIALOV, S. S. 1965. The strength and creep of frozen soils and calculations for ice-soil retaining struc- tures. Acad. Science USSR, 1962, Cold Regions Res. Eng. Lat. (Hanover, N.H.) Translation No. 76.