HAL Id: hal-03117590
https://hal.inrae.fr/hal-03117590
Submitted on 21 Jan 2021
HAL is a multi-disciplinary open access
archive for the deposit and dissemination of
sci-entific research documents, whether they are
pub-lished or not. The documents may come from
teaching and research institutions in France or
abroad, or from public or private research centers.
L’archive ouverte pluridisciplinaire HAL, est
destinée au dépôt et à la diffusion de documents
scientifiques de niveau recherche, publiés ou non,
émanant des établissements d’enseignement et de
recherche français ou étrangers, des laboratoires
publics ou privés.
Distributed under a Creative Commons Attribution| 4.0 International License
saccharification behaviors
Cécile Barron, Marie-Francoise Devaux, Loic Foucat, Xavier Falourd, Rachelle
Looten, Maud Joseph-Aime, Sylvie Durand, Estelle Bonnin, Catherine
Lapierre, Luc Saulnier, et al.
To cite this version:
Cécile Barron, Marie-Francoise Devaux, Loic Foucat, Xavier Falourd, Rachelle Looten, et al..
En-zymatic degradation of maize shoots: monitoring of chemical and physical changes reveals different
saccharification behaviors. Biotechnology for Biofuels, BioMed Central, 2021, 14 (1),
�10.1186/s13068-020-01854-1�. �hal-03117590�
RESEARCH
Enzymatic degradation of maize shoots:
monitoring of chemical and physical changes
reveals different saccharification behaviors
Cécile Barron
1, Marie‑Françoise Devaux
2, Loïc Foucat
2,3, Xavier Falourd
2,3, Rachelle Looten
2,
Maud Joseph‑Aime
2, Sylvie Durand
2, Estelle Bonnin
2, Catherine Lapierre
4, Luc Saulnier
2, Xavier Rouau
1and Fabienne Guillon
2*Abstract
Background: The recalcitrance of lignocellulosics to enzymatic saccharification has been related to many factors, including the tissue and molecular heterogeneity of the plant particles. The role of tissue heterogeneity generally assessed from plant sections is not easy to study on a large scale. In the present work, dry fractionation of ground maize shoot was performed to obtain particle fractions enriched in a specific tissue. The degradation profiles of the fractions were compared considering physical changes in addition to chemical conversion.
Results: Coarse, medium and fine fractions were produced using a dry process followed by an electrostatic separa‑ tion. The physical and chemical characteristics of the fractions varied, suggesting enrichment in tissue from leaves, pith or rind. The fractions were subjected to enzymatic hydrolysis in a torus reactor designed for real‑time monitoring of the number and size of the particles. Saccharification efficiency was monitored by analyzing the sugar release at different times. The lowest and highest saccharification yields were measured in the coarse and fine fractions, respec‑ tively, and these yields paralleled the reduction in the size and number of particles. The behavior of the positively‑ and negatively‑charged particles of medium‑size fractions was contrasted. Although the amount of sugar release was similar, the changes in particle size and number differed during enzymatic degradation. The reduction in the number of particles proceeded faster than that of particle size, suggesting that degradable particles were degraded to the point of disappearance with no significant erosion or fragmentation. Considering all fractions, the saccharification yield was positively correlated with the amount of water associated with [5–15 nm] pore size range at 67% moisture content while the reduction in the number of particles was inversely correlated with the amount of lignin.
Conclusion: Real‑time monitoring of sugar release and changes in the number and size of the particles clearly evidenced different degradation patterns for fractions of maize shoot that could be related to tissue heterogeneity in the plant. The biorefinery process could benefit from the addition of a sorting stage to optimise the flow of biomass materials and take better advantage of the heterogeneity of the biomass.
Keywords: Lignocellulosic, Plant dry fractionation, Recalcitrance, Particles size, Image analysis, Time‑lapse study, Porosity, Biomass saccharification
© The Author(s) 2021. This article is licensed under a Creative Commons Attribution 4.0 International License, which permits use, sharing, adaptation, distribution and reproduction in any medium or format, as long as you give appropriate credit to the original author(s) and the source, provide a link to the Creative Commons licence, and indicate if changes were made. The images or other third party material in this article are included in the article’s Creative Commons licence, unless indicated otherwise in a credit line to the material. If material is not included in the article’s Creative Commons licence and your intended use is not permitted by statutory regulation or exceeds the permitted use, you will need to obtain permission directly from the copyright holder. To view a copy of this licence, visit http://creat iveco mmons .org/licen ses/by/4.0/. The Creative Commons Public Domain Dedication waiver (http://creat iveco mmons .org/publi cdoma in/ zero/1.0/) applies to the data made available in this article, unless otherwise stated in a credit line to the data.
Background
The development of a plant biorefinery for the treatment of lignocellulosic biomass to produce biomolecules, bio-energy and biomaterials in substitution to fossil carbon
Open Access
*Correspondence: fabienne.guillon@inrae.fr
2 INRAE, UR BIA, 44316 Nantes, France
is a major challenge today [1]. The biological conversion of cell wall polysaccharides is more attractive than other types of industrial conversion [2] because it offers the possibility to produce specific products with low energy input in an ecofriendly environment. However, with no pretreatment, the conversion yield is low. Many factors are responsible for the recalcitrance linked to both bio-mass and enzymes [3]. Lignin content is the main compo-nent involved in recalcitrance [4, 5]. Other compocompo-nents more specific to grass cell walls, p-coumaric acid (CA) and ferulic acid (FA), have been widely investigated in the context of the saccharification performance of grass lignocellulosics [6–9]. Hemicelluloses, and to a lesser extent pectins, are thought to limit cellulose accessibility thereby hindering efficient enzymatic hydrolysis [10–13]. On the contrary, it has been also suggested that hemicel-luloses through their substituents could affect positively the biomass enzymatic digestibility by reducing cellu-lose crystallinity [14–16]. Cellucellu-lose structure, especially crystallinity, has been also linked to saccharification but results have been conflicting [17, 18] or reported little or no effect [19, 20]. At the scale of polymers, the degree of polymerization of the cellulose [14, 21–23], presence of acetyl groups [24] as well as the occurrence of sugar sub-stituents can also limit enzymatic hydrolysis by prevent-ing enzymes from accessprevent-ing glycosidic linkages reviewed by [25]. Many pretreatments before the saccharification step aim to reduce the detrimental impact of these com-ponents [12, 14, 26–32].
In addition to the influence of the chemical composi-tion of the biomass and of the chemical structure of the constituent polymers, the role of particle size and poros-ity that determine the surface accessible to enzymes has already been investigated [14, 19, 33–36]. Conflicting effects of a decrease in particle size on the conversion rates have been reported depending on the substrate, the resulting particle size range or the percentage of fine par-ticles [34, 37]. Several authors, using either solute exclu-sion [19, 36, 38–40] or Simons’ staining [14, 20, 41, 42] techniques, reported positive relationships between the internal surface area or pore surface accessible to cel-lulase and cellulose enzymatic hydrolysis yield and rate. Several methods to investigate the biomass-water inter-action have been implemented to explain the recalci-trance phenomenon, including water retention value and time-domain low field NMR (LF-NMR). Water reten-tion measures the capacity of the biomass to retain water against a centrifugal force. It has been used as an indirect measure of cell wall properties including overall hydro-philicity and porosity [43, 44] and has been shown to be correlated with saccharification yield [35, 45–47]. LF-NMR relaxometry provides more detailed information on the physical and chemical environment of water in the
biomass [33, 35, 45, 47–49]. This approach revealed that the presence of constrained water favored hydrolysis [45, 49].
To summarize, no real consensus has been reached on the most important causal factors aside from cel-lulose accessibility and the detrimental role of lignin content. The heterogeneity of the tissues forming the lig-nocellulosic biomass is also known to cause differences in saccharification patterns [50]. Several authors have investigated the behavior of different cell types in enzy-matic degradation through imaging [8, 51–53] and tissue extraction [54–56]. They demonstrated differences in tis-sue susceptibility that varied with the nature of the cell walls. Lignocellulosic particles subjected to saccharifi-cation originate from different tissues. Anatomical con-stituents or even tissues could be obtained through dry fractionation [57, 58], which combines grinding and sep-aration processes. Powder enriched in specific anatomi-cal parts of plant is affordable and the initial complexity in bulk samples due to the plant heterogeneity could thus be reduced.
In the present work, it is proposed to separate biomass particles into fractions that differ in their physical state and composition and analysed separately their sacchari-fication pattern. By this way, we aimed at a better under-standing of the phenomena of recalcitrance. Maize was chosen as a feedstock since it has several characteristics that are suitable for bioconversion. It is mainly grown for the grain so the stalk biomass can be used for bio-fuel production. Dry fractionation was applied to obtain the fractions [59]. In addition to the chemical composi-tion of the unfraccomposi-tionated maize shoot and derived frac-tions, the present work focused on the physical–chemical properties of particles: original particle size distribution, specific surface area, and porosity. NMR techniques were used to evaluate particle porosity, cellulose acces-sibility and biomass-water interactions at different water contents [45, 48]. A torus reactor prototype designed for image acquisition during the reactions was used for the real-time monitoring of the size and number of particles to identify the effect of physical changes in the particles resulting from the release of sugars during deg-radation. We hypothesized that measuring both physical and biochemical parameters in contrasting populations of particles would help decipher the mechanisms of the enzymatic reaction.
Results and discussion
Differences in particle reactivity during saccharification assays of maize shoot powder
First a saccharification assay of the unfractionated maize shoot powder (M) was carried out using the torus reac-tor Cinereac-tore to analyze the saccharification yield coupled
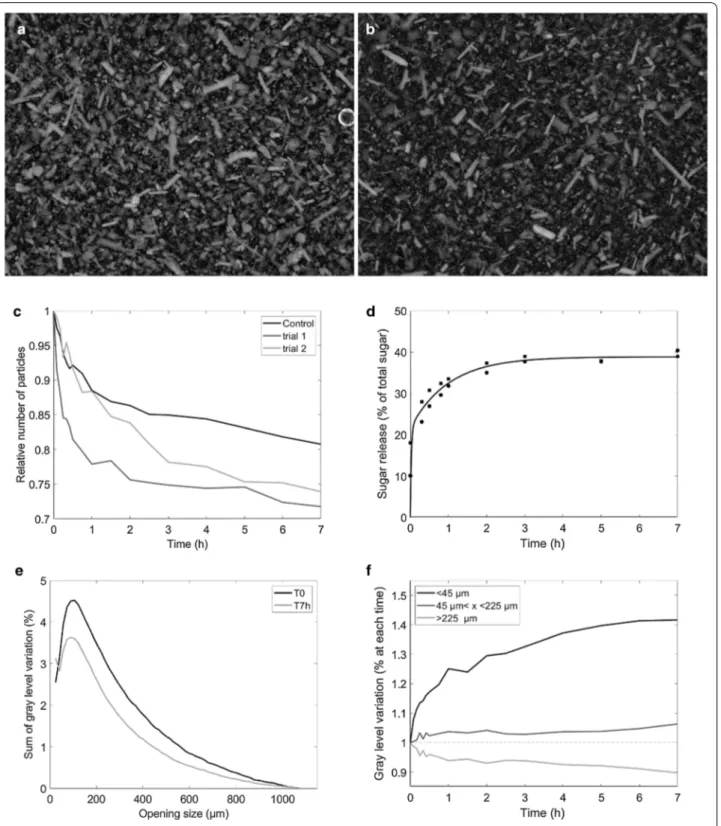
with real-time monitoring of changes in the number and size of the particles through image analysis. Before deg-radation, the maize shoot powder was made of particles of different sizes and shapes (Fig. 1a), including long rod-shaped particles. The longest particles were as long as 1,500 µm, (measured by hand).
In the control experiment, the stirring into the reactor caused the disappearance of 19% of the particles and the release of 2.1% of total sugars. This result suggests that some particles were broken down by the mechanical action of the screw and/or the water. After seven hours of saccharification, the number of particles observed was lower (Fig. 1b). Changes in the total sum of gray levels relative to time T0 were computed (Fig. 1c) to account for the number of particles in the reactor during sac-charification. The number of particles rapidly decreased to about 75% after one hour. After 7 hours, 26–28% of the particles disappeared. In parallel, the amount of sugars released was evaluated from the hydrolysates (Fig. 1d). The percentage of disappearance rapidly increased at first and then stabilized at 36–37% after 2 hours. This result is consistent with results obtained in non-pretreated maize [44]. Clearly, some particles were recalcitrant to enzymatic hydrolysis while others disappeared or were modified.
Changes in particle size during the reaction were also studied. Figure 1e shows the granulometric curves at times T0 and 7 h. The granulometric curves normalized relative to time T0 showed variations both in the num-ber of particles and in the decrease in size. A mode was observed at 90 µm for time T0 and 75 µm for time 7 h. Three size classes were built from these granulometric curves: [0–45 µm], [45–225 µm], [> 225 µm]. The three classes represented, respectively, 6%, 44% and 50% of the original sample at T0, and 8%, 47% and 45% of the sample after 7 h of hydrolysis. Changes in the number of particles in each class were evaluated after normaliza-tion relative to their original number (Fig. 1f). A strong relative increase in small particles from 1 to 1.40 and a slight relative increase in medium particles from 1 to 1.06 were observed. In parallel, the number of large particles decreased slightly from 1 to 0.90.
Three interpretations are possible. The first, a certain proportion of large, medium, and small particles were fully degraded while others were recalcitrant. The full degradation for most of the particles can be ruled out as most of the tissues in maize shoot are lignified [60, 61]. The second, some medium and large particles were degraded and broke into many small particles thereby increasing the relative proportion of small particles. The third, medium and large particles may be partly eroded during degradation or broken down into medium size particles. Whatever the size, some particles were
recalcitrant as small, medium, and long particles were still present after seven hours of degradation. To better understand this heterogeneous behavior, maize shoot powder was sub-fractioned to isolate fractions that were expected to be more homogeneous according to the sac-charification process.
Exploring variability of maize shoot powder
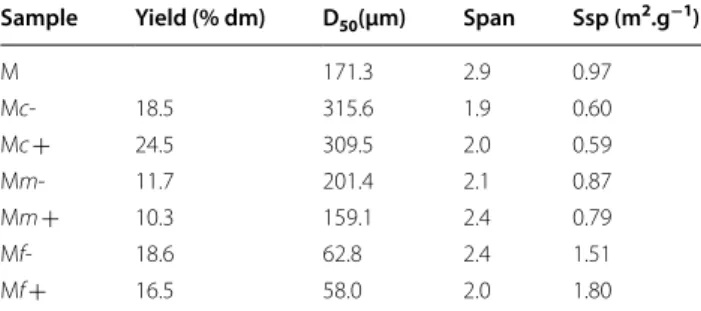
The enzymatic hydrolysis of each particle might be linked to the origin of the tissue in the maize shoot. To explore this hypothesis, dry fractionation was carried out to try to obtain fractions with specific tissue enrichment from leaves, pith, or rind. The particle size obtained in the frac-tions is not only the result of the efficiency of the grinder but is also due to interactions between plant structures and mechanical loading modes developed in the grinder [59]. The particle size could thus reflect differences in grinding ability in relation to the mechanical proper-ties of the tissues. On this basis, we chose a separation process mainly based on particle size characteristics [62, 63]. Air classification enabled the separation of the original maize shoot powder into three fractions (fine, medium, and coarse). A subsequent step was undertaken to take advantage of differences in particle composition [64]. Electrostatic separation, based on tribocharging, which is an interface phenomenon that depends on sur-face composition [65], was then used to separate each fraction into two more fractions, giving a final total of six fractions (Fig. 2). The coarse, medium, and fine frac-tions accounted for, respectively, 43%, 22% and 35% of the weight of the original sample (Table 1). Their median particle sizes (D50) were 310–315 µm, 159–201 µm, and
58–63 µm, for the coarse, medium, and fine fractions, respectively (Table 1). Size dispersion was still observed within each fraction but was less than in the unfraction-ated maize shoot sample, as shown by the narrower range of span values. Electrostatic separation led to no fur-ther substantial separation according to particle size, as shown by optical observations (Fig. 2) and by laser gran-ulometry (Table 1). The median particle size of samples recovered on the negative electrode side (coded “−”) was slightly higher than on the positive ones (coded “ + ”), in the coarse, medium, and fine fractions. As expected, the reduction in particle size was consistent with an increase in a specific surface area measured by physisorption (Table 1). Moreover, the hue of the particles separated by electrostatic separation also differed from the negative fractions with more brownish hues than in the positive fractions.
The chemical composition of each fraction was assessed by focusing on the analysis of the main cell wall components (polysaccharides, lignins, ester-linked p-coumaric acid and ferulic acid) that are known to be
Fig. 1 Saccharification of maize powder in the torus reactor Cinetore. a Picture of the original sample b Picture of the sample after 7 h of
saccharification. Field of view: 10 × 13.3 mm2. c Changes in the relative number of particles measured as the sum of gray levels relative to time T0 in
the control experiment and two enzymatic degradation trials. d Percentage of sugar released according to hydrolysis time. e Granulometric curves of the original sample and after 7 h saccharification. M–T0: time T0 normalized to 1, M–T7 h: time 7 h normalized to 1, M–7 h norm T0: time 7 h normalized relative to the amount of particles at time T0. f ) Changes in the three classes of particles relative to their original number
involved in enzymatic sensitivity (Table 2). If the total amount of sugars remained relatively stable between the fractions (about 66.7% ± 1.2%), the relative propor-tion of neutral sugars associated with hemicellulose (arabinose, xylose) was much more variable (relative standard deviation ranged from 8–15%). No major dif-ferences in glucose concentrations were observed. Cel-lulose crystallinity, determined in CP-MAS solid-state NMR experiments, was around 25% and no significant difference between fractions was observed. This CrI
value is within the range of values determined by the NMR method for corn stover reported by [66]. Lignin content, measured using the Klason method, varied sig-nificantly from 14.52 to 19.56% in the fractions of cell wall material. Lignin structure was studied by thioac-idolysis that estimates the monomer amount of guaia-cyl (G), syringyl (S) and p-hydroxyphenyl (H) involved in β-O-4 bonds. The thioacidolysis yield ranged from 720 to 999 µmol.g−1 KL, suggesting different degrees
of lignin condensation in the maize fractions. The S/G
ratio of thioacidolysis monomers ranged from 0.9 to 1.42.
Major differences in composition were observed depending on the particle size of the fractions and opposed fine and coarse fractions. The coarse fractions, which could be seen as the most difficult to grind, showed higher concentrations of xylose and Klason lignin and also differences in lignin structure as evidenced by the lower S/G ratio. Lower concentrations of protein, galac-tose and uronic acid were also observed in the coarse fractions compared to the fine ones. Differences accord-ing to the electrostatic separation were also observed: the positively deviated samples (‘ + ’) had more acetyl groups, ester-linked p-coumaric and ferulic acid, and higher thio-acidolysis yields, but lower ash content. Smaller differ-ences were observed between the two coarse fractions compared to between the fine and medium fractions, in particular ash and phenolic acid contents. Electrostatic separation, which is based on surface properties, might be less efficient for bigger particles whose specific surface area is lower [59].
Likewise, particle size fractions isolated from the maize shoot powder differed in chemical composition,
supporting the hypothesis that they are enriched in specific tissues. The higher concentrations of galactose and uronic acids in the finest fractions, associated with lower lignin content, suggest enrichment in pith from the stem [60, 61]. However, the higher amount of ash, also expected in this case [67], was not observed in this sample set. Leaves were also expected to be more pre-sent in the finest fractions [63]. In Poaceae, compared to the stem, leaves are characterized by less xylose and more protein, like in sorghum [68], more ash [69, 70], a lower S/G ratio, like in sugarcane, and less ester-linked p-coumaric [70]. More leaves in the fine fraction can be assumed from lower xylose or higher protein amounts. The fine fractions were found to be the richest in lignin syringyl units (%S > 55%), despite their lower lignin con-tent. This observation suggests that these fractions are enriched in leaf blade sclerenchyma, a tissue repeatedly shown to contain lignins rich in S units [50, 71]. In nega-tively deviated fractions (‘−‘), an enrichment in ash was observed combined with a brownish hue (Fig. 2). This could reflect more leaves, even if protein enrichment was not that high. Nevertheless, based on our compositional analysis, we propose the following interpretation: coarse fractions could originate from the stem rind, while the fine fractions could be enriched in pith and leaves. The enrichment in leaves may also differ according to the electrostatic separation, with more leaves in the Mf- frac-tion. Medium fractions could contain tissues from both origins, again with more leaves in the Mm- fraction.
Degradation kinetics by imaging and chemical analyses: Cinetore experiments
The parallel release of sugar and changes in the num-ber and size of the particles during saccharification were analyzed in Cinetore experiments. The coarse fraction considered corresponded to the whole Mc
Table 1 Yield of maize shoot fractions and physical characteristics of maize shoot powder and its fractions
D50 median particle diameter, span (D90-D10)/D50, Ssp specific surface area
Sample Yield (% dm) D50(µm) Span Ssp (m2.g−1)
M 171.3 2.9 0.97 Mc‑ 18.5 315.6 1.9 0.60 Mc + 24.5 309.5 2.0 0.59 Mm‑ 11.7 201.4 2.1 0.87 Mm + 10.3 159.1 2.4 0.79 Mf‑ 18.6 62.8 2.4 1.51 Mf + 16.5 58.0 2.0 1.80
Table 2 Chemical composition of maize shoot powder and its fractions
Ara arabinose, Xyl xylose, Glc glucose, Gal galactose, Klason lignin: expressed according to the dry matter of the extractive free material, Thio yield: expressed
according to the amount of klason lignin (KL), CA ester-linked p-coumaric acid, FA ester-linked ferulic acid, dm dry matter
Sample Sugars (% dm) Ash Proteins Acetyl Lignin CA FA Total Ara Xyl Glc Gal Uronic acids (%dm) (% dm) (% dm) Klason
Lignin (% dm) Thio yield (µmol.g−1 KL) S/G (mg.g−1 dm) (mg.g−1 dm) M 66.3 2.8 20.6 38.1 1.0 3.4 3.58 3.48 4.74 18.50 777.5 1.04 17.24 6.19 Mc‑ 67.2 2.7 22.1 38.0 0.8 3.2 2.61 2.17 3.75 19.01 823.5 0.92 19.00 6.79 Mc + 68.2 2.5 22.4 39.0 0.8 3.2 2.10 2.20 5.05 19.56 999.0 1.00 20.41 6.79 Mm‑ 67.6 3.4 22.3 37.1 1.1 3.3 4.01 2.42 3.98 14.79 748.5 0.90 12.54 5.19 Mm + 65.7 2.6 20.1 38.4 0.9 3.2 2.42 4.41 4.25 16.58 828.5 1.08 15.87 6.03 Mf‑ 67.3 3.6 19.8 37.6 1.4 4.3 3.38 3.70 4.06 15.43 720.5 1.28 15.37 5.70 Mf + 64.7 2.9 17.9 37.9 1.1 4.3 1.85 4.56 4.84 14.52 918.5 1.42 20.28 6.49
fraction (obtained before electrostatic separation) as the compositions of the two fractions Mc- and Mc + were close.
Fractions at time T0
Examples of images at time T0 are given in Fig. 3 for the five fractions. Although the same mass of ticles was loaded in the reactor, the images of par-ticles differed considerably. At T0, parpar-ticles in Mc were mainly elongated with variable thickness and length. As expected, particles in the medium fractions (Mm + or Mm-) were clearly more numerous and dif-fered in shape: thin and elongated to almost isotropic and cuboid shapes. In the raw images (see Additional file 1), particles in the fine fractions (Mf + or Mf-) were so numerous that they could hardly be distinguished. Considering the D50 measured by laser granulometry
(60 µm) and the pixel size (8.2 µm), only a few pixels are required to observe one particle and their overlap-ping led to a low contrast between background and particles. The bright background attested to the high density of particles and to particles smaller than the pixel size. After subtracting the background (Fig. 3), many isotropic particles were observed together with small pointed particles and a few elongated particles. For these fine fractions, the estimation of the relative number of particles from the total gray levels would be underestimated and should be considered relative to the number of particles larger than 8.2 µm.
For the fine fraction, the mode was found at 55–75 µm while it was 90–125 µm and 155–205 µm for the medium and coarse fractions, respectively. The mode corresponded to the D50 (Table 1) in the case
of the fine fractions and was lower for the other frac-tions. It should be noted that particle size evaluated by image analysis is more sensitive to the smaller dimen-sions of the particles [72], i.e. the width rather than the length, compared to laser granulometry. In addition, the variations in gray level observed for large sizes in the case of fine fractions were caused by the overlap-ping of the numerous particles. To a lesser extent, vari-ations in the gray level were observed for small sizes in the medium and coarse particles, which actually cor-responded to irregularities in their contour.
Changes in the number and size of particles during saccharification
After seven hours of saccharification (Fig. 3), particles could still be seen in the images, regardless of the fraction concerned. Fewer particles were observed in the coarse fraction Mc, and the contrast was lower. In the fine frac-tions, the contrast was lower after seven hours compared to T0 and fewer particles could be distinguished. A decrease in the number of particles was also visible in the medium fractions. Considering the gray level granulometric curves normalized with respect to time T0, the lower intensity of the curves clearly confirmed the decrease in the number of particles in all the fractions, with the biggest decrease in the fine (Mf-, Mf +) and Mm- fractions. In the fine fractions, a decrease in particle size was evidenced with an absolute increase in the number of particles smaller than 25 µm, whereas a moderate decrease in particle size was observed in the coarse and medium fractions.
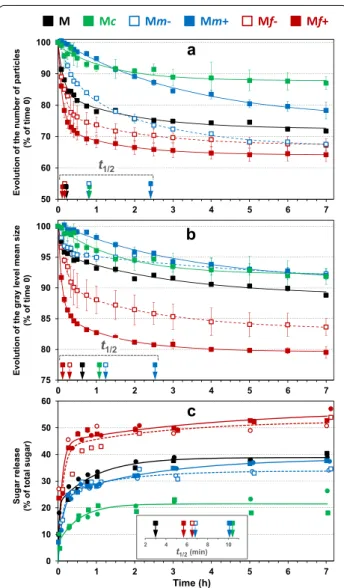
To investigate physical changes in the particles depend-ing on the period of saccharification in more detail, the number of particles was deduced from the total amount of gray levels, and mean particle size was estimated from the gray level mean sizes (Fig. 4a, b, respectively). The results obtained for the unfractionated maize shoot sample were plotted together with those of the fractions to highlight the saccharification differences after fractionation. In all the fractions except Mc, the decrease in the number of parti-cles was always greater than the decrease in particle size. The kinetics were analyzed through the time needed to obtain a 50% reduction in the number of particles or in their size (t1/2): in most cases the reduction in the number
of particles took place more quickly than the reduction in particle size.
The least change in the number and size of particles was observed in the coarse fraction Mc. The total decrease in gray levels between images after seven hours of degrada-tion was 12% and the gray level mean size decreased by 8%. The size and number of particles decreased with quite sim-ilar t1/2 (t1/2 = 1.08 h and 0.82 h, respectively).
Conversely, the fine fractions (Mf + and Mf-) were the most impacted during saccharification: after 7 h, the total decrease of gray levels was 36% and 32% in Mf + and Mf, respectively, and the gray level mean size also decreased by 20% and 17% in Mf + and Mf-, respec-tively. For the sake of comparison, the decrease in the total gray level in the control experiments was 28% and
(See figure on next page.)
Fig. 3 Cinetore analysis. Examples of image at times 0 and 7 h for maize shoot fractions: from top to bottom: Mf + , Mf‑, Mm + , Mm‑ and Mc. Field
of view: 10.0 × 13.3 mm2. Brightness and contrast were set at 60 and ‑40 for the fine fractions and to 40 and ‑40, respectively, for the three other
fractions. Granulometric curves of the original sample and after 7 h saccharification. T0: time T0 normalized to 1, T7h: time 7 h normalized relative to the number of particles at time T0
18% in Mf + and Mf-, respectively. Particle disappear-ance was clearly enhdisappear-anced by enzymatic hydrolysis. The size and number of particles varied consistently with a rapid and important decrease occurring in the first 15 min. These two phenomena were observed follow-ing similar kinetics in the Mf + fraction, whereas in the Mf- fraction, the decrease in particle size was slightly slower (t1/2 = 19 min) than the decrease in the number
of particles (t1/2 = 10 min).
Different patterns were observed in the medium frac-tions. In Mm- samples, after seven hours of saccharifi-cation, almost no significant change in particle size (9%) was observed, while the number of particles decreased by about 34%. Mechanical stirring alone could not explain such a discrepancy as the gray level decrease in control experiments was only 4%. This result suggests that sac-charified particles were fully dissolved in the aqueous medium with no noticeable particle erosion or break-ing. The reduction in the total number of particles was similar to that obtained in the fine fractions but was less rapid (t1/2 = 49 min for Mm- compared to t1/2 = 10 min
and t1/2 = 7 min for Mf- and Mf + , respectively). This
could suggest similar tissue composition but differ-ences in surface accessibility (in relation to particle size) between Mm- and fine particles. In the Mm + sample, the particle size reduction was also very small (10%) but the reduction in the number of particles was also smaller (20–24%). Particle changes in Mm + were the slowest observed in these fractions, as indicated by the higher values of t1/2 (around 2.5 h). The reduction in both the
number and size of the particles was moderate, even less than in the coarse fractions during the first 90 min.
Differences in the physical change pattern were next observed according to particle size. Fine particles were the most impacted, regardless of the criteria used (num-ber of particles or size), the coarse ones the least. Con-cerning the disappearance of particles, the medium fractions were between the two but concerning the decrease in particle size, their behavior was closer to that of the coarse fraction.
Sugar release during saccharification.
After seven hours of hydrolysis, sugar release was 22%, 34%, 38%, 52% and 55% in Mc, Mm-, Mm + , Mf-and Mf + , respectively (Fig. 4c). The sugar release for the unfractionated maize shoot sample (M) was plotted together with those of the fractions to highlight the sac-charification differences after fractionation. The main differences were observed according to the overall par-ticle size of the fraction, with coarse, medium, and fine fractions ranked according to increasing hydrolysis yield. Concerning electrostatic separation, the medium and fine fractions obtained at the positive electrode were slightly more degraded than those recovered at the nega-tive electrode.
Concerning kinetics, the saccharification of fine frac-tions was the most rapid as shown by the lowest t1/2
(around 6 min), while the coarse fraction had the high-est t1/2 value (10.4 min). It could be noticed that the
sac-charification of the unfractionated maize stover was also rapid. As suggested by Mansfield et al. [73], the smallest size fractions were hydrolyzed preferentially during the Time (h)
M Mc Mm- Mm+ Mf- Mf+
Evolution
of the gray
level mean size
(%
of
time 0)
Evolution
of the number of particle
s (% of time 0) 75 80 85 90 95 100 0 1 2 3 4 5 6 7 50 60 70 80 90 100 0 1 2 3 4 5 6 7 0 10 20 30 40 50 60 0 1 2 3 4 5 6 7
c
b
a
t1/2 t1/2 Time (h) Sugar release (% of total sugar) 2 4 6 8 10 t1/2(min)Fig. 4 Kinetics of saccharification of maize shoot fractions (Mc,
Mm + , Mm‑, Mf + and Mf‑), in the reactor CINETORE. a Changes in the number of particles, b Changes in the mean particle size, c Sugar release (% of total sugars). For the evolution of particle size and quantity, the curves resulted from the two repetitions were averaged (mean values with standard error). For the sugar release, the two repetitions for each fraction were shown and differentiated by their symbols in the graph. The kinetics for the unfractionated maize shoot sample (M) were also plotted to highlight differences of saccharification after fractionation
first stage of the hydrolysis reaction. Contrasted kinetic values were observed for medium fractions: sacchari-fication of Mm + was as slow as in the coarse fraction (t1/2 = 10.1 min) whereas Mm- behaved like the fine
frac-tion Mf-.
Coupled physical and chemical changes during saccharification
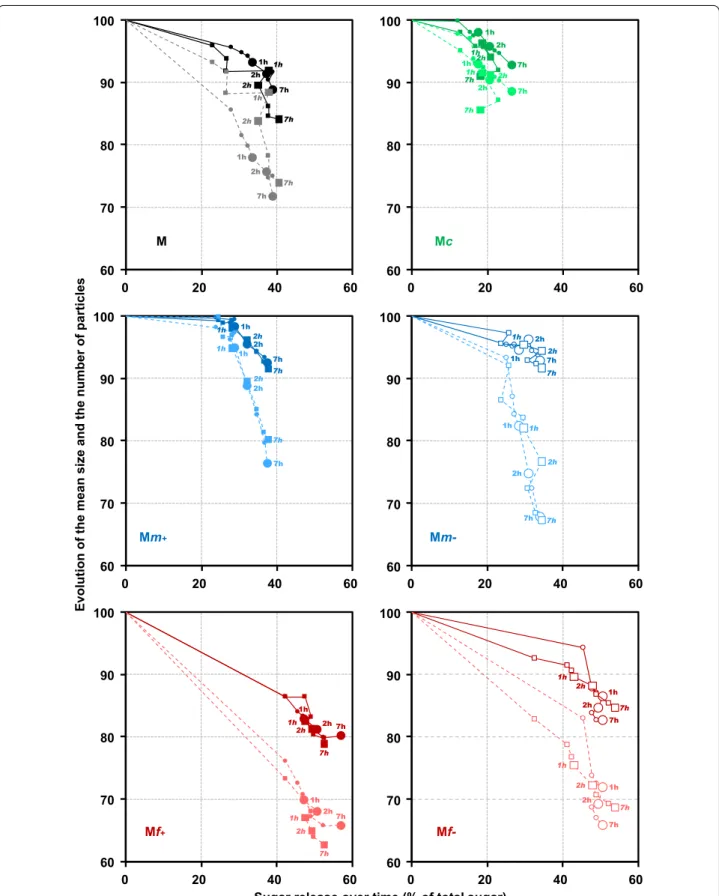
Saccharification was described by combining the analy-sis of saccharification yield, the reduction in the num-ber and size of particles (Fig. 5). Whatever the fraction, the maximum relative change in the number of particles (dotted lines) was still lower than the chemical sacchari-fication yields obtained at the plateau. The times to reach 50% of the modification were always shorter for chemical changes than for physical changes. This result suggests that at least some particles were fully degraded, as evi-denced by the decrease in the total number of particles, while other particles were only partially degraded. Sugar release could be mainly due to the hydrolysis of few par-ticles potentially originating from highly hydrolysable tis-sues, such as pith parenchyma [8] or leaves [74].
In general, the release of sugars was linked with a decrease in particle size (solid line in Fig. 5), but with different ratios. In the fine fractions, a high hydrolysis yield was observed with both a decrease in the num-ber and size of the particles. The release of sugar and the decrease in both the number and size of the parti-cles were very rapid in the fine fractions (Mf + and Mf-) as after 9 min, more than half of the degradation had already occurred. Conversely, in the coarse fraction Mc, little change in either the number or the size of the parti-cles was observed throughout saccharification. After one hour, both the size and the number of particles decreased slightly when a small extra quantity of sugar was released.
Medium fractions (Mm- and Mm +) showed dis-tinct behaviors with no connection between chemical and physical changes. In Mm-, some particle changes were observed together with the sugar release in the first stage of saccharification. After 1 hour of sacchari-fication, the relative amount of particles continued to decrease whereas the saccharification yield had already levelled off. Physical changes continued to occur even if no more sugar was released, suggesting that partially hydrolyzed particles were broken down by stirring. In Mm + , high sugar release (about 30% of the total sugars) was observed before 30 min, with no significant or only moderate change in both the number and size of the par-ticles. After 30 min, the number of particles decreased dramatically whereas the increase in sugar release and the decrease in particle size were moderate. The delay in changes in the physical state relative to sugar release could be explained by the fact that sugars are easily
accessible with no immediate visible modification of the particles. After a while, some particles are weakened by chemical degradation, and start to break down into small fragments and rapidly disappear. Indeed, the number of particles was more rapidly affected than their size. In this case, enzymatic hydrolysis did not have much effect on the morphology of the particles and may proceed from inside the particles.
Relationships between physicochemical characteristics, water mobility distribution and saccharification patterns
High sugar release prior to the reduction in the num-ber and size of the particles, observed particularly in the Mm + fraction, could be explained by the open porosity of the particles. The specific surface (Ssp) area of all the fractions measured by physisorption was systematically higher than the Ssp area calculated from granulometric curves (Fig. 6a), also supporting the presence of open porosity at mesoscale (2–50 nm pore size). A high cor-relation (R2 = 0.915) was observed between the values
obtained with the two methods. Mm + did not deviate from this relationship (Fig. 6a). However, the specific sur-face area measured by physisorption corresponded to the surface area available to krypton molecules and but not to the surface accessible to cellulase, whose mean size is about 5.9 nm [75]. Moreover, values were determined in the dry state at -195.8 °C, quite far from hydrolysis condi-tions implying swollen substrates.
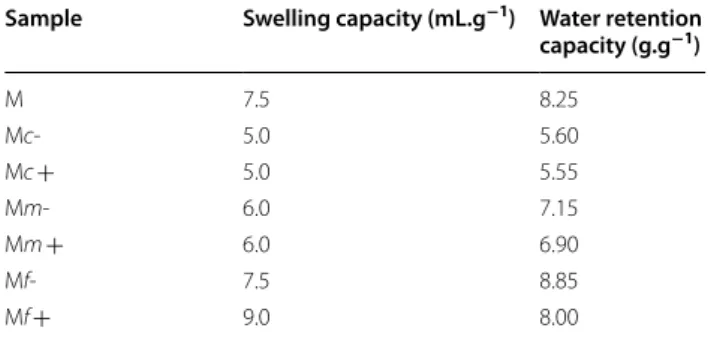
Swelling properties and water retention capacity (WRC) whose values include both water at the surface and between the particles and water within the biomass were considered (Table 3). The coarse fractions had the lowest values for both swelling and WRC, and the fine fractions the highest. A positive correlation was found between these properties (in particular swelling capacity) and sugar release (R2 = 0.915) and the reduction in parti-cle size (R2 = 0.968) after seven hours of saccharification (Fig. 6b). However, here again, Mm + did not differ from Mm- and their values were intermediate between those of the coarse and the fine fractions (Table 3). Differences in swelling and WRC did not reflect the specific sacchari-fication pattern of the Mm + fraction.
Low-field nuclear magnetic resonance (LF-NMR) was used to obtain information on water-biomass interac-tions at the molecular-scale. T2 relaxation times of water proton distribution and their P2 relative proportions were determined. To take advantage of the high sensitivity of this approach to any changes in sample supramolecular structure associated with water distribution and diffu-sion specificities, water-fraction interactions were inves-tigated at five different moisture contents (MC) ranging from 15 to 67%. It should also be noted that at low water content (15% MC), the NMR signal is expected to be
60 70 80 90 100 60 70 80 90 100 60 70 80 90 100 60 70 80 90 100 60 70 80 90 100 60 70 80 90 100 0 20 40 60 0 20 40 60 0 20 40 60 0 20 40 60 0 20 40 60 0 20 40 60
Sugar release over time (% of total sugar)
Evolution of the mean size and the number of particles
M Mc Mm+ Mm-Mf+ Mf-7h 7h 7h 1h 1h 1h 1h 2h 2h 2h 7h 2h 1h 1h 1h 1h2h 2h 7h 7h 7h 7h 2h 2h 7h 7h 7h 7h 2h 2h 1h 1h 2h 2h 1h 1h 7h 7h 7h 2h 2h 1h 1h 2h 2h 1h 1h 7h 7h 7h 7h 7h 2h 2h 1h 1h 2h 2h 1h 1h 7h 7h 7h 7h 2h 2h 1h 1h 2h 2h 1h 1h
Fig. 5 Saccharification of maize shoot fractions in the reactor CINETORE. Changes in the relative mean particle size (solid line) and relative number
of particles (dotted lines) according to the relative percentage of neutral sugars released through enzymatic hydrolysis in fractions M, Mc, Mm + , Mm‑, Mf + and Mf‑. Each point corresponds to different hydrolysis times (15 min, 30 min, 45 min 1 h, 2 h, 3 h, 5 h, 7 h
dominated by water arising from the hydration shell of macro-molecules and from water in interaction within the small pores of matrices, reporting on their micro-structural specificities.
As illustrated in Fig. 7, the analysis of T2 relaxation curves led to T2 profiles with multiple distinct peaks. Because no simple direct relationship exists between T2 components and the morphological compartments in biological tissues [76], each T2 peak can be preferentially assigned to a pool of water at a given range of mobility corresponding to specific molecular environment/inter-actions. Both the number of components, the relative
surface area, and the individual mean T2 relaxation time values associated with these peaks changed with increas-ing water concentration and differed between the five fractions Mc, Mm-, Mm + , Mf- and Mf + . Overall, increasing moisture content led to an increase in the number of T2 components (from 1–2 at 15% MC to 5–6 at 67% MC) with, in most cases, a shift towards higher water mobility modes, which could partially result from a
b
Fig. 6 a Specific surface area of maize shoot fractions according
to the method of evaluation used. b Inter‑relationships between saccharification yield, particle mean size decrease, and swelling
Table 3 Water interaction properties of maize shoot powder and its fractions
Sample Swelling capacity (mL.g−1) Water retention
capacity (g.g−1) M 7.5 8.25 Mc‑ 5.0 5.60 Mc + 5.0 5.55 Mm‑ 6.0 7.15 Mm + 6.0 6.90 Mf‑ 7.5 8.85 Mf + 9.0 8.00 Normalized relative amplitude Pore size (nm) 5 7.5 15 40 120 8 . 3 4.3 T2(ms) 0.1 1 10 100 1000 “s” (15%) (27%) (40%) (38%) (68%) (66%) (55%) (50%) Mf-Mf+ c “s” (15%) (26%) (25%) (39%) (41%) (67%) (68%) (53%) (54%) Mm-Mm+ b “s” (51%) (15%) (26%) (38%) (66%) Mc a
Fig. 7 LF‑NMR T2 distributions for coarse (a), medium (b) and fine (c)
fractions with increasing water content. The x‑axis is logarithmic scale, and distribution amplitude is expressed in normalized relative water content (% w/w). The letter “s” denotes the shortest T2 component
( T2s ) at 15% MC. The correspondence (vertical dashed lines) between
mesoporosity (in nm) and T2 relaxation times is indicated at the top of
the Figure. The shaded area, between 5 and 15 nm (associated with T2 values centered around 4 ms and 30 ms, respectively), indicate the range of pore sizes available for enzyme accessibility
swelling. However, it should be noted that a short T2 mode, centered around 2 ms, was present from 40 to 67% MC with only small changes in value/mobility, indicating that the physical–chemical environment associated with the high constraint water molecules can remain relatively unaffected in this range of moisture contents. In any case, differences between T2 profiles of maize fractions were observed (Fig. 7), regardless of the particle size, the elec-trostatic deviation, and the water content.
The water content associated with pores whose diame-ter are in the range [5. 15[ nm that typically represents the average diameter of enzymes, was investigated in more detail (Fig. 7, shaded area). The water content associated with this pore size range at 67% MC was positively corre-lated with the saccharification yield (R2 = 0.881) (Fig. 8).
It was also correlated with the water content associated with pore sizes below 4.3 nm at 15% MC (R2 = 0.992).
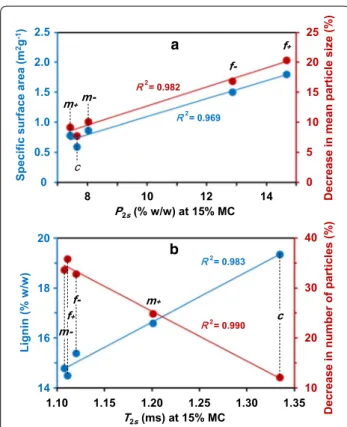
At 15% MC, the T2 profiles of the five fractions showed two peaks with short relaxation times (≤ 4.3 ms). The population P2s , associated with the T2s component, was positively correlated with specific surface area (Fig. 9a, R2 = 0.969), suggesting that this component is mainly
influenced by water molecules located at the surface of particles. The T2s of Mm- fraction was of the same order as that of the fine fractions, whereas the value measured for Mm + was between the fine and coarse ones. There-fore, Mm- differed from Mm + by more constrained water, which is hypothesized to be essentially located at the surface of particles. Despite the very small change in the shortest relaxation time T2s value, it proved to be pos-itively correlated with lignin content (Fig. 9b, R2 = 0.983).
This could mean that the hydrophobic character of lignin may induce an increase in water mobility, in turn result-ing in an increase in the relaxation time T2s centered from around 1.10 ms to 1.35 ms. The Mm + fraction, with
its higher lignin content, could keep the same macro-scopic structure while still allowing accessibility to sugar hydrolysis.
Even at low moisture content, water/fraction inter-actions could be related to sugar release. The decrease in the number of particles was negatively correlated with the shortest T2s centered around 1.2 ms observed at 15% MC (Fig. 9b; R2 = 0.990) and the lignin content
(R2 = 0.983). Moreover, the population P2s , associated
with the T2s component, was positively correlated with the reduction in mean particle size (Fig. 9a; R2 = 0.982).
Thus, these two relaxometric parameters ( T2s and P2s ) could be early (at low MC) indicators of the saccharifi-cation potential, particularly when no significant swelling of the biomass matrix has yet occurred.
Conclusions
Dry fractionation of plant biomass based on particle den-sity and electrostatic properties has produced fractions of different chemical composition and physico-chemical properties, which may reflect variations in the relative proportions of tissue from either the stem or the leaves. Real-time monitoring of enzyme-induced sugar release
R² = 0,8808 R² = 0,992 10 20 30 40 50 m- f-R2= 0.881 R2= 0.992 m+ 0 20 40 80 0 4 12 16 60 8
Water content (% w/w) associated with [5, 15[ pore size (nm) range at ≈ 67% MC
Saccharification yi eld (% ) f+ c Wa ter content (% w/ w) associated wi th pore size < 4.3 nm at 15 % MC
Fig. 8 Inter‑relationships between saccharification yield and water
content associated with [5, 15[ pore size range (in nm), relative to the shaded area in Fig. 8, at 15% and 67% MC
1.10 1.15 1.20 1.25 14 16 18 20 T2s(ms) at 15% MC b R R2= 0.990 R R2= 0.983 10 20 30 40 1.30 1.35 m+ Lignin (% w/ w) Decrease in number of particles (% ) 8 10 12 14 0 5 15 20 25 0 0.5 1.0 1.5 2.0 m-f+ c m+ f-a R R2= 0.982 R R2= 0.969 P2s(% w/w) at 15% MC 10 2.5 Specific surface area (m 2g -1) Decrease in mean particle size (% ) c f+ f-
m-Fig. 9 Inter‑relationships between specific physicochemical
characteristics. a Lignin content and reduction in the number of particles; b Ssp (specific surface area) and reduction in particle mean size and the NMR relaxation parameters associated with the shortest T2 component “s”: a T2s and b P2s
and changes in the physical state of the particles clearly revealed different degradation patterns for these frac-tions. Depending on the fraction, changes in particle size and number were not necessarily synchronous with sugar release. Moreover, the relative decrease in particle size was much smaller than the relative decrease in particle number, suggesting (i) the coexistence of recalcitrant and degradable particles within a fraction: (ii) for degradable particles, chemical degradation within the particles with no visible change in size to a point where weakened, they break down and then degrade rapidly. Lignin was shown not necessarily hinder the access of enzymes to polysac-charides within the cell wall, but help to preserve the macroscopic structure of the particle despite high sugar release.
This paper also suggests that biorefinery processes could benefit from adding a dry fractionation step to optimise biomass flows and better exploit heterogeneity by diversifying uses according to fractions.
Materials
The maize variety Maxxis grown at INRAE Lusignan center (France), was harvested at the silage stage. The maize shoot, i.e. without ears but containing both stems and leaves was oven dried at 55 °C and ground with a hammer mill with a 1-mm screen.
The whole ground maize shoot was separated into three fractions (coarse ‘c’, medium ‘m’ and fine ‘f’’) based on particle size using an air classification process (Hozo-kawa Alpine 50 ATP turboplex). The air classifier wheel was first set at 2,500 rpm rotor speed to collect the coarse fraction and the remaining fraction was then separated into medium and fine fractions with the rotor speed set at 4,000 rpm. Each fraction was further separated elec-trostatically (TEP System, Tribo Flow Separations, Lex-ington, U.S.A). Two fractions were recovered, one on the negative electrode side (coded “-”) containing the posi-tively charged particles, one on the positive one (coded “ + ”), containing negatively charged particles. Particles in bulk were observed using the AZ100M Multizoom (Nikon, Japan) using white LED epi-illumination at low magnification (× 4).
The commercial preparations Celluclast® 1.5L, which is a cellulolytic complex produced by a selected strain of Trichoderma reesei cellulase, NS50010, which is a β-glucosidase (EC 3.2.1.21) and NS500030, which is an endoxylanase (EC 3.2.1.8) were gifts from Novozymes (A/D Bagsvaerd, Denmark). Prior to use, the three enzyme preparations were desalted on a PD-10 column (GE Healthcare Bio-Sciences AB, Uppsala, Sweden) to remove low molecular weight stabilizers. After desalting, the protein concentrations were 14.8 mg/ ml, 10.5 mg/ ml. and 27.9 mg/ml for Celluclast® 1.5L, NS 50,010
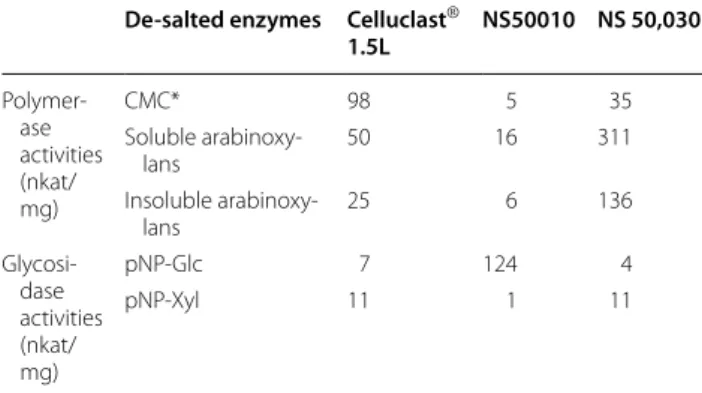
and NS 50,030, respectively. The main activities of the desalted preparations were determined on model sub-strates (Table 4). Celluclast® 1.5L had a strong activity on carboxymethyl cellulose but also showed an activity on arabinoxylans. The NS50010 preparation has a strong β-glucosidase activity and NS50030 a strong activity on soluble and insoluble arabinoxylan and also on carboxy-methyl cellulose. The three enzyme preparations were used in combination for the saccharification experiments and added in the proportions of 18, 24, and 17 mg of proteins/g of solid for Celluclast® 1.5L, NS 50,010 and NS 50,030, respectively.
Physical–chemical characterization
Except for particle size analysis, measurement of specific surface area and lignin composition, all the experiments were carried out on water-insoluble material. About 1 g of sample was suspended in 200 mL of distilled water containing 0.02% merthiolate (by weight). The suspen-sion was stirred overnight at 40 °C and then filtered through a 10 µm nylon filter cloth. The insoluble frac-tions were washed with 50 mL of distilled water and then freeze dried.
Particle size analysis
The particle size distribution of the maize shoot frac-tions was measured using a Mastersizer 2000 laser dif-fraction particle size analyzer (Malvern Instruments Ltd., United Kingdom). Measurements were taken in ethanol, using 40% ultrasound power and setting obscuration at between 10 and 20%. Median diameter (D50), span
((D90-D10)/D50) and the calculated specific surface were
extracted from particle size distribution expressed in vol-ume from at least three parallel analyses per sample. The
Table 4 Specific activities of the three enzymatic
preparations used for the saccharification tests
Carboxymethyl cellulose (CMC), Nitrophenyl-β-d-Glucopyranoside (pNP-Glc) and
4-Nitrophenyl-β-d-Xylopyranoside (pNP-Xyl) were purchased from Sigma-Aldrich
(St Louis MO)
Soluble and insoluble arabinoxylans were isolated from wheat flour in our laboratory
De-salted enzymes Celluclast®
1.5L NS50010 NS 50,030 Polymer‑ ase activities (nkat/ mg) CMC* 98 5 35 Soluble arabinoxy‑ lans 50 16 311 Insoluble arabinoxy‑ lans 25 6 136 Glycosi‑ dase activities (nkat/ mg) pNP‑Glc 7 124 4 pNP‑Xyl 11 1 11
parameters D10, D50, and D90 indicate that respectively
10%, 50%, and 90% of the particles examined were below the corresponding diameter expressed in µm. The span represents the width of the particle size distribution.
Specific surface measurement
The Kr adsorption isotherms were determined using an ASAP 2460 (Micromeritics, France) at -195.8 °C. Sam-ples (approx. 1 g) were first degassed under vacuum at 50 °C for 48 h (VacPrep 061, Micromeritics, France). The specific surface area was deduced from the Branauer-Emmett-Teller fitting method of isotherm at a partial pressure of between 0.02 and 0.3, and the mean rela-tive deviation between duplicates was less than 3%. The measured surface area accounted for the whole rough external surface and for the surface accessible in the open porosity at the mesoscale (2 nm-50 nm pore size).
Swelling capacity
The swelling capacity of the powdered samples was measured using the bed volume technique [77]: 100 mg of sample was dispersed in 10 mL of distilled water in a graduated cylinder and left overnight at room tempera-ture. The volume of the swollen sample was then meas-ured and expressed as mL of swollen sample per g of original dry sample. The analysis was done in single.
Water retention capacity (WRC).
WRC was evaluated as the capacity of powder to hold water against a centrifuge force as described by Guil-lon et al. [78]. Three hundred mg of sample were sus-pended in 25 mL of deionized water and allowed to settle overnight at 4 °C under gentle stirring. The suspension was then centrifuged at 3,000g for 20 min at 20 °C and the supernatant was eliminated by passing the sample through a filter (mesh size 100 µm). The pellet was trans-ferred to a weighed sinter (G2) to drain for 2 h. Sample fresh weight was recorded prior to drying at 103 °C over-night. The WRC was deduced from the water retained in the pellet divided by the sample dry mass. The mean rela-tive deviation between duplicates was less than 4%. The analysis was done in duplicate.
Water mobility and pore size distributions
Water mobility and pore size distributions were meas-ured by low-field nuclear magnetic resonance (LF-NMR) relaxation. Each fraction was left at controlled humidity (0.98 aw) for different times to reach the same moisture
content (ranging from 15–67%).
LF-NMR analyses were carried out using a Min-ispec mq20 spectrometer (Bruker) operating at 0.47 T (20 MHz proton resonance frequency) equipped with a thermostated (± 0.1 °C) 1H probe. Fractions were packed
in a 10-mm-diameter NMR tube to reach 1 cm in height and left for 10 min in the spectrometer for the temper-ature to stabilize at 4 °C. The transverse T2 relaxation curves were acquired using a Carr–Purcell–Meiboom– Gill (CPMG) sequence. The 180° pulse separation was 0.2 ms, 1,024 even echoes were collected, and 2,048 scans were acquired with a recycle delay of 0.5 s resulting in a total acquisition time of about 20 min.
After acquisition, water was added to successively reach a hydration level of about 27%, 39%, 53% and 67%, and an interval of four days was left before the following meas-urements. The number of even echoes collected (2,048 to 20,000), the number of scans (1,024 to 128, respectively) and the recycle delay (from 1 to 5 s) were adjusted for each hydration state (from 27 to 67% w/w).
An inverse Laplace transformation (ILT) was applied to convert the relaxation signal into a continuous distribu-tion of the T2 relaxation components. For this purpose, a numerical optimization method was used by includ-ing non-negativity constraints and L1 regularization and by applying a convex optimization solver primal–dual interior method for convex objectives (PDCO) [79, 80]. Similar NMR acquisition and data treatment protocols were implemented on controlled pore glass samples of known diameters (Sigma Aldrich; pore size: 8, 25, 50 and 100 nm). A linear relationship (R2 = 0.998) between T2
values and pore diameter was thus established and used to convert T2 distributions of biomass fragments into pore size distribution. The analysis was done in single
Cellulose crystallinity
NMR experiments were performed on a Bruker Avan-ceIII-400 MHz spectrometer operating at a 13C frequency
of 100.55 MHz and equipped with a double-resonance H/X CP-MAS 4-mm probe for CP-MAS solid-state experiments. Experiments were carried out at ambient temperature (20 C), in single for each experiment. Con-tact time was 1.5 ms. A typical number of 3,072 scans was acquired for each spectrum. Chemical shifts were calibrated with external glycine, assigning the carbonyl carbon at 176.03 ppm. To determine the degree of crys-tallinity of cellulose, the 78–90 ppm region of 13C
spec-tra was decomposed as previously described [81] using Peakfit® software.
Chemical composition
Except for lignin measurements, all analyses were car-ried out on water-insoluble material. Lignin analyses were performed on extractive free material. Extractive-free material was prepared by exhaustive extraction with water and ethanol before drying at 40 °C. All the analyses were performed in duplicate except for uronic acid and ash content determined in a single test.
Neutral sugars were analyzed by gas chromatography (GC) after sample hydrolysis by sulfuric acid conver-sion of the monomers to alditol acetates as previously described [81, 82]. The mean relative deviation between duplicates was less than 5%. Total neutral sugars in enzy-matic hydrolysates were quantified using the colorimet-ric orcinol method [83] with glucose as standard. The uronic acid content in the sulfuric acid and enzymatic hydrolysates was determined using the metahydroxy-diphenyl colorimetric method [84] and glucuronic acid as standard. The constituent sugars were expressed as polysaccharides taking into account the loss of one water molecule for each glycosidic linkage. Therefore, experi-mentally determined values for monosaccharides were converted to polysaccharides using factors 0.88 for pen-toses and 0.90 for hexoses. The total amount of proteins was estimated using the Kjeldahl method with a nitrogen protein conversion factor of 6.25 according to the stand-ard NF EN ISO -5986–1 (2005/Cor;1:2008). The mean relative deviation between duplicates was 25%. Acetyl contents were measured by HPLC after alkaline hydrol-ysis according to [85] and the mean relative deviation between duplicates was less than 6%. Ash content was measured using the thermogravimetric method accord-ing to the standard NF EN ISO 2171 (2010).
Ester-linked p-coumaric and ferulic acids were meas-ured after mild alkaline hydrolysis [86], with a mean rela-tive deviation of 2% between duplicates.
Klason lignin content was measured according to Dence [87]. Lignin structure was investigated by thioac-idolysis [88]. Lignin-derived monomers were analyzed via their trimethylsilyl derivatives by gas chromatogra-phy-mass spectrometry (GC–MS). The mean relative deviation between duplicates was less than 2%.
Saccharification experiments
The torus reactor Cinetore
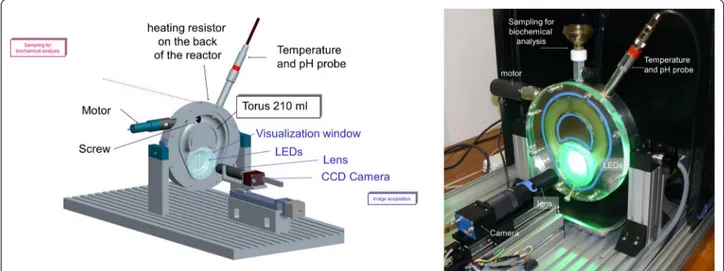
Maize fractions were evaluated for saccharification kinetics in a torus reactor prototype named ‘Cinetore’ equipped for the visualization of particles at the macro-scopic scale [89]. It is pictured in Fig. 10. The reactor is a steel block in which half a torus was machined. The diam-eter of the torus is 100 mm and the semi-circular section is 25 mm, giving a total volume of 205 mL. The geom-etry of the torus was distorted to allow the visualization of particles while maintaining a constant section vol-ume. The reactor is closed by a transparent polycarbon-ate cover including a neutral video filter (r = 25 mm) as visualization window. The background of the steel block under the visualization window was painted black. Forty-eight green leds (525 nm Agilent HLMP-CM36-X10xx) were enclosed in the steel block around the visualization window at an angle of 30° to provide diffuse lighting of the samples through the particles. Particles, therefore, appear as bright objects against a black background. The Cinetore reactor was equipped with a monochrome cam-era (PROSILICA EC1600, Alliance Vision, Montélimar, France) that allows the acquisition of 1,220 × 1,620 pix-els monochrome images with gray levpix-els coded between 0 (black) and 255 (white). Flat resistances glued under the steel block and a thermocouple probe enabled the temperature inside the reactor to be controlled. Stirring is ensured by a three-blade screw driven by a variable speed motor. The reactor was placed in a vertical posi-tion with an opening at the top to allow the medium to be sampled for chemical analysis. A × 0.55 telecentric lens (T100/0.6 Vision Control, Alliance Vision, France) was used: the pixel size was 8.2 × 8.2 µm2, and the field of
view 10.0 × 13.3 mm2.
Hydrolysis experiment
Four hundred mg of water-insoluble material was sus-pended in water and placed in the Cinetore reactor. The volume was completed to 200 mL with deionized water. Degradation took place at 40 °C for a period of seven hours in the presence of an enzymatic cocktail. The combination of enzymes (18, 24, and 17 mg of proteins/g of solid for Celluclast® 1.5L, NS 50,010 and NS 50,030, respectively) was added into the reactor. Experiments were performed in duplicate. In addition, one control experiment was performed with no enzyme.
The suspension was stirred throughout the reaction and the particles moved continuously inside the reactor. During the saccharification process, images of the parti-cles were automatically acquired at 0, 5, 10, 15, 20, 25, 30 and 45 min, 1 h, 1 h 30, 2 h, 2 h 30 and 3, 4, 5, 6 and 7 h. Ten images were recorded on each occasion.
The chemical degradation of particles was evaluated by measuring the amount of sugars solubilized. Hydro-lysates were sampled at times 0, 15, 30, 45 min, 1, 2, 3, 5, and 7 h. The hydrolysates were boiled for 10 min to inactivate the enzymes, centrifuged for 5 min (8,500 rpm, Sigma 6K10). Concentrations of uronic acid and neutral sugars in the supernatants were measured using colori-metric methods. The amount of sugar released at each measurement time is expressed as % of the total sugars in the original material (T0).
The kinetics of sugar release were modeled with an exponential law (one or two exponentials, depending on the fraction considered) to evaluate asymptotic values and, in particular, to extract the parameter t1/2, defined
as the time necessary to obtain 50% of the full range of variation.
Image analysis
Image preprocessing Examples of raw and preprocessed images are provided in Additional file 1 in which the par-ticles appear as bright objects against a dark background. The general background of images changed during enzy-matic degradation. Background variations were removed using the tophat transformation from mathematical mor-phology [72]. The tophat transformation selects bright objects smaller than a mask of a given shape and size called structuring elements. In the present work, a squared structuring element was considered with a side measuring 131 µm corresponding to 1,075 µm.
Number of particles The total number of particles was evaluated as the sum of gray levels of preprocessed images at time T0. The values of the 10 images acquired at T0 were averaged to obtain the original value. The decrease in the number of particles during the reaction was
meas-ured as the percentage of relative decrease with respect to the original values. Again, values of 10 images acquired at each measurement time were averaged.
Particle size evolution A huge number of particles was observed in the images making individual particle iden-tification irrelevant (Fig. 1). Particle size evolution was therefore evaluated overall from the total particle popu-lation with no segmentation steps. Gray level granulom-etry based on mathematical morphology tools was used for this purpose [72]. It was applied as described by [89, 90]. The method provides granulometric curves that can be compared to usual granulometric distributions except that they are based on measurements of variations in the gray level. The technique does not extract the so called “actual size distribution” but enables comparison of images in a given experiment. Mean sizes can be calcu-lated from the granulometric curves that were called “gray level mean size” [90].
In the present work, granulometric curves were com-puted using morphological opening by linear structuring elements [72] to account for the fact that many particles were elongated. Because of the random orientation of particles in the images, two orientations of the structur-ing elements (0 and 90°) were applied. Granulometric curves, therefore, measured the distribution of the aver-age projected length of particles at 0 and 90°. The maxi-mum size analyzed was 1,075 µm with a 16.4 µm step between two sizes. The 0 and 90° granulometric curves of the 10 images acquired at a given time were averaged to obtain a single granulometric curve per measurement time.
Granulometric curves are usually normalized with respect to the total gray levels of the image considered, i.e. the total number of particles in the image. In the pre-sent work, a second kind of normalization was used for the total gray levels of the image at time T0 for all images of a given kinetic, i.e. the total number of particles in the original image at time T0.
Gray level granulometric curves were computed using homemade software developed with Matlab and available
at http://www.pfl-cepia .inra.fr/index .php?page=granu
lomor phogu i_en).
Supplementary Information
The online version contains supplementary material available at https ://doi. org/10.1186/s1306 8‑020‑01854 ‑1.
Additional file 1. Abbreviations
D50: Median diameter of particle size distribution expressed in volume; FA:
Ferulic acid; CA: Para‑coumaric acid; Ssp: Specific surface area; WRC : Water retention capacity; MC: Moisture content (wet basis.