bw
WILLIAM RHUEL SHORT
S.B., Massachusetts Institute of (1973) M.S., Massachusetts Institute (1975) Technolow of Technologw
SUBMITTED IN PARTIAL FULFILLMENT OF THE REQUIREMENTS FOR THE
DEGREE OF DOCTOR OF SCIENCE at the MASSACHUSETTS
INSTITUTE
Februarv, 1980OF TECHNOLOGY
0
William Rhuel Short 1979ThQass
achusett I t *e o Techno~gsi
7t
erdThe
author here
hgransts
t
0
Tto
reproduce
and to distribute copies of this thesis document in whole or
Part.
Signature redacted
Signature of Author*... V7...V..,k .V, s ...
Department of Electric -
ineerin
and Computer Sciencer
-
J(February,
1980
Signature redacted
Certified b...o % Amar G. BoseThesis
Supervisor
Signature redacted
A
ccePted b
. . .. ... ,.. .. .4 + * . . .. . 4AD(L
I Arthur SmithV
QMASSACHUSE
usI iErmanrDepartmental
OF
TECHNOLOGY
MAR 2 5 1980
Graduate Committee
ACTIVE NOISE ATTENUATION
bw
WILLIAM RHUEL SHORT
Submitted to
the Department of Electrical Enrineerin9 and Computer Science on November 14, 1979, in partial fulfillment of the
reauirements for the Degree of Doctor of Science.
ABSTRACT
A new method for globallw reducing the amount of unwanted Power radiated bv acoustic sourcesy bw means of
active devices, is Proposed. After examining PreviouslY
reported passive and active noise attenuating technioues, and finding them to be unsuitable for some applications, a new
method is Proposed. The scheme involves Placin an
attenuating source close to the noise sourcer driven in such a wav as to form a dipole out of the two sourcesy thus
reducing the acoustic Power radiated.
Eauations are derived relating the total Power radiated
to the volume velocities of acoustic Point sources. Beginning with the simplest casey that of a single
attenuatin sourcer a swstem is derived which Produces the
reauired volume velocitv at the attenuating sourcey and an electrical model of this swstem is created. The model is
used to verify svstem stability and to Predict the amount of noise reduction that mav be obtained. A laboratorw
realization of the system is constructed having performance closelv matching that of the model. When tested under ideal conditionsy the svstem provides 16 db of noise reduction, within 2 db of the calculated theoretical maximum. For twpical noise sourcesy the reduction drops to 8 db.
The need for multiple noise attenuating loops is
discussed. Eautions are derived predicting the performance
of such a system. A computer model is built to answer
auestions of stability and performance. A laboratory system
is constructed which verifies the computer model. A second
attenuating loop increases the noise reduction from 8 to 12
db for one tvpical noise source.
Thesis supervisor' Prof. Amar G. Bose, Professor of
3
ACKNOWLEDGEMENTS
The author wishes to acknowledge the assistance of
several People whose help throughout the course of this work
proved instrumental in its completion.
Prof. A. G. Bose, the thesis supervisor. The original
concept for the device described in this thesis was his and
was the outgrowth of some Previous work done bv him at Bose
Corporation in this area. His guidance through the vears
reauired to complete the work described in this thesis was of
immeasureable help. His abilitv to Point the student to the area where concentrated effort would Provide the greatest return greatlv reduced the time spent exploring dead-end
avenues.
Prof. K. N. Stevens and Prof. L. A. Gould, the thesis
readers. Both of these gentlemen were able to provide useful
criticism not onlv in their fields of expertisey but also on a wide varietv of topics !ermane to the work. Their
discussions and encouragement were of enormous help throughout.
Mr. J. C. Carter. While enaged in research on a
related topic at Bose Corporationy he broke ground in a
invaluable in makins! this Project work..
The People of Bose Corporation. Some of the work.
described in this thesis was Performed usin eauiPment and
facilities of the Bose Corporation. Without the cooperation
of these People, this work. would have been impossible.
Finallv, the author wishes to acknowled-e the work of
Dr. Arthur C. Clarke, who had the foresight to predict a
global noise reducini device in his short story, 'Silence
Please" Published in 1950. The storv humorouslv discusses
,he social effects of the use of such a devicey and while riot
completely accurate on technical mattersy it does su!Sest a
TABLE OF CONTENTS TITLE PAGE.. .. .. .. .. .. .. .. . .. .. .. .. .. .. .. . ACKNOWLEDGEMENTS...3 TABLE OF
CONTENTS...
....5
CHAPTER 1 4 CHAPTER 2. INTRODUCTION... ... ...7
PREVIOUSLY REPORTED NOISE CONTROL METHODS....10 I. PASSIVE METHODS
II. OPEN LOOP ACTIVE METHODS III. CLOSED LOOP ACTIVE METHODS
CHAPTER 3. A GLOBAL NOISE ATTENUATION METHOD . . ... . 25
CHAPTER 4.
CHAPTER 5.
SINGLE LOOP ATTENUATION OF SINGLE SOURCES....36
MULTIPLE LOOP ATTENUATION OF NOISE SOURCES...61
SUMMARY AND CONCLUSIONS...81
APPENDIX 1. APPENDIX 2. APPENDIX 3. APPENDIX 4. APPENDIX 5, APPENDIX 6.
MULTIPLE SOURCE RADIATED POWER DERIVATION...85
ATTENUATION OF MORE COMPLEX SOURCES...95
ELECTRICAL MODELS OF LOUDSPEAKERS...100
COMPUTER PROGRAM SOURCE LISTINGS..
CIRCUIT MODEL SOURCE LISTINGS...114
ATTENUATOR SYSTEM CIRCUIT DIAGRAMS...119
REFERENCES. . .. .. *. . . . .. . . .. . .. . .... . . .... . .. . .. .. .. .. 121
BIOGRAPHICAL NOTE... 4, ,4 , 4 , . . ...124
Chapter 1
INTRODUCTION
As a result of the explosion in the uses and numbers of machines in this Industrial Age, People have been Plagued bv
unwanted acoustical enersw in the environment, both indoors
and out. Onlv in this centurv have the necessarv scientific
and enrgineering disciplines been developed sufficientlv to allow control of this noise energv. Yet, noise continues to be a seripus problem, not onl in the working environment,
but in the home environment as well. The art of controlling
noise has riot kept Pace with the demand for better noise control. Legislated limits to noise exposure continue to become tighter in order to better protect the populace, but noise control-schemes have generallw remained the same.
Noise exposure has manv detrimental effects on humans. It can cause mental fatigue and discomforty and, over a period of time, can increase hearing threshold levels,
resulting in all the discomfortsy costs, and inconveniences associated with hearing loss.
of locations where noise reduction could be beneficially applied. In the typical city environmenty traffic noise (both wheel rumble and engine exhaust noise), could be
reduced. In the typical home or apartment, noise from
appliances, or from adJoining rooms or residences can be
objectionable, and might be amenable to better noise control.
In the workplace, the application of noise control would be
of great benefit for silencing a wide variety of
machines--from machine tools to air compressors.
Despite the wide variety of oPportunities to applv noise
control, the state of the art is not verv advanced. Typicallvy Passive elements are used for noise control, Although these methods work in a satisfactory manner at mid
and high freauencies, at low frecuencies thev reouire an inordinate amount of mass in order to do an effective job, Such Passive devices for low freauenc noise attenuation are bulky, costly, and difficult to apply,
Since Passive methods seem incapable of satisfactorily
reducing low freauencw noise, an active method should be
investigated. Such a svstem might include a microphone or an
arraw of microphones, a loudspeaker, or an arraw of loudspeakers, Plus associated electronics for signal
Processing. An active system might be developed having lower cost, lower massy and greater ease of use than a Passive
svstem with similar reduction. Since Passive methods are
PaSe
seem reasonable to confine the examination of active svstems
to low frenuencies. Besides being better able to compete
with Passive systems at these freuencies, the associated Processing electronics are likely to be much simpler at low freauencies than high, due to the lower Phase shift
associated with time delavs in the svstem at low freauencies. The discussion below will show that reasonable Passive methods are not capable of adeauatelw supressin noise at low freauencies. Some active methods of noi-se control which have
been reported in the literature will be examined, but these
methods will also be shown to be inadeauate for various reasons. A new method of Sloballv reducing noise radiated from a localized noise source through the use of a closed loop swstem containing acoustical, mechanical, and electrical elements will be Proposed. The theoretical limitations of such a system will be examinedy followed bw an examination of the Practical limitations# Finally, the Practical limits will be verified experimentallv.
Chapter 2
PREVIOUSLY REPORTED
NOISE CONTROL METHODSI. PASSIVE METHODS
A widelv used method for reducinS unwanted acoustic
en-erSw is
through the
use of passive devices.
These Passive
devices mav be used to reduce the amount of acoustic energw
Put out bv
the sourcer
or they mav attenuate the energv after
it
has been generated as it
Propagates through the air or
through solid members directly connected to the noise source.
In a number of industries, studies have been made of
Particular machines in order to reduce the noise
generated by
those machines.
Examples include the studs and redesign of
noisv sear trains in some machines, and the redesign of
Particularly noisw rotating or reciprocating members.
This
redesign can significantly reduce the amount of noise
gener-ated bw the machine and reduce the difficulty of
externally
muieting the machine.
An
inspection
of the Patent Review
section of the Journal of the Acoustical Society of America
will usuallv turn
up several Patents each month for passive
noise
attenuators applied to specific machines.
Ify, as is usuall the case, machine redesign can not sufficiently Quiet the noise, noise reduction must be applied
external to the
source.
Such
an
application
is not
without
its
problems, however.
Consider a
model
for a typical passive noise suppression
system, shown in figure 2-1.
Generator
Passive
Load
Network
Figure 2-1.
Passive attenuator model.
A source of noise, modeled by the generator, is to be
con-nected
to the listening environment, modeled by the
impedance, through some network of passive elements.
This
network should be designed to prevent energy transfer from
the source to the load at freauencies of interest.
However, mechanical and acoustical circuits are
constrained by the fact that mass elements must be referenced
to
ground.
In an electrical model of acoustic or mechanical
circuits, all massesy which
are represented by capacitors,
must have one end connected to
ground,
as discussed in
Beranek
(1).
This constraint limits
the tvpes of
filters
that can be constructed.
A twsical filter might be modeled using lumped Parameter elements as shown in figure 2-2.
Generator Passive Network Load
Figure 2-2. Passive attenuator model,
The generator is connected to the source through a series of
compliances and masses. Neglecting damping for the moment, the freauenc below which the filter is no longer effective
in reducing enersw transmitted is proportional to the
reciprocal of the snuare root of the Product of the mass and
the compliance. If the desire is to reduce noise Propagation
at low frenuencies, either the compliance must be increased,
resulting in a weak, flexible mechanical structure, or the
mass must be increased,
Herein lies the problem with reducing noise transmission
using Passive structures# The onlv Practical wav to attenu-ate airborne low freauencv noise Passivelw is to use large masses, Large masses tend to be bulky, exPensive, and, obviously, heavy. Such attenuators are inconvenient to use
in manr applications.
Hz is desired. If a single walled, solid, damped partition is used to enclose the noise source, figure 10-26 in Beranek
(1) shows that a surface densitw of 14 Pounds/sauare foot is reauired. Thus, a Partition made from one inch thick
aluminum walls, or from one auarter inch thick lead walls would be needed to give the renuired attenuation.
If the noise source is contained within a two foot cube, then 336 Pounds of material are reauired to obtain the
desired noise attenuation. Such a weight would preclude this noise attenuator from being used in anw portable application.
And even a small hole or leak in the Partition would Oreatlw diminish the noise attenuation, so the structure must
completelv seal the noise source, eliminating anr access to
it and eliminating the possibility of ventilating it. At current prices, the reouired aluminum stock would cost
approximatelv $700. And, if one wanted to decrease the cutoff freauencw bw an octave to 25 Hz, the weight would
auadruple to over half a ton, and the price of materials
would increase to nearlv $3000. Additionallvp this noise at-tenuator would onlw Quiet a machine enclosed in its small two foot cube volume. Finallw, the eauation taken from Beranek
used in calculating these figures contains some
approximations and assumptions and wields a result which is
indicative of the best Performance one could expect.
TvpicallY, one would not obtain as great a noise reduction as that calculated using this formula.
Noise reduction mav also be achieved throuSh the use of acoustic resistances which absorb energv. However, large auantities of materials are reauired in order to obtain
significant low freauencY attenuation* For example, in order to achieve 20 db of attenuation at 50 Hz, Beranek (1) shows that 80 feet of 4 inch thick fiberglass baffles located on 8
inch centers are reauired.
If the noise energv is predominately at one freauencv, an acoustic resonator could be used to reduce the noise level at that freauency. However, such a structure would be large, due to the high compliance, and thus large volume reauired.
The effectiveness of passive attenuation systems can be improved bv using multiple walled svstems with air saps. However, it is easw to see that if significant noise
reduction at low freauencies is reeuired, Passive svstems are
simply too expensive, too heavy, and too inconvenient+ The importance of controlling low freauencw noise should not be underestimated. Tempest (30) showed that noise below 100 Hz
was annoving far in excess of what its A weighted level would
predict. So, there exists a need to reduce low freauencv noise which passive systems can not fulfill.
II. OPEN LOOP ACTIVE METHODS
Since Passive methods have been shown to be
methods need to be investigated. The first reference to the
use of active methods to reduce unwanted sound seems to be a
Patent granted to LueS (17) in 1936. A search of the
literature shows that more recently two approaches have been used: open loop methods, in which the amount of attenuation
is not monitored bw the system, and closed loop methods, where feedback is utilized, so that noise reduction is constantlw optimized bv the svstem.
Twpically, the open loop swstems divide space into two regions, as shown in figure 2-3#
Imaginar
-Closed Surface (Encloses noise
region) A "%Pickup microphones covering surface s Attenuating sources I covering surface Noise sources -Observer
a
(located in the attenuation region)Figure 2-3. Attenuation by Husens' Sources.
One region contains the noise sources, and the other contains
the listeners, It is in this second region that noise atten-uation is desired. Separating these two reSions is an
devices which Produce the noise reduction.
Such a swstem relies on Huyvens' principle, better known
in optics, but here applied to acoustics. The Principle
states that a wavefront produced by a primary source mav also be considered as the sum of wavefronts produced bw an
infinite number of simple secondary sources. In noise atten-uation devices, the acoustic sources on the closed surface act as the secondary sources referred to by Huvgens. The
noise sources, which are the Primary source, are enclosed by the surface, and create some wavefront on the surface. If the secondary attenuatin9 sources on the surface are appro-priately driven, thev can sum to create a wavefront having the same magnitude but opposite sign to that generated by the Primary noise sources. Thus, in the region outside the
surface, the two wavefronts sum to zero, and the noise sources enclosed by the surface are Quieted.
This approach to the Problem has been used by a number of investigators, Particularly in France and the Soviet
Union. Mangiante (18), and Canevet and Mangiante (4) in
Particular, along with Jessel and Mangiante (12) and Fedorwuk
(10), have investigated the twees of sources reauired on the
surface for optimal noise attenuation. Jessel and Mangiante (12) determined that the renuired sources are directional, with a cardioid Pattern, This Pattern is generated using
"tripole" sourcesy each consisting of a dipole source and a monopole source. The sources are oriented so that thev
17
radiate maximum Power to the outside region of space. Thew are driven bv signals derived from the Pressure as measured
Just inside the surface. The Pressure measurement is made using tripole microphones lvin inside the surface in the
region of the noise sources, and sensitive only in the direction of the noise sources. Since the attenuating sources Put out sound onlw in the noise attenuation region,
and since the Pressure microphones Pick up sound onlv from
the noise source region, the microphones are insensitive to the output of the noise attenuating sources, and the svstem
operates in an open loop manner.
Mansiante (18) investigated the Problems encountered when the infinite number of attenuating sources reauired to cover the imaginarw surface are replaced with a finite number
of sources. This constraint limits the amount of noise reduction and the bandwidth over which reduction maw be
obtained.
Mangiante (18) experimentallw examined this technioue.
Twentv attenuating sources were located on a O.8m diameter imaSinarw sphere. Twelve noise sources were located on a concentric 0.2m sphere. A far field reduction in sound
Pressure level of 15 to 30 db was obtained for sine waves in the ranSe of 250 to 500 Hz, and a reduction of 10 to 15 db for narrow band noise was measured in this same freauencw ranse. The experiment was conducted in an anechoic chamber.
derived from a microphone Pickup, but from the actual signal exciting the noise sources, In practice, the fact that a
finite number of microphones would be used would tend to decrease the amount of attenuation obtainable.
In air ducts, it is possible to treat the problem one dimensionallw. The duct is divided bw an imaginarv Plane normal to the air flow through which all air must flow. If the noise sources are assumed to be upstream of this Plane, then the noise source region maw be considered to be the region upstream of this Plane and the noise attenuation region to be downstream. Canevet (3) and Canevet and
Mangiante (4) used this approach and studied noise reduction in air ducts. Acoustic waves were introduced bw means of a loudspeaker into one end of a duct, 8cm in diameter and 3m
long. Halfwaw down the duct, a tripole source was arranged, beaming downstream, fed bv a signal derived from the
electrical signal driving the noise source loudspeaker. Upstream from the attenuating source, no change in sound pressure was reported bv Canevet and Mangiante (4), but
downstream, a 50 to 70 db drop in level was observed for sine waves* Since the swstem was operating in an open loop
manner, this reduction was criticallv sensitive to
temperature changes and drift in the electronics. Canevet
(3) refined the svstem bv using better tripole sources driven bv an upstream microphone# Downstream, noise was reduced bv 40 db for sine waves and 15 db for narrow band noise.
Page
19
Swinbanks (27) examined the one dimensional Problem and calculated that attenuations of up to 50 db were Possible
over a wide range of freauencies. Instead of using tripole
sources, Swinbanks determined that a unidirectional Plane
wave source made up of a small number of simple sources on
the surface of the duct could Produce this desree of
attenu-ation.
A similar arrangement
of microphones upstream could
detect the oncoming noise wavefront. Poole and Leventhall
(23) experimentallw verified this technioue and reported 50 db of noise reduction for sine waves.
Other open loop technioues have been reported for use in situations where the noise waveform is sufficiently well
known that Pickup microphones are unnecessarw. Conover (6)
and Hawlew (11) have both discussed svstems in which the at-tenuating sources are driven from a signal derived from the electrical signal which excites the noise source. Such a svstem could be used onlw where the noise is generated bv a device excited by a known electrical signal. Conover (6) described such a swstem which was tested using a high power electrical transformer. Transformers and similar electrical apparatus are excited bw the 60 Hz current flowing through them and typically generate acoustical energv at freauencies of 120 Hz and harmonics of 120 Hz.
Conover Placed a single loudspeaker next to a 15000 KVA transformer. A microphone was Placed 30 to 60 feet awav, on
attenu-ation obtained. The speaker was fed with sine waves at 120, 240, and 360 Hz, of adjustable amplitude and Phase. The
amp-litude and Phase of each freauencv sine wave was manuallv
adJusted to minimize the sound Pressure as measured bv the
far field monitor microphone. A polar Plot of noise attenu-ation was then made. 20 db of attenuation was reported on
axis, but for most angles, significantlv less attenuation was
recorded. And, for mans angles, increased sound pressure was measured. However, due to the changing nature of the
electrical load on the transformer and the changinS weather conditions, the signal driving the attenuating source had to be adJusted fretuentlY, bw as much as 6 db Per hour, to
maximize noise attenuation.
One can clearlw see the disadvantage of the oPen loop svstems thus far reported, Once the noise attenuation swstem is set up and optimized, performance is degraded bv changes in the system which are certain to occur. Thus, in most applicationst an open loop svstem does not suffice, and a more complex sYstem is reauired.
III. CLOSED LOOP ACTIVE METHODS
Since open loop methods lack the ability to adJust to meet changing conditions, the application of feedback to active noise attenuation methods should be considered. Bw
21
Performance, and the effects of changin operating conditions can be minimized.
Several schemes have been reported in which closed loop techninues were used for reducing vibration in solid objects such as beams or Plates. Papers bw Tartakowski (29), Knwasev
and Tartakowski (13, 14), and Rockwell and Lawther (25) have discussed the use of feedback to reduce vibration at audio
freauencies. These swstems typically measure the velocity or force at a Point or arrav of points on the beam or Plate and use a feedback loop with a velocity or force transducer to
minimize the disturbance measured. By setting the velocity of a point on a beam to zero, Rockwell and Lawther (25)
reported a reduction of 30 db in vibration level over a wide range of freauencies.
These systems have practical uses as noise abatement devices in locations where sound transmission along solid members, such as a beam or a Plate, is a problem, For example, if such a svstem were applied to a mounting Plate for a Piece of heavw machinery less noise would be trans-mitted to the floor, and the overall noise level in the room would be decreased.
An additional twpe of closed loop noise attenuation svstem also exists. Such a svstem reduces airborne noise as
it travels from the noise source to the listener, using
closed loop techninues. However, little has been reported in the literature on such a system, Olson (20, 21) and
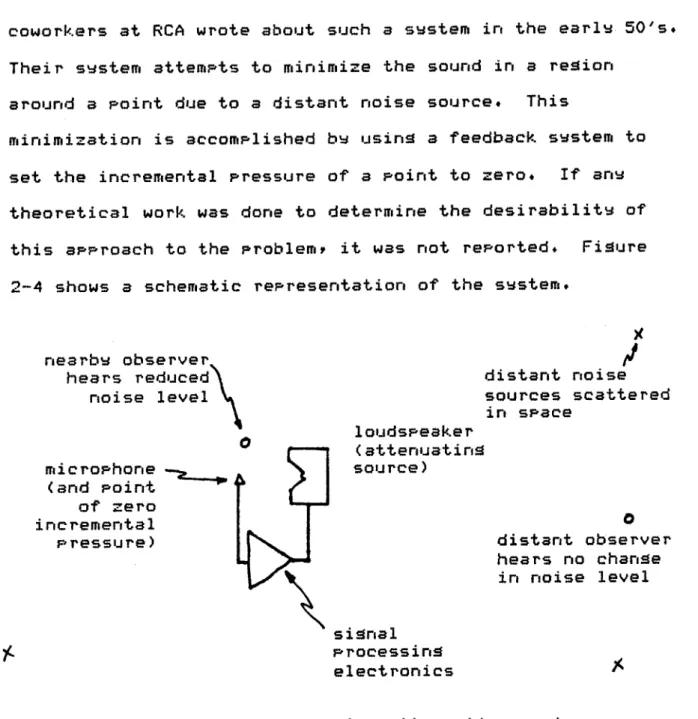
coworkers at RCA wrote about such a swstem in the earlv 50's. Their svstem attempts to minimize the sound in a region
around a Point due to a distant noise source. This
minimization is accomplished bv using a feedback swstem to set the incremental Pressure of a Point to zero. If anr theoretical work was done to determine the desirabilitv of
this approach to the Problemp it was not reported. Figure 2-4 shows a schematic representation of the swstem.
nearbv observer
hears reduced distant noise
noise level sources scattered
loudspeaker in space (attenuating microphone source) (and Point of zero incremental
Pressure) distant observer
hears no change in noise level
signal
ProcessinS electronics
Figure 2-4. Olson's active noise attenuation svstem.
A microphone is Placed in close Proximitv to a loudspeaker. The microphone feeds electronic circuitrw containing a hiSh
sain amplifiery compensation electronics, and a Power
Page
23
incremental Pressure at the microphone to become close to zero for freauencies at which the loop operates. As a result, an observer close to the microphone would hear a
reduction in noise from a distant noise source.
Olson (20) used an especiallv designed loudspeaker and microphone which were separated bv a distance of
approximately one inch. The svstem decreased the sound
Pressure level at the microphone due to distant noise sources by a maximum of 25 db, over a range from 20 to 200 Hz. Four
inches from the microphone, the maximum attenuation dropped to 15 db, and at ten inches awav from the microphone, maximum attenuation became 12 db.
Since this technieue works onlw when the listener and microphone are separated bv a small fraction of a wavelength of sound, the device uiets onlw a small volume of space
directlw around the microphone. However, even with this limitation, the swstem can be useful. Simshauser and Hawlev
(26) Proposed that this techniaue be used in noise reducing
headsets, which could provide better ear Protection than Passive headsets in noisw environments. Thew reported that
as much as 15 db of attenuation could be obtained at low and
midband frenuencies.
While these technieues are capable of Providing
signifi-cant noise attenuation, thew do so only over a limited volume of space. There remained a need for a system which would allow global noise reduction when a noise attenuating device
was applied locall to a noise source. It was from this Point that new work on the Problem of active noise attenu-ation began.
Chapter 3
A GLOBAL
NOISE ATTENUATION METHOD
The Proposed device would operate in a different manner
than those previouslv described in the literature. It would
be placed close to a noise source, and would activelw process
and modify the noise generated bw the noise source in such a
wav as to reduce the total Power radiated bv the combination of the noise source and attenuating source when compared to
the noise source operating alone.
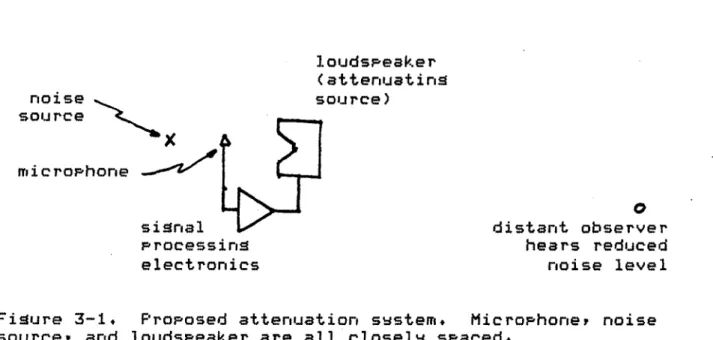
The general form that such a device would take is shown schematically in figure 3-1. A microphone is Placed close to
both a noise source and an attenuating sourcey which could be a loudspeaker. As will be shown below, if the attenuating source is forced to have the same magnitude of volume
velocitv as the noise source, but with opposite signp then the noise source and attenuating source effectively become a dipole source, and the total Power radiated is reduced. This
situation maw be obtained by suitable design of the signal Processing electronics. The Power reduction occurs onlv for
loudspeaker
( at tenuat ing
noise source)
source
microphone
signal distant observer
processing hears reduced
electronics noise level
Figure 3-1. Proposed attenuation system. Microphone, noise
source, and loudspeaker are all closelv spaced,
the attenuating source is small compared to a wavelength of sound. Therefore, for low frenuencies, the sound Pressure
level heard bv a distant observer is much less for the
combination of noise and attenuating sources than for the
noise source alone.
At higher freauencies, where the separation between the
noise source and the attenuating source becomes comparable to, or large compared to the wavelength of sound, no sound attenuation can be expected. Stability constraints on the feedback loop, however, reauire that the system gain be low, and thus the output of the attenuating source is also be low at these frenuencies. As a result, the noise attenuator has
little effect on the overall noise level at high freauencies. This limitation need not be a problem in Practical
Page
27
satisfactorily attenuated bv Passive devices.
This t-ae of device is capable of reducing the total power radiated at low freauencies bw noise sources small
compared to a wavelength of sound. For noise sources comparable to or larger than a wavelensth, several such attenuating sources are renuired.
First, the form of the noise attenuation device must be examined. The simplest possible problem is that of a simple Point noise source and a simple Point attenuating source. If the position and volume velocity of the noise source are
known, then it should be possible to determine a position and volume velocity for the attenuating source which minimizes power radiated.
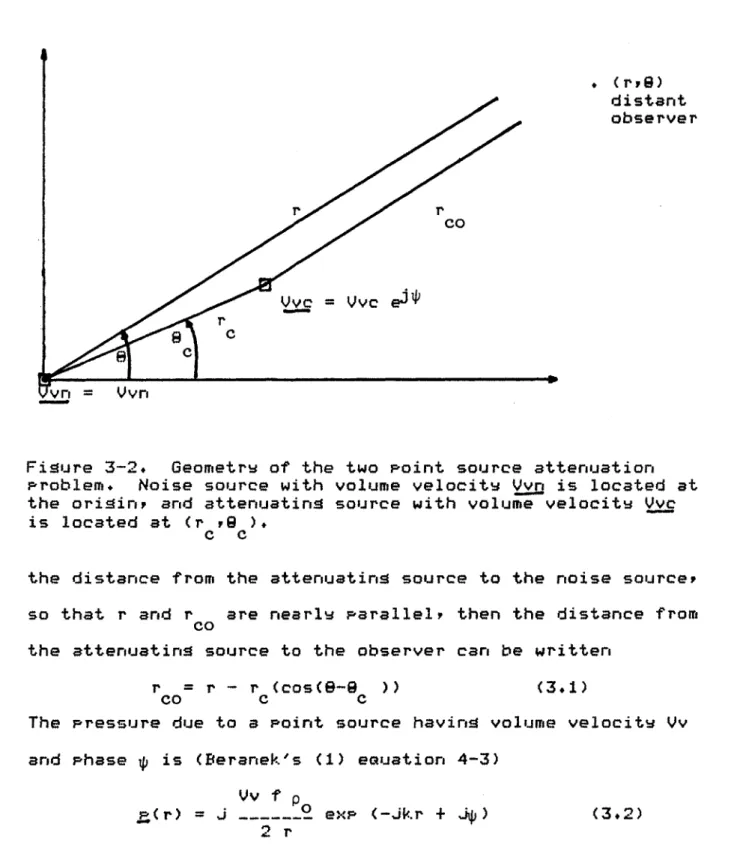
In order to undertake this Problem, an expression for the Power radiated bw two Point sources which are closelv spaced compared to a wavelength must first be derived. The geometrv of the Problem is shown in figure 3-2. The noise source is located at the origin, and has volume velocity Vvr, with a magnitude Vvn and zero Phase anale. (Throughout this
paper, the convention that underlined variables represent complex auantities will be used.) The attenuating source is
located at a point (r , ) in Polar coordinates, and has
C C
volume velocity Vvc, of magnitude Vvc and Phase $.
The distance from the origin, and thus from the noise source, to a distant observer is represented by r. Making the assumption that r is sufficiently large compared to r y
.
(i',G)
distant observerVv
=
Vvcej*
OMO c r v = VvnFigure 3-2. Geometrw of the two point source attenuation
problem. Noise source with volume velocity vr is located at the origin, and attenuating source with volume velocity Vvc
is located at (r ,9 ).
C C
the distance from the attenuating source to the noise source, so that r and r are nearlv parallel, then the distance from
CO
the attenuating source to the observer can be written r = r - r (cos(G-e )) (3.1)
Co C C
The pressure due to a point source having volume velocity Vv
and phase is (Beranek's (1) eauation 4-3)
Vv
f
p = J--...- exp (-Jkr +Jp)
2 r
(3.2)
I 9where f is the freauency, p is the densitv of airy and k is the wavenumber. Superposition mas be used to write the far field Pressure due to the noise source and attenuating source as J Vvc f p P(r) = --- exp(-Jkr +
Ji)
2 r Co Co J Vvn f p +- --- exp(-Jkr) (3.3) 2 rAgain, making the assumption that r is large compared to r , C
rCo maw be replaced bv r in the denominator. Regrouping terms gives J f p0 P(r) = --- exp(-Jkr){ Vvn + 2 r + Vvc exp(J($ + kr cos(-9 )))} (3.4) C C
In order to find the total Power, the magnitude seuared
of the Pressure is needed. It maw be written f 2 P 2
|!|=
-_---{ (Vvn + Vvc cos($+kr cos(8-8 )))4r2 C C
+(Vvc sin($+kr cos(B-9 )))2} (3.5)
C C
Bw making the substitution
a = $+ kr cos(O-8 ) (3.6) C C and obtaining f2 P2 JpJ2 = _ 2 - (Vvn + Vvc cosa) 2 + (Vvc sina) 2 4 r2 (3.7)
2 2
2
= ______(Vvn2 + Vvc2 + 2 Vvc Vvn cosa) (3.8)
The total Power radiated, P, bv this combination of
sources is Proportional to the integral of the magnitude
souared of the Pressure,
evaluated
over a surface enclosing
the two sources.
T 27
P c X X p 2 , 2 sin$ d8 d$ (3.9)
00
~
Since the magnitude souared of the pressure is
not
a function
of
y
the integral becomes
27
P
c
r 2 2 d@ (3.10)0
Substituting in the expression for
Pressure gives
2w f 2 p2P
c r
2 0 {Vvn 2 + Vvc2 + 2 Vvc Vvn cosa}dB0
4r2 (3.11)which reduces to
27 P0
f
{Vvn2 + Vvc2 + 2 Vvc Vvn cosa}d8 (3.12)0
The problem now becomes one of integrating the expression for
the souare of the
pressure magnitude with respect to theta.
This integration
maw
be done term
bv
term.
The first
two
terms are trivial.
21T
f (Vvn2 + Vvc2) dQ = 2n (Vvn2 + Vvc2 ) (3.13)
0
The second term is of the form+ cos(cos 8)
21r
f 2 Vvc Vvn cos(4 + kr cos(G-9 ) d& (3.14)
0
C CThis integral can be rewritten as 2T
2 Vvc Vvn
f
{cos4 cos(kr cos(S-8 C 0+ sinO sin(kr cos(8- C ))}dB (3.15)
Fortunatelw, because of the reauirement that the two point
sources be closel spaced in terms of wavelengths, the term
krC will be small at freauencies of interest. Thus, the cosine term maw be expanded in a series
k2 r2 cos2
(13_9
cos(kr C cos(B9O -~ ~ ~~ ~~I~ ~ + . .
2 (3.16)
and the sine term, similarlvy
sin(kr cos(B-9 )) kr cos(6-9 ) + ... (3.17)
C C C C
Dropping the higher order terms, the integral becomes
27
k
2 r cos2 (8-8 )2
Vvc Vvn cos{1
---0 2 2T + sin* f kr cos(4-B ) d8 (3.18) 0 C C which reduces ton k 2r 2
2 Vvc Vvn cos p (2 T - - C--- ) (3.19)
2
The final result is a Proportionalitv for total Power
radiated, PF of the form
k2r 2
P , Vvn2 + Vvc2 + Vvc Vvn cos (2 - ----. C-. )
2 (3.20)
From this expression, one can see that Power radiated
decreases as the spacing between the two sources decreases,
as their volume velocity magnitudes become more alike, and as their Phase difference more closelv becomes 180 degrees+ In the situation where the spacing becomes zero, and the volume velocities become identical with a 180 degree Phase shift, then the total Power radiated becomes zero.
Standard minimization techniaues show, as expectedy that the more the two sources become like a dipole, the less Power is radiated bv the Pair. This minimization can be confirmed, and a determination made of how much Power reduction can be expected bw using a computer simulation. Figure 3-3 shows the reduction in Power radiated for two point sources. Zero db is the level of the Power radiated bw a single Point
source having volume velocitv magnitude 1 and Phase 0. In
generating these curvest the noise point source was set to Vvn = 1, and Phase = 0. The attenuating point source had a variable magnitude and Phase, as shown on the Plot, The
sources were located one twentieth of a wavelength apart. Note that maximum attenuation occurs for the dipole
33 8.600 1.008 2.0 3.8 4.18 PHASE CRAD) Figure
X/20.
top
to
=
2y 1
3-3. Power radiated bw two point sources separated bw Vvn=l, $ =0 argument * varies from 0 to 27.. From bottom aonz the vertic91 axis, the curves are for Vvc
12, 1, 0.89, 0.5. P 0 U E R D 9 5.. 0.,.. -5., -10.9 -20.0 -25.0 -30.6 -3S., -40.0 1E 1 1E 2 1E 3 FREQUENCY
Figure 3-4.
Power radiated bv two Point sources.
Vvn=1ly
=0, Vvc=1,
P=w.
Top curve:
0.2m source separation.
Bottom 9zurve'
O.lm sAurce separation.
16.6 5.6 P E R D 0
4-
-0. ee
-5.8 -18.8 -1s.6 I s.8 a.8101--.
101110,00-condition, that is, Vvn = -Vvc. For this dipole situation, a
plot of Power attenuation versus freauencY is shown in figure 3-4 when the noise and attenuation source are located 0.1m apart. The Programs used to generate these plots are shown in Appendix 4. Not surprisinolv, at low frenuencies, the attenuation is greatest, where the spacing of the sources is
the smallest fraction of a wavelen th. As this fraction becomes larger, less and less attenuation is observered. At frenuencies near 500 Hz, the separation becomes significant
compared to a wavelength, and the approximations used in deriving the power radiation eauations are no longer valid. As a result, the results shown in the Plot can not be
regarded as reliable above 500 Hz. However, significant attenuation can not be expected when the sources are
separated bv a large fraction of a wavelength. In addition, the stabilitw constraints imposed on the svstem will Prevent the attenuating source from having significant output at
these frenuencies, and so the addition of the attenuating source will have little affect on Power radiated at midband and high freauencies.
In general, acoustic sources are not Point sources. One
might expect, though, that bv using reasonablv sized loudspeakers as attenuating sources, each maw be modeled accuratelv as a Point source at freauencies where the
attenuator functions. However, mans noise sources can not be modeled accuratelv using point sources. But, any noise
source maw be regarded as a collection of Point sourcesy each having a different location, and complex volume velocitw.
The total Power radiated bw M noise sources and one
attenuating source is shown in ecuation 3-21 below.
M M k2r? F "Vvc2 + r Vvn2 + Vvc Vvn. ( 2 -- cos M M k2 r?. + E Z Vvn Vvn (2 - 13 )
cos($. --.
)
i=1 J=1 2 i J (3.21)Power radiated bw M noise sources at distance r.* with
magnitude Vvn. and Phase *.y and one attenuatiotu source at the origin habins magnitud Vvc and Phase O.
This expression is derived in Appendix 1 and follows steps similar to those in the derivation shown in this chapter. This expression turns out to be not Particularlw informative.
However, one can note that as noise source to attenuating source spacings become smaller, the dipole situation causes increased Power reduction. The goal again becomes making the attenuating source and each noise source as much like a
dipole as Possible. By doins so, the total Power radiated can be reduced.
Chapter 4
SINGLE LOOP ATTENUATION OF SINGLE SOURCES
From the derivations of the previous chapter, the general form of the attenuation svstem is known. As was shown in that chaptery the attenuating source, for a sinsle point noise source, should take the form of a point sourcer having volume velocity M(s) = -Vvn(s), and located as close
as possible to the noise source. The next Problem is to
develop a svstem that generates this volume velocitw.
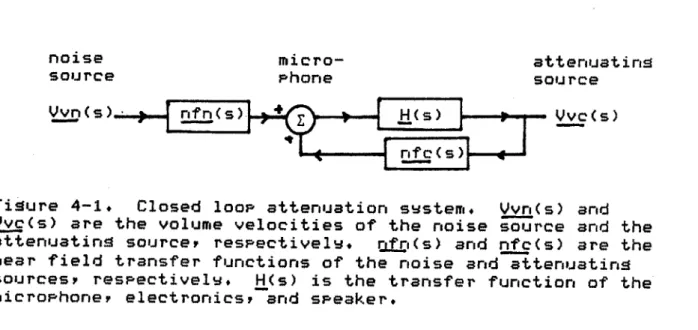
It is expected that a closed loop systemp as shown in
figure 4-1, can fulfill the reeuirements. Vvr(s) is the volume velocity of the noise sourcer and Vvc(s) is that of the attenuating source. H(s) is the transfer function
between the Pressure at the microphone and the output device. The transfer function between the volume velocity of the
noise source and sound Pressure at the microphone is
represented by nfn(s), the near field transfer function of the noise source. Similarly, nfc(s) represents the transfer
function from the attenuating source volume velocity to the sound Pressure at the microphone. The system is assumed to
37
noise
micro-
attenuatini
source
Phone
source
Vvn(s)...
nfn
s) +H(s)
Vvc(s)
nVfc(s)
Figure 4-1.
Closed loop attenuation svstem.
Vvn(s) and
Vvc(s) are the volume velocities of the noise source and the
attenuating sourcer respectively,
fri(s) and nfc(s) are the
near field transfer functions of the noise
and
attenuating
sources, respectively.
H(s) is the
transfer function of
the
microphoner electronics, and speaker.
be linear and time invariant.
The transfer function between
Vvc(s) and Vvr(s) can be written
H(s) nfn(s)
Vvc(s) = --...--- Vv(s) (4.1)
1 - H(s) nfc(s)
When rfn(s)
=
nfc(s) , and when
1H(s)
nfc(s)
>>
l then this
eauation reduces to Vvc(s)
=
-Vvn(s), which is Precisely the
transfer function desired.
So, in order to obtain the
Proper
attenuator
action, H(s), and thus the open loop gain, of
the
svstem must be large, and the near field Pressure transfer
function must be the same for both the
noise
source and the
attenuating source.
The practical restrictions on the near field transfer
functions, nfn(s) and nifc(s),
and
on the system transfer
function, H(s), must be determined to ensure that Vvn(s)
=-Vvc(s) in a practical system,
Before investigating the
should be examined. The simplest case, a Point noise source, implies a point attenuating source at an eaual distance from the microphone, so that inf(s) = ifc(s). For frenuencies of interest, it is possible to build a loudspeaker swstem which
will act as a point source in both the near and far field. The speaker enclosure must be sealed, and all dimensions of
the loudspeaker enclosure must be small compared to a wavelength at the highest frenuencw of interest. If, for example, the hishest freauencY of interest is 500 Hz, the
wavelength is 70cm, and all dimensions of the loudspeaker
must be small compared to 70cm.
In order to examine further the near field Properties of a loudspeaker, some Pressure measurements were made of a
loudspeaker in an anechoic chamber. A loudspeaker,
consisting of a 6 inch diameter high displacement woofer enclosed in a sealed box having approximate dimensions 20 x 23 x 30cm, was excited bw swept sine waves. At various
distances from the speaker, a microphone measured the on-axis
sound pressure. The amplitude and Phase of this Pressure compared to the loudspeaker excitation is shown in figure
4-2. The top Plot shows the magnitude of the loudspeaker to microphone transfer function for microphone to speaker
distances of 5cm and 100cm. The bottom Plot shows the phase function for both distances. The onlY significant difference at low freauencies between the two curves in each Plot is the
4 d
7 2 3 4X 5 6 7 8 9112 9
FREQUENCY IN CYCLES PER SECOND
%40
I
A\
1 6 8 1 2 3 4 5 6 748911 2 j2 .FREQUENCY IN CYCLES PER SECOND
Figure 4-2. Magnitude arn d Phase measurements of the
experimental speaker in an anechoic chamber. Top plot:
magnitude curves. Top curve: 100cm microphone to speaker
spacing. Bottom curve: 5cm spacinry- scale shifted bw 30 db.
Bottom Plot+' phase curves. Top curve+ 5cm spacing. Bottom curve* 100cm spacing.
del.aw. These Plots indicate that like a Point source, the loudspeaker has a far field transfer function which is the same as its near field transfer function at low freauencies,
where dimensions are small compared to a wavelenigth. The noise source, as discussed earliery mav not be Particularly well modeled as a Point source. However, anY
noise source mav be considered as a collection of Point sourcesy in which case, the effect of the attenuator is to trv to make the collection of nearby point sources and itself
into a dipole. Siznificant attenuation can be attained even when the noise source is not a point sourcer as is shown
theoretically in Appendix 2y and exPerimentally below. Assumins,~ for the moment, that the noise source is a
point source, then in order to make nfn(s) and rnfc(s)
identical, the distance from the microphone to each of the
sources must be the same, as shown in Chapter 3. This condition will ensure that the two transfer functions are
eaual.
The first condition, that nfn(s) = nfc(s), has been satisfied. The next, that H(s) be large, must be examined.
H(s) is the transfer function from the Pressure at the
microphone Position to the volume velocity of the attenuatin
loudspeaker. It includes the freauency response of the microphone, the electronicsy and the loudspeaker.
For the system under consideration, which is open loop stable, and whose ma!rnitude curve Passes through unity only
oncey or remains less than unity, each time the Phase curve Passes through 180 desrees, the closed loop system is stable
if the loop gain is less than unity at the freauencies where the phase Passes through 180 degrees. Both the microphone
and the loudspeaker contribute to the magnitude and Phase of the system, so models of these two devices must be obtained before the electronics can be designed.
The speaker used for the attenuator source was the same
one as used in the anechoic near field measurements discussed
above, As described in Appendix 3, measurements of the loudspeaker were made, and an electrical model was
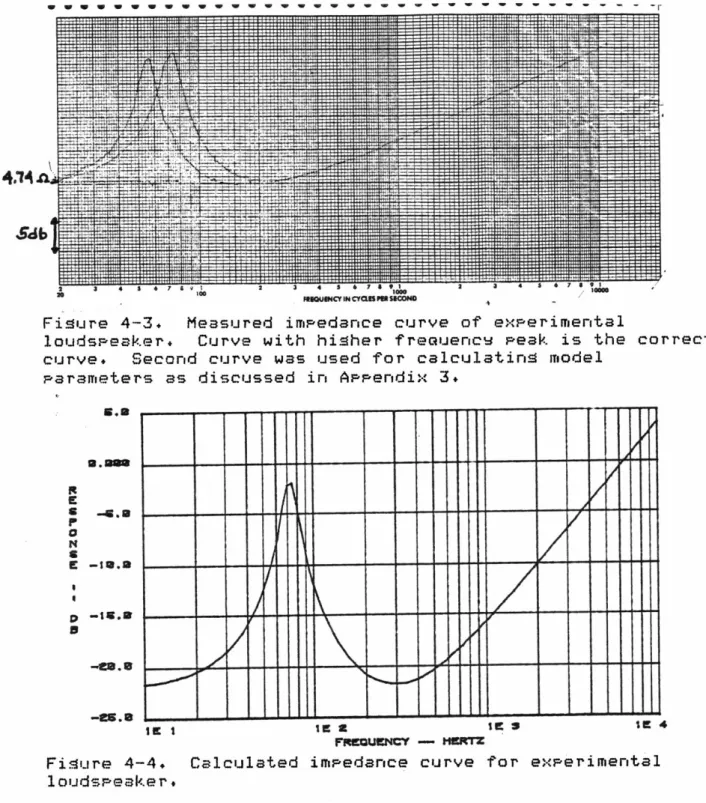
constructed, In order to verify the accuracv of the model, the measured driving Point impedance was compared to that predicted by the model. The computer circuit analysis Program, TWEAK, developed at Bose Corporation, was used to generate an impedance curve for this speaker model. This computed impedance curve matches Quite well the measured
impedance curve of the actual speaker, as shown in figures 4-3 and 4-4. The Primarv region of disagreement is in the high freauencY end, due to the skin effect in the speaker
Pole piece. Since this effect occurs onlw at freauencies above those of interest, it was left out of the model.
The analysis Program was also used to generate a gain
and Phase curve for the transfer function of the loudspeaker.
The input parameter is the voltage driving the speaker, and the output is the far field Pressure, which for freauencies
SSI'mu
4 5 .7 a 9a RMuOuCY mCyOUpusa9
Figure 4-3. Measured impedance curve of experimental
loudspeaker. Curve with higher freauencw Peak is the correct curve. Second curve was used for calculatin model
Parameters as discussed in Appendix 3.
K U ptm 0 N U 0 U 6.0 a *am
-..
-23.e3 -eS.8-4.
-
---i--
-for
---Figure 4-4. Calculated impedance curve for experimental
loudspeaker.
of interest, is Proportional to the near field Pressure, as
IC I I ax
FREQUENCY - HERTZ
verified in the experiment used to generate figure 4-2. The
plots are shown in figure 4-5, Listings of the computer
files used as input to the circuit analwsis Program are shown
The zero db level of the magnitude Plot is
4.74
$461
2 N .3 0 1 4te 3
in Appendix 5.
Pase -o.& -66.3 Rt -66.6 a N -, 66.3 D N -ISa.. -116,3 -1 ee.3 sum *a 166.3 s3,a
*Q.=W
-65.3P
M A a 6 Sp
F. P Zt LP X -t -.00001,
169 1E 1 1E it FREIUENCY - HEtWZ 1 3Figure 4-5. Calculated magnitude and Phase curves for
experimental speaker. Voltage applied to the speaker is the
inputy and far field Pressure is the output.
relative and does not refer to anw Particular level of
interest.
The microphone used in the exPeriments was a small (7 x 7 x 5mm) electret microphone with an integrated Preamplifier,
Knowles Electronics model CA-1832. The freauencv response of the actual microphone used was measured to verifv its
performance. The low freauencv cutoff of the microphone was found to be 25 Hz bv another investigator in the lab, and was confirmed using open loop gain and phase measurements of the completed svstem, A zero at the origin, and a real Pole at
25 Hz was added to the loudspeaker model to include the
effects of the microphone in the svstem. The computer
calculated magnitude and Phase response of these two elements is shown in figure 4-6.
The onlY remaining non-electronic element in the svstem was the air separating the microphone and loudspeaker. The
!ain of this element is a constant, depending on the
separation, but the Phase is a strong function of freauencv
due to the time delay. In order to model this delay, an all-pass filter was added to the computer model which, over the freauencies of interest, approximates the Phase response of the delav correspondinc to Scm of air. This distance was selected because it was thought to be representative of the twPical distance that might be used in a Practical system+ The resulting calculated gain and Phase curves are shown in
figure 4-7. The all-pass filter adds 180 degrees of Phase to the system that does not exist in the air Path. Thus, the phase angle marked zero degrees actuallv represents a Phase angle of 180 degrees. So, for stability, the electronics must have a gain of less than one at the freeuencies where
R P N S C -135.3 *-113e.3 *-115.3 -133.3 -I 36.3 -'133.3 A U 5 53.3 S 3 * 33 D a Se -63 E U-e~ -Ua~ 6-133.3
15 1
1 3
MO M
FREWuSNCY -- etr 19 I an 19 FRSOUSNCY -- HeURT?Figure 4-6. Calculated magnitude and Phase curves for
speaker and microphone.
a
the Phase curve crosses the zero degree line on these
computer Plots. This error continues for the remainder of
the computer generated Plots shown in this chapter.
In order to verifv the accuracv of the computer model, open loop gain and Phase measurements were made on the actual
-a3.3 ae~ R Ug -66.3 P -136.3 8-113.3 g-t 16.3 S-133s.3 P H 133.3 A 6 D E 6 -33 * -is. -333.3 lE t 13 N O=1 FRsEJICY -- HER'TZ In a In S rEWJENCY - MIERZ
Figure 4-7. Calculated magnitude and Phase curves for
speaker, microphone, and a 5cm air Path. Note that Phase curve is incorrect bw 180 deSrees as explained in the text,
swstem. The results of those measurements are shown in figure 4-8, and seem to match the computer model well, Particularly the two important Parameters of crossover
-I0
-20
-30
iqc
3 4 7 4191 2 . 3 4. 5.6p .76a 1 2 4 15 675 a2W .
FREQUENCY IN CYCLES
PER-Figure 4-8, Measured magnitude and Phase curves for speaker, microphone, and 5cm air path.
freauenc and maximum open loop gain.
The goal is to make the open loop gain as large as
Possible over as wide a freauencw range as possible while keeping the gain less than one where the phase crosses
throush 180 degrees. This goal can be achieved through the use of compensation in the electronics Path. After some
calculation and a series of trials, it was found that a
single real Pole at 25 Hz, and a double lead/las network,
Providing two real Poles at 80 Hz, two at 3000 Hz, and two real zeros at 160 Hz and two at 1500 Hz, seemed to Provide as
much open loop gain over as wide a freauencv as anv of the
other compensation schemes modeled on the computer. The open loop magnitude and Phase plots as calculated bv the computer are shown in figure 4-9. This compensation gives a maximum
open loop !ain which is 16 db above the sain at the crossover freauency with crossover occurins at 15 and 500 Hz.
One disappointment is the fact that the maximum open loop Sain is not as high as one might like, This open loop
Sain gives a measure of how much Pressure reduction at the microphone can be expected, which in turn, indicates the
amount of power reduction that can be achieved. This maximum
open loop Sain is limited bv the fact that the svstem :ain
must fall off asvmptoticallv no faster than second order, that is, 12db Per octavey at the crossover freauencies, in order for the svstem to be stable. So, in order to increase the maximum Iopen loop gain while keepinS a reasonable amount of Sain throughout the region between crossover freauenciesp
the crossover frenuencies should be separated as much as
possible. Bw Putting the low end crossover freauenc as low as possible and the high end crossover freauene as high as
'-I .3 1 - .3
a
* -. !3..3 S-ae~
w
..
s
n -$3. * A aa
e~
K~e --S~ 2 6-Im.e in 9 in a IFRUMKWWM - too=2 Figure 4-9. Calculated ma complete open loop system.gnitude and Phase curves for the
Possible, a higher maximum open loop gain can be achieved, and significant gain, and thus significant attenuation, can
occur over a wider band of freauencies.
However, several Phvsical constraints Prevent this
ltE1
13215
r2EmWY - HE1'7Z
improvement, On the hish end, the crossover freauencw can not be extended too far, since the Phase shift due to the time delav in air becomes significant and causes instabilitv.
500 Hz is a reasonable upper limit to the high end crossover freauenc. (At 500 Hz, 0.1 meters corresponds to a Phase
shift of 50 degrees, alreadw a significant fraction of the maximum allowable 180 degrees.) At the low end, however, it might seem that there would be no limitation to how low the
crossover freauencv could be set. Unfortunatel-, this
thought is incorrect. The svstem attempts to set the
pressure at the microphone to be zero. Below loudspeaker resonance, (which is approximatelv 80 Hz for the speaker used in these experiments) the speaker displacement must auadruple
each time the freauencw is cut in half for constant Pressure
output. So for each octave the cutoff fretuencv is
decreased, the speaker must be able to move four times as far. At some Point, the speaker becomes nonlinear, and additional displacement can not be obtained. Thus, a limit
on the low freauencv cutoff is imposed bv the Practical
constraints of the loudspeaker. This Problem is exacerbated
bw the high level of verv low frenuencw noise Present in most rooms, which sets picked up bw the microphone and fed to the speaker. Thus, even in the absence of anv noise sources to attenuate, the speaker maw be traveling bevond its linear
range.
Page
51
between 5 and 10 Hz, the low freauenc cutoff freauencv had
to be held above 10 Hz for the speaker used in these
experiments in order to avoid saturatin the speaker
displacement in normal operation. The low freauencv cutoff freauenc might be improved bv usinA a larger loudspeaker enclosed in a larSer box,. The larder loudspeaker would not
have to have as lons a linear travel in order to obtain the same volume velocity, and since its resonant freauencv would
be lower, the Problem of extendinA its response by increasin
displacement at decreasin freauencies would be less severe. However, as the speaker system becomes larder, the
attenuating source looks less and less like a point source,
which violates previously stated assumptions. For this
reason, the smaller, six inch speaker was used.
Another solution to the speaker displacement Problem is the use of a Port in the loudspeaker box# Such a port can
greatlv decrease loudspeaker displacement at the freauenc of the Port. However, such a Port would complicate the design of the servo-system, since below the Port resonance, the Port radiates, adding an additional source which must be taken
into account in the servo analysis. Also, the Port
introduces an additional 12 db Per octave rolloff in pressure response at low freauencies. AEain, this alternative was not
used in contrast to the simplicity of a sealed enclosurey which helps to limit extreme low freauencw excursion and decreases the Possibilitv of speaker damage due to excessive