The Design of a Gamma-Ray
for Detecting Mushy Zone in
Tomographic Sensor
Continuous Casting
by DongSik Kim
S.B., Mechanical Engineering, HanYang University (1994)
Submitted to the Department of Mechanical Engineering in Partial Fulfillment of the Requirements for the Degree of MASTER OF SCIENCE IN MECHANICAL ENGINEERING
at the
MASSACHUSETTS INSTITUTE OF TECHNOLOGY
June 1996
© 1996 Massachusetts Institute of Technology All Rights Reserved
Signature of Author:
Certified by:
Certified by:
Accepted by:
Department of Mech ical Engineering
(
May 31, 1996v
\,
Jung-Hoon ChunEdgerton Associate Professor of Mechanical Engineering Thesis Supervisor
(
S tiset, - Naninaji Saka Principal Research S ietist, Mechanical Engineering isor
OF VECHfNOLOIY
JUL 2 21996
Eng,
Srun i.
Sonin
Professor of Mechanical Engineering Chairman, Department Graduate Committee
UBRARiES
U?
The Design of a Gamma-Ray Tomographic Sensor
for Detecting Mushy Zone in Continuous Casting
by DongSik Kim
Submitted to the Department of Mechanical Engineering
on May 31, 1996 in Partial Fulfillment of the Requirements for the Degree of Master of Science in Mechanical Engineering
ABSTRACT
The y-ray tomographic sensor invented by the CastScan consortium at MIT for the non-invasive real time monitoring of the solidification front in the continuous casting of metals is a new industrial computed tomography (CT) tool. The sensor potentially offers great economic benefits to the continuous casting industry by preventing break-outs, and increasing productivity and efficiency through optimal process control.
In this thesis, the proposed concept was experimentally verified, based on radiation attenuation measurements, to prove its viability for determining the thicknesses of the liquid and solid sections of a solidifying metal, with a density difference as low as 7%. In addition, the preliminary experiments identified several fundamental factors that affect the operation of the sensor and which must be considered in the prototype design.
The y-ray sensor integrates numerous system components: the radiation source, detector array, actuators, and tomographic algorithms. Therefore, in developing an effective sensor that meets various industrial specifications, component design and system integration must be optimized.
A CT sensor was designed specifically for detecting the mushy zone in continuous casting. Through mathematical modeling of radiation attenuation through the liquid and solid phases, quantitative relationships among source strength, exposure time, and other critical system parameters were established. These relationships serve as a quantitative framework for the design of an industrial tomographic system. In addition, optimal spatial resolution and tomography techniques for identifying the mushy zone were investigated and confirmed by simulations using several critical parameters, such as the number of translational and angular steps. From these considerations, the approach of generating 3D tomographic image of density profile across the liquid-solid interface from radiation attenuation data offers a superior and more direct method than the conventional approaches.
In conclusion, the tomography system geared to mushy zone identification can serve as a standard model for the CT sensor. Furthermore, the guidelines developed in this thesis can be used to design the future generations of sensors for different applications.
Thesis Advisor: Jung-Hoon Chun
Title: Esther and Harold E. Edgerton Associate Professor of Mechanical Engineering Thesis Advisor: Nannaji Saka
Acknowledgments
It seems like yesterday that I dared to expand my career horizons at an American university, far from my home in Korea. Today, I find myself on the verge of graduation with a Master's degree. Without the generous support of many wonderful people I would not have been able to reach this goal. First and foremost, my appreciation goes to Professor Jung-Hoon Chun who not only gave me the opportunity to work on the CastScan project, but also provided me with invaluable support and guidance from the time I arrived at MIT in 1994. I would like to thank him for helping me navigate through the complexities of a new culture and through the academic regimen of MIT. A special appreciation also goes to Dr. Nannaji Saka for his commitment and academic guidance, and especially for encouraging me to finish my thesis this semester. I would also like to thank Dr. Richard Lanza for teaching me a new area of tomographic technology.
Also, my thanks go out to various MIT faculty and staff for their kind assistance including Jeff DiTullio, Fred Cote, Gerry Wentworth, Julie Drennan, Leslie Regan, Joan Kravit, and Leanna Harada.
I especially want to thank the students at the Laboratory for Manufacturing and Productivity for sharing their knowledge and ideas with me: Sukyoung Chey, Jeanie Cherng, Ho-Young Kim and Chen-An Chen. In particular, I would like to thank Pyongwon Yim for mentoring and helping me solve various problems. I would also like to thank Imad Jureidini, my labmate, for being "so nice" to me while sailing on the same ship, and Mark Hytros, my partner in crime on this project - I will always remember the outrageous fun we had in California.
All of my friends in the Korean Graduate Student Association, including Sooyung Lee and Henry Choi, have provided me with invaluable technical support for which I am truly grateful. Without all the information they shared with me, I would not have been able to make any progress.
I am deeply indebted to all of my professors at Hanyang University in Korea, especially to Professors Jangkeun Yim, Joosung Meang, Kyungjin Park, Wooseung Kim, Changsoo Han and Sungkyu Ha. My gratitude also goes to the SOME (Study Of Mechanical Engineering) fellows including Jangwook, Sungwook, Hyunjun, Jongsoo and Jaeheon, whose support and trust in me carried me through some grueling times at MIT.
Finally, my family deserves much gratitude for their love, trust, warm care, and generous support throughout my life. I especially thank my sister, Jungyeoun, for being patient with me while I worked toward this degree.
Table of Contents
Title Page Abstract Acknowledgments Table of Contents List of Tables List of Figures 1 INTRODUCTION 1.1 Background 1.2 Scope of Research 1.3 Outline2 CONTINUOUS CASTING PROCESS AND MUSHY ZONE 2.1 Continuous Casting Process
2.1.1 General process description 2.1.2 Future developments 2.2 Mushy Zone Research
3 THE PROPOSED CONCEPT AND PRELIMINARY EXPERIMENTS
3.1 The Proposed Concept
3.2 Theoretical and Practical Considerations 3.3 Apparatus
3.3.1 Source and detector
3.3.2 Data acquisition and control system
3.3.3 Reconstruction program and image display 3.3.4 Temperature measurement
3.4 System Calibration
3.6 Tomographic Imaging Experiments 3.6.1 System performance evaluation 3.6.2 Aluminum cylinder experiments 3.6.3 Tin cylinder in steel sleeve 3.6.4 Two-phase metal experiment
3.7 Summary
4 PRIMARY DESIGN CHARACTERISTICS FOR A HIGH-ENERGY
TOMOGRAPHIC SYSTEM 37
4.1 Source 37
4.1.1 y-ray source 37
4.1.2 High energy x-ray source 38
4.1.3 X-ray collimators 39
4.2 Detector 39
4.2.1 Detector characteristics 39
4.2.2 Scintillation detectors 41
4.2.3 Geometry of source and detector 45
4.2.4 Scatter radiation 45
4.3 Actuator 47
4.3.1 General configuration and evolution of the CT system 47 4.3.2 Characteristics of each generation and factors for suitable
choice 49
4.4 Data Acquisition System and CT Computer System 50
4.4.1 Data acquisition system 50
4.4.2 CT computer system 51
4.5 Computed Tomography 51
4.5.1 Advantages of CT over radiography 51
4.5.2 Beam geometry 53
4.5.3 Data requirements for proper CT image reconstruction 56
4.6 Image Quality 57
4.6.1 Spatial resolution 57
4.6.2 Contrast 59
4.6.3 Artifacts 60
4.7 Shielding 62
4.7.1 Primary shielding thickness 63
4.7.2 Secondary shielding thickness 63
5 COMPONENT DESIGN AND APPLICATION OF TOMOGRAPHIC
SYSTEM 65
5.1 Source Design 65
5.2 Detector Design 71
5.2.1 Detector efficiency 71
5.3 Exposure Time 78
5.4 Tomography System 81
5.4.1 Practical real time imaging techniques 81 5.4.2 Mushy zone analysis through tomography 84
6 CONCLUSIONS AND FUTURE WORK 89
6.1 Conclusions 89
6.2 Future Work 90
List of Tables
Table 3.1 Results of the spatial resolution and contrast resolution. 28
Table 4.1 Several gamma-ray radioisotopes. 38
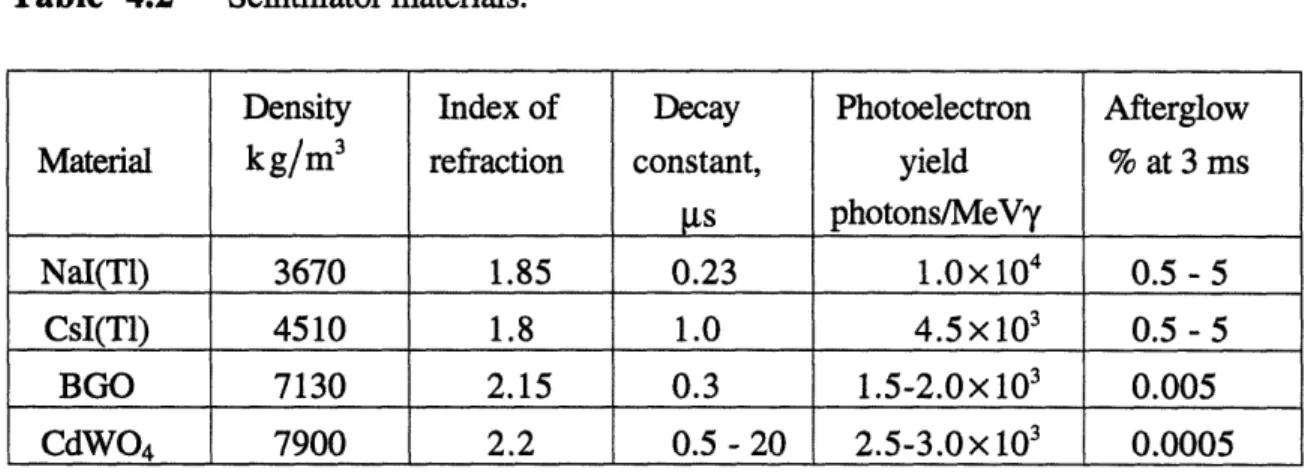
Table 4.2 Scintillator materials. 42
Table 4.3 Comparison of the performance characteristics of film radiography,
real-time radiography, and x-ray computed tomography. 52 Table 4.4 Comparison of fan beam geometry and the cone beam with
List of Figures
Figure 2.1 Schematic of continuous caster. 14
Figure 3.1 Attenuation coefficient versus energy. 19
Figure 3.2 Schematic of the proposed technique for detecting solidification
front. 19
Figure 3.3 Calibration experiment. 24
Figure 3.4 Experimental setup for 7-ray attenuation measurements. 25 Figure 3.5 Comparison of liquid path length by y-ray count and thermocouple
measurements. 26
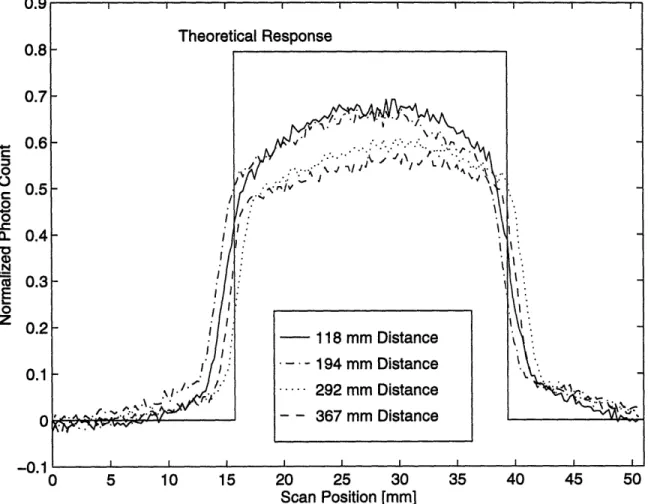
Figure 3.6 Comparison of the edge responses with theoretical prediction at
various source-to-object distances. 28
Figure 3.7 Reconstructed CT image of an aluminum block. 29 Figure 3.8 Reconstructed CT image of an aluminum cylinder. 30 Figure 3.9 (a) Diagram of tin cylinder in steel sleeve, (b) Reconstructed CT
image of a tin cylinder surrounded by a steel sleeve. 32 Figure 3.10 Schematic of two-phase metal experiment. 33 Figure 3.11 (a) Estimated solidification front position based on average
thermocouple measurements, (b) Experimental solidification front position based on CT image. Numbers on the right hand side
represent intensity. 34
Figure 4.1 Scintillation crystal-photodiode detector. 43 Figure 4.2 Relative importance of the three major types of y-ray interaction for
various energies. 46
Figure 4.3 CT scanning geometries: (a) Single-detector translate-rotate, (b) Multi-detector translate-rotate, (c) Rotate-only, and (d)
Stationary-detector rotate-only. 48
Figure 4.4 Parallel pencil beam scanner. 53
Figure 4.5 Single pencil beam with detector motion and rotating source. 54 Figure 4.6 Use of fan beams to produce tomographic images. Two positions
of the radiation source are shown producing overlapping beams for
Figure Figure Figure Figure Figure Figure Figure Figure Figure 4.7 5.1 5.2 5.3 5.4 5.5 5.6 5.7 5.8 Figure 5.9 Figure Figure Figure 5.10 5.11 5.12 Figure 5.13 Figure 5.14 Figure 5.15
The effects of beam hardening.
System performance graph of spatial resolution versus counts required in detector.
Schematic of voxel image.
System performance of spatial resolution versus photon flux at detector.
System performance graph of source strength versus photon flux. Theoretical detector efficiency.
Three-dimensional rendering of an anti-scatter collimator configuration.
Schematic of collimatior and detector set-up.
Detection efficiency as a function of angle with various changes of geometric parameter.
Comparison of point spread function between a collimated and uncollimated set-up.
Schematic of a target caster.
Example of practical real-time imaging technique.
Density map of the region A-A: (a) three dimensional density profile, (b) the density profile of one projection.
Sinograms of the object.
The reconstructed density profile: (a) three-dimensional density profile, (b) the density profile of one projection.
CHAPTER 1
INTRODUCTION
1.1 Background
In aluminum and steel industries, commercial size ingots/strands are commonly cast by continuous casting or by direct-chill casting process. In both processes, there is always a solidification front, i.e., a liquid-solid interface. The position and shape of the interface strongly depend on the heat flow rate out of the mold, the secondary cooling system, and the rate at which the strand is drawn from the caster. The shape and stability of the solidification front determine the casting rate and product quality. The velocity of the liquid/solid interface determines the microstructure and properties of the cast material. Thus, real-time tracking of the solidification front has a significant positive economic impact.
In the continuous casting process, the casting speed, i.e., the production rate, is largely limited by the strength of the solidified shell and by the location of the tip of the solidification front since partially solidified strands are continuously withdrawn through casters. Thus, a knowledge of the detailed shape of the liquid/solid interface on a continuous basis permits the operator not only to increase the casting speed by as much as 10 %, but to avoid break-out accidents. A typical steel casting plant has one break-out accident per month, which costs about $250,000 due to clean-up and lost production. While the economic significance demands a better sensor technology, at present there are no on-line sensors for monitoring the shape and position of the solidification front.
A new method for on-line measurement of solidification front for casting of aluminum alloys was developed by MIT. The proposed method uses high energy (5 to 10 MeV) y-rays generated by a compact, electron linear accelerator (LINAC) to measure the differences in y-ray transmissivity due to the density differences, typically 4 - 12 % higher for the solid compared with that of the liquid metals (Chun et al., 1995). The 7-ray sensor being developed at MIT integrates many components, such as a radiation source, detector, actuator, and tomographic device. In this integration effort, there are many variables for each components, such as source strength, actuation method, and detector type. Factors that determine the final configuration of the sensor include: spatial resolution, image contrast, signal-to-noise ratio, measurement time, and caster size. These factors
have a primary influence on the performance and cost of the sensor, as well as the method. Therefore, a working relationship between these controlling factors should be developed.
The solidification process of an alloy is characterized by the existence of a mushy zone, in which the solid and liquid phases coexist and it has a crucial role on the quality of metal product and the production rate. In this sense, the study of the mushy zone has well founded. To be sure, characterizing of the mushy zone may not be necessary just for monitoring the solidification front in continuous casting. However, characterizing the mushy zone should guarantee a satisfactory performance requirements. For this reason, mushy zone characterization is the upper bound goal.
Therefore, if a y-ray tomographic system is designed for detecting the mushy zone, it should serve as a standard model of the proposed sensor. Especially, for the first industrial application of the proposed sensor technology in a large caster, an actual aluminum foundry settings will be used as a prototype. Through this design process, as with every process following it, it is believed that the system configuration solution for future generations of this sensor in different plants and applications can be achieved.
1.2 Scope of Research
This thesis is divided into two main parts. The first part is the feasibility study, by several preliminary experiments, to test the viability of the proposed concept. In particular, the application of computed tomography (CT) for the identification of density variations is tested and the problems are analyzed. The second part comprises the design process. Criteria of the design and characteristics of the high energy CT application are addressed before the actual design. The component design and some useful computer tomographic
techniques are also conducted. The goals of this thesis are:
* Feasibility study of the CT system to detect the liquid/solid interface in metal solidification process,
* Identification and characterization of the critical parameters of the CT system,
* Investigation of the optimal spatial resolution to accurately identify critical solidification front characteristics, including mushy zone identification,
* Evaluation of the various tomographic techniques and trade-offs for optimal real-time monitoring of the solidification front,
* Design of the each components to meet the specification and integration of components for the optimal performance.
1.3 Outline
This chapter provides background and scope of the project. In Chapter 2, description of the solidification process anda brief review of the mushy zone research are presented. Chapter 3 gives the proposed concept of developing an on-line tomographic sensor for monitoring the solidification process. In addition, viability of the Computed Tomographic sensor is verified by the feasibility study by a set of preliminary experiments. In Chapter 4, prior to the design process, all the information are documented including the primary design characteristics and design criteria of the each components for high energy CT system and the fundamental issues which have to be considered in this application . Finally, Chapter 5 describes some useful design approaches, which need to be conducted in preparation for an actual industrial setting.
CHAPTER 2
CONTINUOUS CASTING PROCESS AND
MUSHY ZONE
2.1 Continuous Casting Process
Continuous casting is entering a new era of development, not only with respect to its increasing application in the production process, but also in its own evolution as a process and its interaction with other processes in metal manufacture. Continuous casting output has shown an accelerating growth. It is responsible for more than 50 % of current steel production in the world, and more than 80% in Japan. The principal advantages of continuous casting are a substantial increase in yield, a more uniform product, energy savings, higher manpower productivity, and reduced pollution. These advantages and the ease of integration into metal production systems have led to a wide application of the continuous casting process.
2.1.1
General process description
The purpose of continuous casting is to bypass conventional ingot casting and to cast to a form that can be directly rollable on finishing mills. The use of this process results in the improvement in yield, surface condition, and internal quality of product when compared with ingot-made material (Pehlke, 1992).
The sequence of operations of continuous casting is as follows: * Delivery of liquid metal to the casting strand,
* Flow of metal through a tundish into the casting mold, * Formation of the cast section in a water-cooled copper mold, * Continuous withdrawal of the casting from the mold,
* Further heat removal to solidify the liquid core by water spraying beyond the mold, and
* Cutting to length and removing the cast sections.
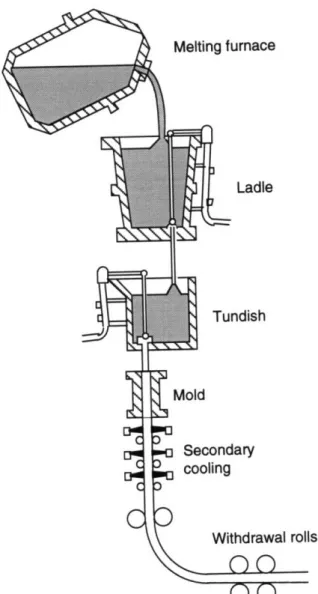
Schematic of a continuous casting machine is depicted in Figure 2.1. Molten metal in a ladle is delivered to a reservoir above the continuous casting machine called a tundish.
Melting furnace Ladle Tundish
2I
I Mold ,o Secondary . cooling Wltndrawal rollsFigure 2.1 Schematic of continuous caster.
The metal from the tundish flows into one or more open-ended, water-cooled copper molds which are controlled by a stopper rod-nozzle or slide gate valve arrangement. A dummy bar, i.e., a starter, is inserted into the mold in order to initiate a cast, and sealed to contain the initial flow of metal in the mold and to form a solid skin. After the mold has been filled to the desired height, the dummy bar is gradually withdrawn at the same rate that molten metal is added to the mold. The initial liquid metal solidifies onto a suitable attachment of the dummy bar so that the cast strand can be withdrawn down. Solidification of a shell begins immediately at the surface of the copper mold. The length of the mold and the
casting speed are adjusted such that the shell thickness is capable of withstanding the pressures of the molten metal core on exiting from the copper mold. Generally, the mold is
I
cy
oscillated and a lubricant is added to the mold during the casting operation to avoid sticking of the frozen shell to the copper mold. The rolls below the mold, where the secondary cooling is performed by spraying cooling water onto the strand surface to complete the solidification process, support the metal strand mechanically. After this process, the fully solidified strand is sectioned into desired lengths by a cut-off torch or shear. This final portion of the continuous casting machine also has provision for disengagement and storage of the dummy bar.
There are many types of continuous casting machines in use such as vertical, vertical with bending, curved or S-strand with either straight or curved mold, curved strand with continuous bending, and horizontal. Most of the original continuous casting machines for steel were vertical machines. Although more complicated in their construction, vertical machines with bending and curved strand machines were developed to minimize the height of the machine and allow installation in existing plants without modification of crane height.
2.1.2
Future developments
The emphasis on the further development of continuous casting will focus on monitoring and controlling the solidification process, with the objective of maintaining high quality and high productivity since the solidification process influences the final properties of the product and limits the product rate at which a solidifying strand can be extracted from a continuous caster. Accomplishing this includes monitoring metal quality and ensuring that all aspects of the process are under the proper control. Especially, when the extraction velocity is too high, the partially solidified shell will rapture, resulting in a "break-out" accident, whereby molten metal spills from the strand and the tundish into the work place. Break-out accident costs tremendously because production shutdown is required during the clean-up period. Therefore, developing a sensor to avoid the possibility of the break-out is strongly required.
2.2
Mushy Zone Research
Solidification of alloys is characterized by the existence of a mushy zone, in which the solid and liquid phases coexist (Flemings, 1974). It has been reported that transport phenomena (i.e., heat, mass transfer and fluid flow) in the mushy zone are the major cause
for the formation of casting defects such as segregation, porosity and hot tears (Flemings, 1974; Fisher 1981). In particular, the formation of macrosegregation (i.e., a large-scale non-uniformity in composition) in castings is caused by two processes occurring in the mushy zone during solidification (Flemings, 1974). The first corresponds to the floating or settling of solidified phases. The solidified phases could be equiaxed grains and/or broken dendrites in the mushy zone. The second mechanism is related to the flow of solute-rich or solute-poor liquid in the mushy zone. The fluid flow, in turn, can be caused by shrinkage and or thermal and/or solute gradients. A higher concentration of solute is found near the bottom surface of the casting in the unidirectionally solidified casting, which is called inverse segregation. It is a kind of macrosegregation caused by solidification contraction.
Many experimental and theoretical studies have been conducted on the segregation phenomenon (Scheil, 1947; Kirkaldy and Youdelis, 1958) to understand the mechanics of the mushy zone. The first rigorous model to predict the formation of macrosegregation was by Flemings (1974). The well-known "local solute redistribution" equation successfully predicts the formation of inverse segregation, centerline segregation, and the changes resulting from varying the cross-section of a mold. The solute diffusion, however, was neglected, and the thermal gradients and velocity distributions used in the analysis were either measured or assumed.
In the unidirectional solidification of Al-Cu alloys cooled from the bottom, the heavier copper species is rejected when the solid aluminum is precipitated, stable solute and temperature gradients are created, and no natural convection can be induced. Hence, the inverse segregation in the directionally solidified Al-Cu alloys cannot be predicted by the earlier models. It has been concluded that shrinkage-induced flow is dominant in the mushy zone compared with the natural convection due to temperature gradients (Chiang and Tsai 1992).
A key element of mushy zone modeling is the description of the microscopic evolution of the length-scales within the mushy zone and the influence of macroscopic transport processes. Glicksman et al. (1992, 1994) summarized some recent progress in the development of a mean-field statistical theory of phase coarsening in adiabatic mushy zones. Theoretical outcomes of their work were the development of temporal scaling laws for the length scales and determination of coarsening dependencies on material parameters and solid volume fraction. High precision thermal decay experiments have verified some aspects of the theory for mushy zones held under adiabatic conditions and integrating the microscopic coarsening theory within a simple macroscopic heat-transfer model of
one-dimensional alloy solidification demonstrated the influence of macroscopic heat transfer on the evolution of primary and secondary dendrite arm spacing in the Al-Cu alloys.
Diao and Tsai (1994) have developed a mathematical model to predict the formulation of macrosegregation for the unidirectional solidification of Al-Cu alloys. The model based on the continuum formulation allowed the calculation of transient distributions of temperature, velocity, and species in the solidifying alloy caused by thermo-solutal convection and shrinkage-induced fluid flow. It was found that two mechanisms in the mushy zone, i.e., the floating or settling of precipitated phases during the solidification process and the flow of either solute-rich or solute-poor liquid into the mushy zone contribute to macrosegregation. By comparing with experimental data, they proved that their model could accurately predict the formation of inverse segregation.
From the brief literature survey, it is apparent that the microstructure of castings greatly depends on what happens in the mushy zone. Solidification defects such as porosity, micro- and macrosegregation, clearly depend on the heat and mass transfer and fluid flow in the mushy zone. These transport processes, in turn, depend on the shape, size and velocity of the liquid/solid interface in continuous casting. Hence, the need for characterizing the mushy zone can not be overstated.
CHAPTER 3
THE PROPOSED CONCEPT AND PRELIMINARY
EXPERIMENTS
3.1
The Proposed Concept
The sensor method is based on the attenuation of high-energy y-ray photons through the solidifying strand as well as through any surrounding ancillary equipment. Possible radiation sources include radioisotopes, such as Co60 and a compact, electron
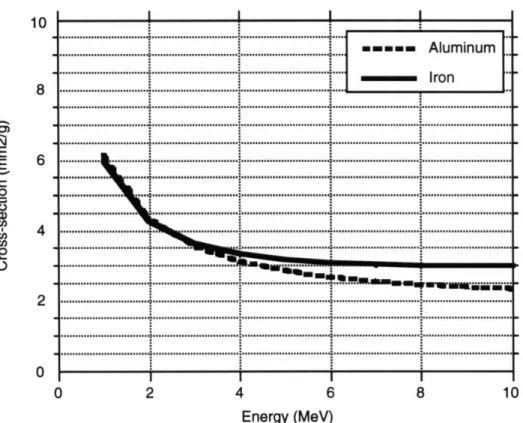
linear accelerators (LINAC), which are commercially available and produce a continuous energy spectrum up to 10 MeV. At these high energies, the attenuation of most metals is dominated by Compton scattering and is essentially independent of material type, instead determined almost completely by the density of the material (Evans, 1955). This is shown in Figure 3.1, in which the total cross-sections versus energy are plotted for aluminum and iron. Above 4 MeV, the curves flatten out, indicating the lack of energy dependence. The strength of the required radiation source, however, depends on the thickness and density of the strand being cast.
An on-line measurement technique for determining the shape and location of the solidification front is schematically presented in Figure 3.2 (Chun et al., 1995). Radiation from the source S is collimated to produce a narrow beam. The beam exits the aperture of the collimator and traverses the path S 1234D from the source to the detector array D. Along this path, the y-ray beam travels through air, the solidified metal (path 1-2), the liquid metal (path 2-3), the solidified metal again (path 3-4), and finally through air to the detector. During its travel, the photon beam is attenuated mostly by the solid and liquid metals, thus the detected beam intensity is less than the incident beam intensity. The mass attenuation coefficients of liquid and solid metal are the same, but their densities differ by about 6 % for steel and 12 % for aluminum. As a result, it is possible to calculate the path lengths of the beam through the liquid and solid phases in the strand.
By rotating and translating the source-detector array about the longitudinal axis of the solidifying strand, a complete profile of the solidification front can be mapped. A tomographic image providing a full three-dimensional solidification profile, including mushy zone density distribution within the strand, can thus be constructed using reconstruction techniques similar to those of computerized tomography used in medical imaging.
0 2 4 6 8
Energy (MeV)
Figure 3.1 Attenuation coefficient versus energy.
luisition
system
Schematic of the proposed technique for detecting solidification front.
The advantages of the proposed technique are obvious. First, this novel technique is non-invasive. Second, the speed of detection is relatively fast. Third, the composition of the liquid metal need not be changed for detecting the liquid/solid interface. Finally, the cast ingot need not be sectioned and prepared for metallographic examination for extracting information regarding the profile of the liquid/solid interface. These features make the proposed technique feasible for on-line measurement and control of the continuous casting operation.
3.2
Theoretical and Practical Considerations
Using the exponential attenuation relation, the number of y-ray photons, N, transmitted through the strand in a given time may be written as:
N = N exp{-(Yp,x, + ptx,)}+ fN, ,
or
N= No exp{-[psp(L - x,)+ppx,]}+ fNo , (3.1)
where N is the number of photons transmitted through the material subject to the radiation, N, is the number of photons incident, g is the mass attenuation coefficient, p, is the density of the solid, p, is the density of the liquid, L is the total path length through the strand (path 1-4), x, and xI are the path lengths through the solid and liquid portion, and
f is the fraction of the incident radiation that is forward scattered. Neglecting forward scattering, equation (3.1) can be rewritten as:
(No
I = p*p, - p1)x
1 - uP5L . (3.2)Thus, if scattering is not explicitly accounted for, i.e., if equation (3.2) is used instead of the more accurate equation (3.1), the increased number of detected y-rays due to forward scattering, the second term (jN,) in equation (3.1) will be ascribed to a reduced amount of attenuation and hence a smaller value for the mass absorption coefficient will be obtained. This effect will be most pronounced for thick absorbers where scattering will be the largest. By a combination of energy selection and collimation of the beam at the
detector, the scattered radiation can be reduced considerably. However, in the case of a continuous energy spectrum, only collimation can be used.
The mass attenuation coefficient, gt, is independent of the density and physical state of the material. It varies only as a function of the incident photon energy. Furthermore, since it is nearly constant in the range of the photon energy we use, as shown in Figure 3.1, rendering the ratio of the number of photons surviving through the material to the number of incident photons can be accomplished, Thus a simple and unambiguous exponential decay function of the distance, the distance of liquid and solid portion, can be readily calculated.
3.3
Apparatus
3.3.1
Source and detector
Among many gamma radiation sources, the Co60 radioisotope was used for the gamma radiation in the preliminary experiments. The source strength was 7 mCi and it produced the gamma photons at two distinct energies, 1.17 MeV and 1.33 MeV. The radioisotope was shielded in a cylindrical lead housing with a 6 mm diameter hole drilled through its side. This housing served as a pencil-beam type aperture and collimator for the gamma photons.
A single 100 x 100 x 100 mm Rexon Technologies model NAI4-4MX4-3 sodium-iodide (Nal) scintillation detector was used to collect the gamma photons. The output of the detector was amplified by a Canberra model 1412 research amplifier and connected to a
Canberra model 2037A edge/crossover timing counter. The detector was filled with a collimator of 2 mm diameter aperture size.
3.3.2
Data acquisition and control system
Since the photon flux from the Co60 source is relatively low, the photon count measurements were performed in a pulse mode. The photon count measurement program was written in C language. The signal output from the Canberra edge-crossover timing counter was connected to a Keithly-Metrabyte DAS-1601 analog-digital input-output board with a 12-bit resolution. The photon count was measured over a chosen count time and
incorporated in the data acquisition program. The test-object was moved relative to the y-ray source and detector.
The positioning stage comprised a motorized rotary table mounted on a motorized horizontal translation table, which in turn was mounted on a manual vertical translation table. The rotary table was a New England Affiliated Technologies RT-4-SM model with a 99 mm diameter platform. The minimum angular step size was 0.02 degree, with an accuracy of 180 seconds and a repeatability of 36 seconds. The horizontal translation table was a New England Affiliated Technologies TM-800-SM model with a travel span of 203 mm. The horizontal translation table had a resolution of 0.01 mm. These rotary and horizontal table were driven by a 5 volt, 0.353 N-m (50 oz-inch) stepper motor operating at 200 steps per revolution.
The vertical translation table was a Newport model 281 laboratory jack with a range of 76 mm and 3 mrad parallelism. Positioning was performed manually by turning the lead screw. The positioning stage was leveled and mounted so that the test object could be moved perpendicular to the path of the y-ray beam. The positioning stage control system comprised a NuLogic 2-axis NuDrive stepper motor amplifier and a NuLogic PCStep motion control board. The two stepper motors driving the rotary and horizontal positioning tables were connected to the amplifier and operated with the motor controller card. An open-loop control scheme was used. The appropriate motor was incremented by this amount at a preset velocity and acceleration. The system allowed the positioning stage to be moved in well-defined increments with respect to a fixed origin.
3.3.3
Reconstruction program and image display
Two-dimensional tomographic images of the test object were reconstructed using a Filtered Back Projection (FBP) algorithm in FORTRAN. The tomographic images were displayed and analyzed using a Matlab matrix manipulation software package. Both programs were executed on a Sun Sparcstation 5 computer with a UNIX operating system. The reconstruction program allowed the user to specify the cut-off frequency and the mathematical order of one of five filters (ramp, Hamming, Hann, Parzen, or Butterworth) for the FBP algorithm.
3.3.4
Temperature measurement
Since temperature measurements were required to locate the position of the solidification front, data acquisition was performed using Omega chromel-alumel (K-type) thermocouples in conjunction with a Keithly-Metrabyte DAS-TC data temperature measurement board. The software supplied with the DAS-TC board was used to record the temperatures, which were measured over the same time interval as the photon count and recorded in conjunction with a control program. The thermocouples had a diameter of 1.6 mm and a length of 203 mm. The thermocouple accuracy was 2.2 'C and the DAS-TC board accuracy was 0.05 'C.
3.4
System Calibration
The system was calibrated by measuring the y-ray attenuation through various known thicknesses of solid tin. The photon count was measured for beam attenuation though 10, 20, and 30 mm of tin with no collimator. Four trial experiments were performed and five samples were recorded, each over a 10 second interval, and averaged
for each experiment. Results of this calibration experiment are shown in Figure 3.3. The linear relationship between the natural logarithm of the normalized y-ray counts and the thickness of solid tin agrees well with equation (3.2). Using the calibration data and equation (3.3) below, the mass attenuation coefficient was calculated to be 0.00445 m2/kg.
In(Io/I)
Pexp = (3.3)
pxtin
This result was lower than the expected value of 0.00502 m2/kg for tin at a mean
Co60 energy of 1.25 MeV. This represents an error of 11.4 %. The lower than expected value for the mass attenuation coefficient is attributed to the detection of forward scattered radiation due to the use of an uncollimated detector. Since scattered radiation was present in the measurement, the measured photon count was higher than the normal transmitted photon count. If the value of I is higher than expected, the value of ln(l /I) is lower than expected, resulting in a lower value for the mass attenuation coefficient.
z
o" o -0. -1.( -1 • 0 10 20 30 40Thickness of Solid Tin, mm
Figure 3.3 Calibration experiment.
3.5
Gamma-Ray Attenuation Experiments
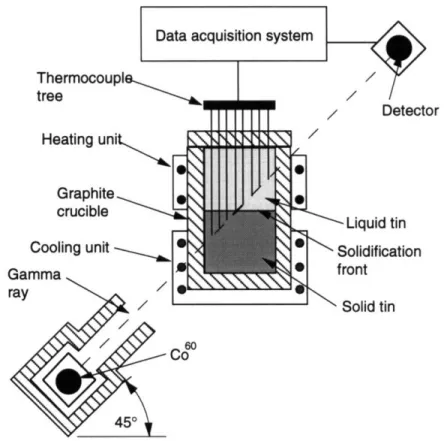
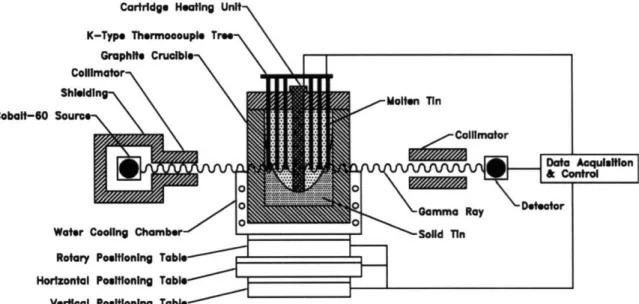
An experimental setup for the y-ray attenuation experiment, shown in Figure 3.4, was fabricated (Chun, 1995). A collimated beam (6 mm in diameter) of y-rays from a
Co6
o source, mounted on a steel platform at a 450 angle relative to the horizontal, was directed to pass through a cylindrical graphite crucible (50.8 mm I.D.) filled with pure tin (2,570 mm3). A Nal scintillation detector was also mounted at a 450 angle, in line with the photon beam. The crucible was heated at the top above its melting point by a band heater and cooled at the bottom by a water-cooled jacket. This selective heating and cooling allowed the tin to exist in the crucible in a steady two-phase state, i.e., as liquid and solid phases. Since the thermal conductivities of tin and graphite are relatively high, a stable, horizontal solidification profile was maintained. By varying the heating and cooling rates, the solidification front could be moved vertically. Thus, the '-ray beam could encounter various path lengths in the liquid and solid phases of tin.
A tree of 8 chromel-alumel (K-type) thermocouples with a horizontal spacing of 28 mm and an inclination of 450 was installed inside the crucible to lie in-line with the y-ray beam. The thermocouple-tree was used to monitor the temperature profile and thus to locate the position of the solidification front.
Ten sets of experiments were performed to determine the attenuation of the y-ray beam by the graphite crucible, liquid tin, various proportions of liquid/solid tin, and solid
tin. Concurrently, the solidification front was tracked by the thermocouple-tree. For each experiment, the transmitted photon count was averaged over a series of 10 samples and a different solidification front position was set, altering the liquid/solid fraction along the beam path. For each solidification front position, the y-ray counts were taken for 100 seconds. For solid and liquid tin, the counts were 7.84 x 10⁴ and 8.36 x 10⁴, respectively.
60
Co
Figure 3.4 Experimental setup for y-ray attenuation measurements.
The liquid path lengths were calculated by rewriting equation (3.2) as:
In(N/N,)
=
u(p -p,)'
(3.4)where N, is now the y-ray photon count with solid tin in the crucible. Normalization by
N, rather than by No accounts for beam attenuation by the walls of the crucible, the heating/cooling system, solid tin, and the forward scattered beam.
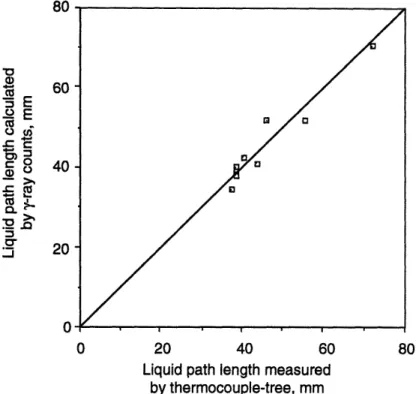
Figure 3.5 plots the liquid path lengths calculated with p, -pt=300 kg/m3 and I= 0.00502 m2/kg against those measured by the thermocouple method. Taking into
account the statistical error in the y-ray count and the errors present in the system, including misalignments of the y-ray beam with the thermocouple tree and the use of an uncollimated detector, it is apparent that the liquid path lengths estimated by the 7-ray attenuation method correlate well with those obtained by the thermocouple-tree technique. Consequently, the results provide the groundwork and motivation for further experiments of CT for determining the shape and location of the solidification front.
7E0 E
Cu
-r
20 40 60
Liquid path length measured by thermocouple-tree, mm
Figure 3.5 Comparison of liquid path length by y-ray count and thermocouple measurements.
3.6
Tomographic Imaging Experiments
Several experiments increased understanding of the performance characteristics of a tomographic imaging system. Identical equipment was used to conduct all experiments, including a first generation actuator for movements and a FBP algorithm for reconstructing tomographic images from the projected data. A ramp filter with a cutoff frequency of 0.9 was used in all image reconstructions. This type of filter and high cutoff frequency provided the best edge detection and spatial resolution.
3.6.1
System performance evaluation
Preliminary experiments for the evaluation of the CT system were conducted (Hytros,1996). Of particular interest is an edge response test to determine the spatial and contrast resolution of a uniform aluminum block tomographic image. The aluminum block was 24 mm x 24 mm and 53 mm long. Four different source-to-object (STO) positions (118, 194, 292, and 367 mm) were used for the experiments regarding the spatial and contrast resolution capabilities of the CT system. For each scan, a single projection was recorded by moving the block across the beam at 0.25 mm increments over the 51 mm span. The photon attenuation at each of 200 translational positions were recorded with each measurement taken over a 240 second count time. The photon attenuation of a projection versus position for the four scans is shown in the Figure 3.6. The photon attenuation has been normalized as:
Pn(r,0) = In(L = ppx (3.5)
The theoretical response was also calculated by equation (3.5) with the known properties of the aluminum block, such as the density (p=2780 kg/m3), the mass
attenuation coefficient (p=0.00550 m2/kg), and the thickness (x=53.3 mm). The maximum value represents the normalized photon attenuation through the aluminum block, while the minimum value represents the normalized photon attenuation through air. In addition, the rise and fall of the slope were referred as the edge response. Figure 3.6 compares the results of the four experiments with the theoretical response across the aluminum block. The theoretical response is approximately 16 % greater than the largest maximum average response for the four scans. The primary source of this error is attributed to the detection of scattered radiation which made I greater, lowering normalized projection value and contrast resolution.
The spatial resolution of the system was calculated by analyzing the slope of the edge response. For the theoretical response, the spatial resolution is infinitely small which results in the rise of vertical edge response since an infinitesimal beam width was assumed. However, the rise of edge response has a finite slope for the photon beam with a finite width.
The contrast resolution, which will be discussed in detail in Section 4.6.2, is proportional to the linear attenuation coefficient. Photon attenuation through the aluminum block decreases as the STO distance increases, thus the linear attenuation coefficient of
aluminum also decreases. The decrease in the linear attenuation coefficient with a translational position is a direct result of the detection of a larger fraction of scattered radiation. The calculated results of the spatial resolution and contrast resolution are listed in Table 3.1. 0 0
EE
0 z 0 5 10 15 20 25 30 35 40 45 50 Scan Position [mm]Figure 3.6 Comparison of the edge responses with theoretical various source-to-object distances.
prediction at
Results of the spatial resolution and contrast resolution. Source-to-object Average spatial Contrast
distance resolution resolution
(mm)
(mm)
(%)
367 3.2 148,787 292 3.2 157,171 194 4.4 176,830 118 4.8 180,877 Table 3.1 m -VU.I IAs determined by the edge response experiments, there is a trade-off between spatial resolution and contrast resolution of the CT system based on the STO position. The shorter STO distance produces better contrast resolution because of the lower amount of scattered radiation incident on the detector. However, the greater STO distance produces better spatial resolution.
Figure 3.7 Reconstructed CT image of an aluminum block.
Figure 3.7 shows a tomographic image of the aluminum block, which was reconstructed based on the 194 mm STO distance, resulting in a reasonable trade-off between the spatial and contrast resolutions of the system. A step size of 2.4 mm for transverse measurements and 2.5* for the view angles were used. The photon count time for each measurement was 240 seconds, producing a photon count range within the data set of 10820 to 21884. The block geometry is defined by some blurring along the edge. The dimensions of the block image are roughly 9 to 11 steps by 20 to 24 steps, which translates into a size of 23.8±2.4 by 52.4±4.8 mm. This compares quite well with the actual block size of 24 x 53 mm, and the expected spatial resolution of 4.4 mm. This initial CT reconstruction of an aluminum block verifies the ability of the experimental system to adequately reproduce an object of a known size and shape. In addition, the reconstructed image has a spatial resolution comparable to the previous experimental analysis. The
system performance evaluation therefore proves the functionality of the CT system and provides the basis for further object imaging.
3.6.2
Aluminum cylinder experiments
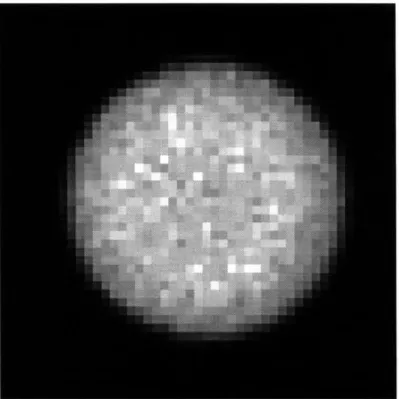
Before testing a graphite crucible filled with two-phase tin, or an object with a complicated internal structure, a uniform cylindrical object was reconstructed in the second CT experiment. The diameter of the aluminum cylinder was 64 mm and the STO distance was 215 mm. A step size of 1.9 mm was used for the transverse measurements and 2.50 for the view angles, resulting in the total of 47 transverse steps and 72 view angles. The ratio of No to N, was 1.53, just under the minimum specified value of 1.57 for proper reconstruction. The photon count time for each measurements was 240 seconds which produced a photon count range within the data set of 9770 to 21958.
Figure 3.8 Reconstructed CT image of an aluminum cylinder.
Figure 3.8 shows the reconstructed image of the aluminum cylinder. The outside diameter of the cylinder is roughly 33 to 35 steps, which translates into a size of 64.8±1.9 mm, matching well the actual cylinder diameter of 64 mm. The contrast between air and the aluminum is very distinct, although the image is not completely uniform within
the aluminum cylinder because of variations, attributable to the statistical error from the photon count and noise in the image. This results implies that the experimental CT system operated properly with no discernible artifacts in the image and that the image size accurately matched the actual dimensions of the cylinder.
3.6.3
Tin cylinder in steel sleeve
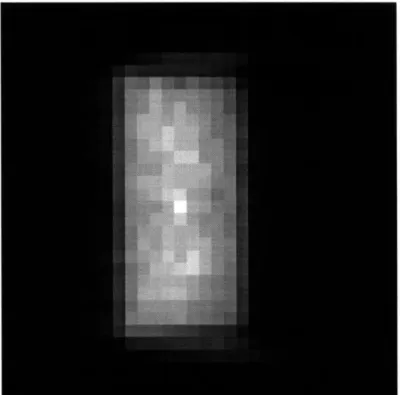
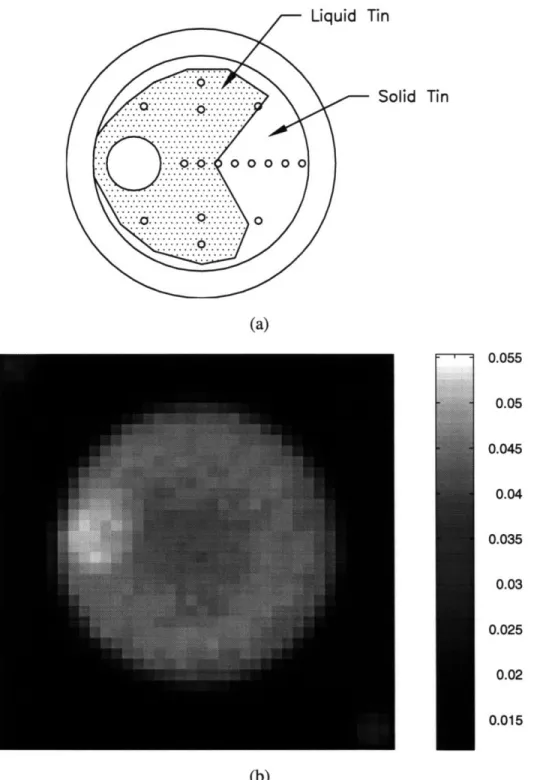
The third experiment involved CT reconstruction of an object, which had a solid tin core surrounded by a steel ring. Since the density difference between solid tin and solid steel is approximately 6 to 7 %, the same as the density difference between liquid and solid steel, the geometry of this test object is ideal for simulating the solidification front as if it were being continuously cast. The tin represents the liquid core of the steel. Consequently, the object shown in Figure 3.9 (a) serves as a valuable test for detecting 6 to 7 % density difference and resolve a discrete interface.
The diameter of the tin cylinder was 38 mm and the outer diameter of the steel annulus was 64 mm. The STO distance was 215 mm and all the step sizes were identical to the parameters used in the experiments of the uniform aluminum cylinder. The photon count time was 300 seconds, which produced a photon count range within the data set of 7049 to 36471.
Figure 3.9 (b) shows the reconstructed image of the steel annulus and tin cylinder. The outer diameter of the steel annulus was estimated roughly 33 to 35 steps and the interior diameter was 18 to 20 steps which translates to 64.8±1.9 mm for outer diameter and 36.2±1.9 mm for interior diameter, respectively. Although the interface between the steel and tin is blurry, the image still compares very well with the actual geometry of the system. This result confirms that the system can accurately detect and image the density difference of 6 % with a good spatial and contrast resolution even though this object did not contain the molten portions. However, due to the weak photon flux from the Co60 source,
the photon count time, i.e., the overall data acquisition time, had to be quite long to achieve good statistical data. This issue must be addressed in the design of the future system.
3.6.4
Two-phase metal experiment
The final experiment was to generate a CT image of the two-phase. It was set up as shown in Figure 3.10 and tested the feasibility of detecting the solidification front in a
11d steel Alid steel =7870 kg/m3) -64 mm - 38mm )olid tin07 .pkgr •)
(a)
Figure 3.9(b)
(a) Diagram of tin cylinder in steel sleeve, (b) Reconstructed CT image of a tin cylinder surrounded by a steel sleeve.
partially solidified casting. Pure tin was melted and poured into a graphite crucible. A cartridge heater enclosed in a copper sheath was mounted inside the crucible to melt a portion of the tin. After several heater positions were tested, an offset heater design was used for the final experiment. The crucible rested in a recess of a water-cooled aluminum chamber which solidified a portion of the tin inside the crucible. By varying the current to the heater and the water flow rate to the pressure vessel, the amount of liquid tin in the crucible, and thus the position of the solidification front, could be varied. A set of 16 chromel-alumel thermocouples was mounted inside the crucible and used to monitor the location of the solidification front.
Cartridge Heating Unit K-Type Thermooouple Tree-\
Cobalt-Figure 3.10 Schematic of two-phase metal experiment.
When the solidification front of the two-phase tin reached a quasi-steady state, the CT scans were begun with a STO distance of 215 mm, resulting in a total of 67 steps with the 1.9 mm step size for the transverse measurements and 60 view angles with 30 step size for the angular measurement. Even though the ratio of No to N, was less than ideal due to an extremely long data acquisition time and the instability of the two phase state maintenance. A photon count time of 300 seconds produced a photon count range within the data set of 4629 to 25220, resulting in a photon count error of 0.63 to 1.47 %. During the course of the data acquisition, the temperatures of the 16 positions were recorded by the thermocouple at each photon count measurement as shown in Figure 3.11 (a). Because the data acquisition period for this experiment was 14 days, there must have been a tremendous amount of temperature fluctuation which significantly altered the location of the
solidification front over the course of the experiment. However, by taking the average of the thermocouple measurements, an estimate of the time-averaged position of the solidification front was made.
Iin Solid Tin
77--
0.055 0.05 0.045 0.04 0.035 0.03 0.025 0.02 0.015 (b)Figure 3.11 (a) Estimated solidification thermocouple measurements, position based on CT image represent intensity.
front position based on average (b) Experimental solidification front . Numbers on the right hand side
I : .. :A
Figure 3.11 (b) shows the reconstructed CT image of two-phase tin experiment with only the material inside the crucible as compared with an estimate of the liquid tin pool size based on the time-averaged thermocouple measurements. Comparison of the two images reveals a smaller liquid pool size present in the CT image than predicted by the thermocouple measurements because there were several sources of error. The largest source was the fluctuation in melt temperature because of the extremely long data acquisition time, for it is difficult to maintain a constant melt temperature even with a temperature controller. The second source of error was poor statistical count. The last source of error was undersampled data set which was deemed acceptable for the experiment since a higher ratio of the view angles to transverse scans would have further extended an already long data acquisition time. Because the experiment was plagued with many sources of error, the position of the solidification front could not be properly validated using the thermocouple measurements. However, a contrast difference in density between the liquid and solid tin phases inside the crucible is apparent.
3.7
Summary
Through the preliminary experiments, several findings and limitations of the CT system have been observed and the following conclusions can be made:
* Based on the Gamma-Ray attenuation experiment, the proposed concept of the radiation attenuation measurements is a viable method of determining the thickness of liquid or solid section of a solidifying casting.
* Comparison of the actual objects with the reconstructed images of an aluminum block, an aluminum cylinder, and a tin/steel composite cylinder confirms that the CT system can detect a density difference of 7 %.
* Despite a great deal of temperature fluctuation due to a long data acquisition time and a set of undersampled data, the reconstructed image of the two-phase tin shows a time averaged position of the solidification front and distinguishes a 4 % density difference between the liquid and solid phases.
* Due to the low photon flux produced by the Co60 radioisotope, this system does not
have real-time capability. Alternatively, the use of a source with a large flux, such as an x-ray linear accelerator (LINAC) will dramatically decrease data acquisition time, possibly to the point of real-time performance.
* Applying a new reconstruction algorithm with limited view angle data may speed up the processing time when combined with known parameters, such as material density and geometry, which may make the real-time detection system viable.
CHAPTER 4
PRIMARY DESIGN CHARACTERISTICS FOR A
HIGH-ENERGY TOMOGRAPHIC SYSTEM
Having satisfactorily demonstrated the feasibility of real-time monitoring of a continuous casting process by the computed tomography (CT) technique in Chapter 3, we now delve into the specifics of a generic tomography system. The fundamental issues and various design alternatives are present for each component, along with their performance. This chapter will provide a wide range of specifications for future reference and characterize the critical parameters of the CT system.
4.1
Source
The three types of radiation source typically used in industrial CT are x-ray tubes, y-ray sources, and high-energy x-ray sources such as linear accelerators. An ideal radiation source should provide a high-intensity beam of x-ray photons at a single energy or optimum spectral spread, emanating from a very small area with an energy capable of transmitting a reasonable fraction of the x-rays through the object being scanned. Each of the three source types has advantages and disadvantages for use with our system, and would require careful optimization for practical application. A comparison of the candidate sources follows.
4.1.1
y-ray source
A major advantage of a y-ray source over an x-ray source is that the high-energy photons produced by the y-ray source are at specific energies, or wavelengths, while an x-ray source produces photons over a wide spectrum of wavelengths. On the other hand, the primary disadvantage of a y-ray source is the limited radiation intensity, as measured in number of photons produced per second. That is, the source strength is relatively weak. While the intensity can be increased by using more radioactive material, this requires a larger radioactive source, which adversely affects the spatial resolution of the tomographic
image. Also, because the energy of a y-ray source is dependent on the type of isotope, the effective energy cannot be readily varied to suit the imaging system.
Table 4.1 Several gamma-ray radioisotopes.
Isotope Energy [MeV]
Cobalt 60 1.33, 1.17
Cesium 137 0.66
Iridium 192 0.31, 0.47, 0.60
4.1.2
High energy x-ray source
The key characteristics of a high energy x-ray source include: operating voltage
range, effective size of the focal spot, and operating power level. These characteristics are
important in both radiography and CT. Stability of the x-ray source is especially important in CT. Voltage variations are particularly disruptive because they change the effective energy of the x-ray beam and consequently cause image artifacts. Current variations are less of a problem because x-ray intensity fluctuations can be monitored by reference
detectors.
Some advantages of using a high-energy linear accelerator system in lieu of an isotopic sources such as Cobalt 60 or Iridium 192 include shorter exposure time, better image quality, and improved safety due to the absence of radioactive materials. The shorter required exposure time possible with a high energy linear accelerator compared with Co60
radiographs can be attributed to its higher penetrating energy and radiation intensity. For instance, MINAC 6, a 6 MeV accelerator operating at 300 rad per minute @ 1 meter with penetrating power equivalent to 20,000 Ci Co60, can produce high-quality radiographs
through up to 356 mm (14") of steel or up to 1,575 mm (62") of concrete. The practical limits of penetration using Co6° are much lower, at only 152 mm (6") for steel and about 457 mm (18") for concrete. Penetrating thicker sections with Co60 requires much shorter
focal distances, which results in image quality degradation, and excessively long exposure times. The MINAC also has a smaller focal spot size (1.7 - 2.0 mm for MINAC versus 5.0 - 10.0 mm for Co60), yielding images with sharper edge definition and better contrast (Schonberg Radiation Corporation, 1991).
Accurate and repeatable dose exposure is another advantage of a high-energy linear accelerator. Its inherent design is well suited for controlled exposure, with a dosimetry system that measures output dose rate at the x-ray target as well as total dose to the detector. This minimizes the number of trial exposures and enables easy exposure repeatability. Since the output dose rate at the target side diode sensor can be varied from 10 to 100% of the maximum controlling pulse repetition rate, total dose information from the detector-side ion chamber sensor is used to switch the machine off when the selected exposure level has been attained.
4.1.3
X-ray collimators
Collimators are radiation shields with open apertures that shape the x-ray beam striking the object and the detector. For CT systems, the radiation field is typically a thin fan beam wide enough to cover the linear detector array past the object being scanned. A collimator is located between the x-ray source and the object to shape the beam. Normally, a second collimator is also placed between the object and the detector array to further define the object volume being sampled. One or both of the x-ray collimators may have adjustable slot spacing to permit operator selection of the slice thickness. One of the benefits of using a thin fan beam of radiation for CT and Digital Radiography (DR) imaging is that most of the radiation scattered by the object misses the detector array and will not measured. This improves the quality of the measured data over those obtained by large-field radiography. Systems that use sparsely spaced detectors, such as multi-detector translate-rotate systems, may also have detector aperture width collimators. These collimators reduce the effective size of the detector element, thus improving the resolution of the transmitted data.
4.2
Detector
4.2.1
Detector characteristics
The ability to measure the transmitted x-ray intensity precisely and efficiently is critical to x-ray tomographic imaging. Features of the detector that are important to imaging performance are efficiency, size, linearity, stability, response time, dynamic range, and effective range of energy (Dennis 1992).
Detector efficiency is a quantitative measure of the effectiveness of the detector for intercepting, capturing, and converting the energy of the x-ray photons into a measurable signal. This efficiency is the primary factor in the image quality for a given x-ray source and the exposure time required to collect a sufficient amount of radiation. There are three distinct detector efficiencies: geometrical efficiency, collection efficiency and conversion efficiency. The geometrical efficiency is the fraction of the transmitted beam passing through the measured slice volume that is incident on the active detectors. It is equal to the active detector element width in the plane of the slice divided by the center-to-center spacing between detector elements. Collection efficiency is the fraction of the energy incident on an active detector area that is absorbed in the detector. It is dependent on the atomic number and density of the detector material and on the size and depth of the detector. Likelihood of detection decreases when x-ray photons pass through the detector without interacting or when the photon energy is lost due to scatter or characteristic x-ray emissions from the detector material. The third detector efficiency is conversion efficiency, which is the fraction of absorbed energy that is converted into a measurable signal.
Detector size consists of its width and height. The detector height determines the maximum slice thickness that can be measured. Increasing the slice thickness increases the collected x-ray intensity, thus reducing the image noise, but decreases the z-axis (interplane) resolution and may increase volume blurring and volume artifacts. The measured slice thickness is adjusted by the thickness of collimators that are less than the height of detector. The detector element width is a factor in determining the planar resolution of the tomographic image.
Detector linearity is the ability to produce a signal that is proportional to the incident x-ray intensity over a wide range of intensities. Detector stability is the ability to produce a consistent response to a signal without drifting over time, i.e., repeatability. To obtain solid channel-to-channel uniformity, consistency in signal response, noise, aperture size, and other characteristics are necessary for each detector element. These parameters are important in the tomographic detector selection process to produce consistent data set required for image reconstruction.
Detector response time is the time required for the signal to effectively settle without being significantly influenced by prior incident intensities. The response time is a critical factor in determining how rapidly independent samples can be collected.
Dynamic range is the range of intensities over which accurate measurement can be made. It is usually specified as a ratio of the maximum to the minimum signal output. The minimum signal output is limited by the electronic noise of the detector and its electronics. The level of electronic noise determines how the minimum signal can be effectively