Design and Development of an Automated
Inspection System for Vials
by
Siyang Liu
B.S. Mechanical Engineering, University of California, Berkeley (2018)
Submitted to the Department of Mechanical Engineering
in partial fulfillment of the requirements for the degree of
Master of Engineering in Advanced Manufacturing and Design
at the
MASSACHUSETTS INSTITUTE OF TECHNOLOGY
@
Siyang Liu, MMXIX. All rights reserved.
The author hereby grants to MIT permission to reproduce and to
distribute publicly paper and electronic copies of this thesis document
in whole or in part in any medium now known or hereafter created.
Signature redacted
A uthor ...
...
Department of Mechanical Engineering
Signature redacted
August
15, 2019
Certified by....
...
David E. Hardt
Professor of Mechanical Engineering
Ralph E. andFIM b -oss Professor in Manufacturing
Signature redacted
Thesis Supervisor
Accepted by ...
...
MASSACHJUSETTS INSTITUTE
Nicolas Hadjiconstantinou
OF TECHNOLOGY >
77 Massachusetts Avenue
Cambridge, MA 02139 http://Iibraries.mit.edu/ask
DISCLAIMER NOTICE
Due to the condition of the original material, there are unavoidable flaws in this reproduction. We have made every effort possible to
provide you with the best copy available. Thank you.
The images contained in this document are of the best quality available.
MITLibraries
Design and Development of an Automated Inspection System
for Vials
by
Siyang Liu
Submitted to the Department of Mechanical Engineering on August 15, 2019, in partial fulfillment of the
requirements for the degree of
Master of Engineering in Advanced Manufacturing and Design
Abstract
Automated inspection systems are powerful tools that can significantly reduce risk and maintain product standard. At Waters Corporation, the existing packaging process of a certain vial product relies mainly on manual labor. Designing an automated packaging machine is believed to greatly improve both packaging speed and quality. To ensure that the packaging machine produces proper packages, an automated inspection system is designed as the last stage of the packaging machine. Inspection is based on computer vision and image processing enabled by Raspberry Pi and OpenCV. The proposed algorithm is designed to determine if the proper number of vials are present in each package.
Moreover, a data-logging and data-transfer channel is developed between the ma-chine and Waters Corporation. Some basic Industry 4.0 features are also loaded so that machine status and operation data can be access remotely in real time.
This thesis presents an overview about the automated inspection system, details about the computer vision algorithm as well as the industry 4.0 feature. For other subsystems, please refer to other theses from the 2019 MIT Master of Engineering in Advanced Manufacturing and Design Cohort.
Thesis Supervisor: David E. Hardt
Title: Professor of Mechanical Engineering
Acknowledgments
The project is never possible without the help from many people along the way. I would like to take the opportunity to thank each and every one of them for making it happen.
First, I want to thank my parents, Jin Yang and Maodun Liu, for filling our family with love. You two are my first teachers, and have been my mentors throughout my life. The educative environment you carefully crafted for me is the foundation of everything I experienced and learned. Thank you for always being there for me with guidance and support. I would never have been able to reach MIT without you.
I want to thank my teammates on the project team, Efstratios Moskofidis, Steven Ratner, Diarny Fernandes, and Zhengyang(Paul) Zhang. We were able to work closely together and carry the weight of the project together. It is the combined skills and hard work of all of us that made this project come to fruition.
Professor David Hardt, our thesis advisor, provided us with precious advise and suggestions throughout the project. The crucial input from you helped us overcome many challenges.
Professor Alexander Slocum completely revamped my methodology of mechanical design. You passed to us your profound knowledge on machine design, which has proven useful in many scenarios in the project. I am sure I will continue to benefit in my future career.
At Waters Corporation, our sponsor company, Gabriel Kelly and Jason Dion gave us open doors and open minds at all times. Your accommodating project timeline really facilitated the progress of our project
Lastly, I want to thank the rest of the Master of Engineering cohort: Bowen Zeng, Dehui Yu, and Jessica Harsono. You are my closest friends at MIT. I am glad to be able to spend a whole year full of joy and laughter with you.
Contents
1 Introduction 13 1.1 Motivationsfor Automation . . . . 13 1.2 O bjectives . . . . 14 1.3 Project Scope . . . . 15 1.4 WorkDistribution. . . . . 16 2 Automation 17 2.1 What is Automation . . . . 172.2 Why implement Automation . . . . 18
3 System Overview 19 3.1 Centrifugal Bowl Feeder . . . . 21
3.2 Transfer Line Feeder . . . . 21
3.3 Vial Placement Mechanism . . . . 22
3.4 Motor Selection & Programming . . . . 22
3.5 Automated Inspection System & Connectivity . . . . 23
4 Automated Inspection System Overview 25 4.1 System Functional Requirements . . . . 25
4.2 Hardware setup . . . . 26
4.3 Software Architecture . . . . 30
5 Vision Algorithm Development 33 5.1 Background . . . . 33
5.2 PatternMatching . . . . 34
5.3 HoughCircle Transform . . . . 37
6 Connectivity 45 6.1 Why Machines Need Connectivity . . . . 45
6.2 Modes of Communication : Ethernet & WiFi . . . . 47
6.3 Modes of Communication : 2G/3G Connection . . . . 49
6.4 Communication Protocol . . . . 50
7 Conclusion & Future Work 53 7.1 Conclusion . . . . 53
7.2 Future W ork . . . . 54
List of Figures
1-1 Side view of a 350 pl QuanRecovery vial. . . . . 14
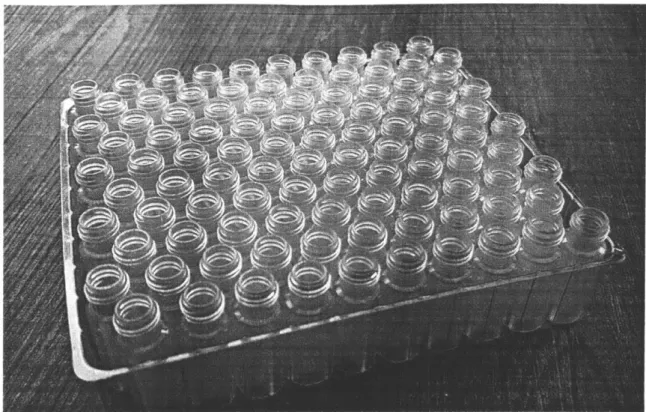
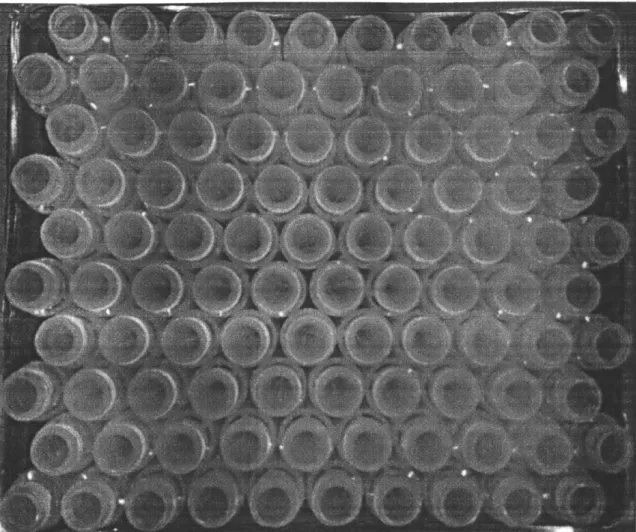
1-2 A package containing 100 1ml vials with
QuanRecovery
coating. . . . 153-1 Functional automated packaging machine prototype . . . . 20
4-1 Raspberry Pi 3 Model B+[5] and NoIR Infrared Camera Module[6] . 26 4-2 Particle Boron 2G/3G Development Board with Cellular Flex Antenna[7] 28 4-3 WS2812B LED Stripe with Light Diffuser[8] . . . . 29
4-4 Two different light setups: side light and back light . . . . 31
4-5 Algorithm Logic Flow Chart of Automated Inspection System . . . . 32
5-1 Image Mask for template-matching. . . . . 35
5-2 Six Methods Implemented in matchTemplate function in OpenCV[12]. 36 5-3 Data from Template-matching Algorithm. . . . . 37
5-4 Test Images with Back Lighting . . . . 40
5-5 Test Images with Side Lighting . . . . 41
5-6 Hough Circle Transform Results on Back Light Images . . . . 42
5-7 Hough Circle Transform Results on Side Light Images . . . . 43
6-1 Nine Core Technologies of Industry 4.0 by BCG [15] . . . . 46
6-2 wpasuplicant.conf File. . . . . 48
A.i A.2 A-3 A.4 57 59 61 63 generateM ask.py . . . . patternM atch.py . . . . houghCircle.py . . . . smtpSend.py . . . .
Listings
Chapter 1
Introduction
1.1
Motivations for Automation
The analytical laboratory instrument manufacturing company, Waters, produces a comprehensive range of system solutions for the life sciences industry. Liquid chro-matography and mass spectrometry machines are the center of Waters' product offer-ing. As a holistic supplier of its services, Waters provides auxiliary goods to support its laboratory instruments.
One such auxiliary product, QuanRecovery, was introduced to the market in Q2, 2019. QuanRecovery minimizes the effect of sample loss due to non-specific binding and ionic interactions through a proprietary surface coating. This coating is placed on the interior surface of 1ml vials, shown in Figure 1-1, that are sold to laboratories in the United States. Through a successful marketing campaign, propelled by the addition of free chemistry socks with every order, a well-known favorite amongst scientists and procurers alike, Waters' attained of their forecast sales within the first month.
Waters sells the 350 pl vials in packs of 100, as shown in Figure 1-2. Experimen-tation indicates that a regular human worker takes 2 minutes to package 100 vials by hand. With an estimated labor rate of 15 dollars per hour, close to 0.5 dollars per pack could be eliminated with an automated system. Additionally, the human packagers have been known to input 99 vials instead of 100 vials, leading to increased
Figure 1-1: Side view of a 350 pl
QuanRecovery
vial.probability of breakage during transit. Due to the uncertainty of vial count, Waters is forced to label the packages as having 'Approximately 100' vials instead of '100' vials.
The downsides of Waters' current packaging methods prompted the company to enlist help from the 2019 MIT MEng cohort to develop an automated solution that would robustly place 100 vials into each container. This thesis describes the solution that was created to replace Waters' human packaging system.
1.2
Objectives
The project proposed to design an automated system that would take the input of loosely bagged vials and correctly place them facing upwards in groups of 10 by 10 to fill a 100-vial container in a repeatable manner. The key objectives were as follows:
Figure 1-2: A package containing 100 1ml vials with QuanRecovery coating.
- Package a minimum of 100 vials per 2 minutes.
- Minimize external particulate from accumulating within the vials.
- Validate that 100 vials are placed into each package.
- Keep development and production costs under $10,000.
1.3
Project Scope
The project scope was contained to developing and building a functional prototype, that could be used to demonstrate the potential for the proposed automated machine. Once the prototype was complete and working, engineering drawings of each custom component were made along with an assembly and user manual. This way, Waters could manufacture and operate future iterations of the machine as production levels deemed necessary.
1.4
Work Distribution
The system was split into five main subsystems as listed below: 1. Orienting the vials from a bulk unorganized state.
2. Feeding the oriented vials into the packaging mechanism through a transfer line. 3. Packaging the vials into trays.
4. Motor selection and control.
5. Automatically inspecting the packaged vials to ensure they are correctly pack-aged.
Initially, all of the group members worked on each of the tasks together. However, after the inceptive brainstorming stage was complete, the five tasks were split between each of the teammates for the sake of efficiency. The owners of each task are as follows: (1) Zhengyang Zhang, (2) Efstratos Moskofidis, (3) Steven Ratner, (4) Siyang Liu, (5) Diarny Fernandes.
Chapter 2
Automation
2.1
What is Automation
In the history of the manufacturing industries, the transition from hand-made to automated work has taken many forms and bloomed over the last quarter-century. Currently, buzzwords such as machine learning, data analytics, artificial intelligence and the Internet of Things
(IoT)
are redefining what popular belief would have once suggested was the face of automation: robotics. Even over the last five years many questions have been raised on what truly defines automation and where it is going. In the workplace there are concerns over the ethics of replacing the human being with a machine. In the home there is concern over data collection and privacy, where both logical and physical machines are recording what we say, tracking products and services we prefer, and tailoring the media we consume to our analyzed behaviors. It is easy to get lost in the many thousands of online articles warning of the impending danger of becoming a more mechanized civilization. However, from the perspective of an engineer, we must see the state of the art for what it is in order to extract from the hysteria the truly plausible implications of increasing automation.For the purposes of this thesis, we will define automation as the use of a computer-guided mechatronic system to perform a physical task with little to no human inter-vention. The system may also collect data on its environment and respond to stimuli in that environment. However, it is not necessary for the system to do so in order to
abide by this crude definition of automation. In this thesis we will focus specifically on what the human being relies on the machine to do and what types of mechan-ical intervention can be considered automation by this definition. We will explore the motivations for implementing physical automated systems on the factory floor and not software-only solutions such as data analytics and machine learning. These are for another technical discussion that is out of the scope of this particular thesis. For more detailed work on Industry 4.0 integration for this project, please refer to Chapter 6 of this thesis.
2.2
Why implement Automation
Increasing throughput, reducing injury from repetitive motions or boredom, and mak-ing manufacturmak-ing less costly may immediately come to mind as the main motiva-tions for the manufacturing industry to implement automation. With a computer-controlled machine the benefits are nearly immediate to understand: the company no longer has to pay an employee's hourly wage, insurances or other benefits just so he or she can continuously perform a single task or flow of tasks. The employee may then seek more engaging, personally fulfilling or challenging work.
Chapter 3
System Overview
The vial packaging system is separated into the following five modules:
1. Centrifugal Bowler Feeder
2. Transfer Line Feeder
3. Vial Placement Mechanism
4. Motor Selection& Programming
5. Automated Inspection System & Connectivity
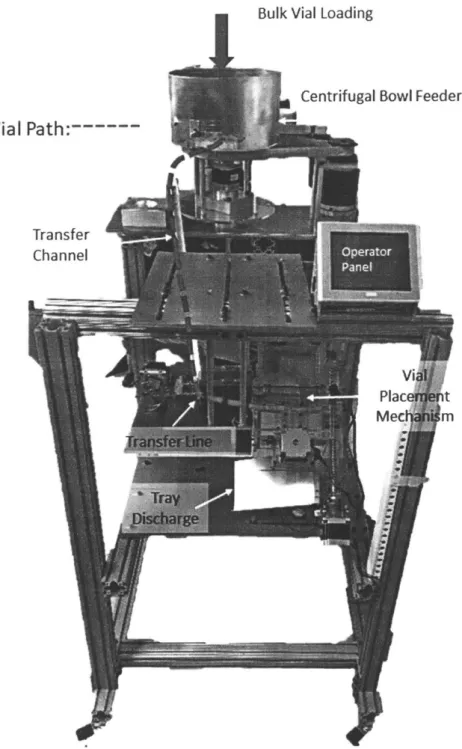
Each of the five modules is discussed individually in the following sections. The final prototype is shown in Figure 3-1
Figure 3-1: Functional automated packaging machine prototype. The vials enter from the centrifugal bowl feeder, go through the transfer line into the vial placement mechanism. For more information, refer to the sections of Chapter 3
3.1
Centrifugal Bowl Feeder
The vial sorting system is the first stage of the automated machine. It accepts loose vials in bulk and outputs singulated vials, all with the same final orientation.
The sorting system contains by three primary components: a center disk that accepts and transports loose vials, a bowl with scallops that singulates vials, and selectors that retain vials facing the desired orientation while rejecting non-oriented vials. The inclined center disc rotates, applies centrifugal force on vials, and propels them onto the scallop pockets. The bowl also rotates continuously and moves the vials past series of passive mechanical selectors which reject vials that are not properly nested within the scallops and not facing the right orientation. The rejected vials are returned to the center of the bowl and recirculated; the retained vials are pushed out of the bowl and move on to transfer line.
For more details on the vial sorting mechanism, please refer to Zhengyang Zhang's 2019 Master of Engineering thesis: Design and Development of an Automated Sorting and Orienting Machine for Vials[1].
3.2
Transfer Line Feeder
The transfer line feeder is the second stage of the automated machine. It receives sorted vials from the centrifugal bowl feeder and transfers them to the vial packaging mechanism at the proper cadence and alignment.
The transfer line feeder contains three subsystems: a channel acting as a queue accepting vials from the sorting and orienting system, a vial pushing mechanism that propels vials through a turner, and a turner that orients vials at the correct inclination to match with the placement mechanism's angle.
For more details on the transfer line feeder, please refer to Efstratios Moskofidis' 2019 Master of Engineering thesis: Design and Development of a Transfer System for an Automated Packaging Machine[2].
3.3
Vial Placement Mechanism
The vial placement mechanism performs two primary tasks: loading the oriented vials into a tray and queuing empty trays to be loaded with vials.
Positioned after the transfer line feeder, the placement mechanism funnels a line of 10 vials into the rake. The cam applies force through the flexure, acting as a linear slide, to the rake. This force propels the rake forward, positioning it over the tray, allowing vials to drop into their final placement. After each stroke of the rake, the tray slider steps down to the next empty row, allowing the process to repeat.
When a tray is loaded with 100 vials, the tray slider moves down to the off-board ramp, where the full tray is able to slide out towards the vision system. After the full tray has been discharged, the tray slider moves back up; permitting the next empty tray to fall into place on the tray slider.
For more details on the vial placement mechanism, please refer to Steven Rat-ner's 2019 Master of Engineering thesis: Design and Development of a Placement Mechanism for an Automated Packaging Machine[3].
3.4
Motor Selection& Programming
The machine utilizes several motion axes to achieve reliable vial packaging. The following list describes all motors and actuators used on the machine:
1. Vial rake: 24 VDC stepper motor (operating a cam) 2. Tray lead screw: 24VDC stepper motor (direct drive) 3. Vial-biasing block: 120VAC linear solenoid
4. Transfer line feeder: 24 VDC stepper motor (operating a cam)
5. Rotary bowl feeder (center stage and sorting ring): Teknic@ClearPathTM ser-vomotor with integrated motor controller
1. Transfer line sensor: standard 24VDC optical sensor 2. Vial counter: standard 24VDC optical sensor
3. Rake actuation counter: 24VDC microswitch, wired normally open
For details on motor selection and programming of the machine, please refer to Diarny Fernandes' 2019 Master of Engineering thesis: Design and Development of a Precision Packing Stage and Master Control System for an Automated Vial Packaging Machine[4].
3.5
Automated Inspection System & Connectivity
The last stage of the packaging machine is automated inspection and data transfer. The machine needs to produce exactly 100 vials packaged in a plastic tray in a ro-bust fashion. Therefore an automated inspection system is developed to confirm the correct number of vials in a package. In addition, Waters needs to keep track of the manufacturing data of the packaging machine since the packaging process happens at a remote location. Therefore a data delivery system is also developed to post opera-tional data in a server so that Waters can monitor the machine performance in real time.
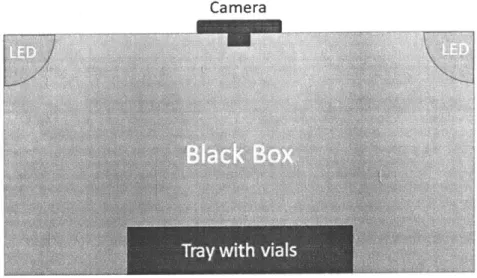
The automated inspection system is enabled by a Raspberry Pi 3 Model B+ and a Raspberry Pi NoIR Camera module with infrared capability. As a completed package of vials exits the packaging stage, it enters a black box with the camera installed on the ceiling. The black box is selected in order to create a controlled lighting environment for the camera to deliver a robust performance. Both white LEDs and Infrared LEDs are selected to provide adequate lighting inside the black box so that the camera can capture all the features in the package. The Raspberry Pi is set up with Python 3 and OpenCV to run feature recognition algorithms.
Once the image recognition algorithm finishes running. The output data is stored in the SD card with Raspberry Pi, which will be keeping track of the machine uptime and total number of properly packed packages that have been produced. Along with
some other crucial operational data such as machine throughput rate and machine uptime, the data will be sent through Ethernet to the Waters server for storage and inspection.
For a detailed view of the automated inspection and connectivity of the machine, please refer to Chapter four through seven of this thesis paper.
Chapter 4
Automated Inspection System
Overview
4.1
System Functional Requirements
As mentioned in previous chapters, Waters has been employing part-time labor to manually complete the packaging process of QuanRecovery vials, which leads to sev-eral drawbacks. Besides the inefficiency of labor and resource usage, human error often takes place, resulting in the package containing less than the desired number of 100 vials. Waters had to label the packages as 'Approximately 100 vials' because of this issue. In order to eliminate the word 'Approximately' so that the product appears more reliable and credible, we need to create a system to perform inspection on each of the completed packages. This is where the automated inspection system comes in.
The intended function of the automated inspection system is to check that exactly 100 vials are packaged in each plastic tray. Therefore, the inspection stage is placed at the very end of the line, right after the vial packaging stage. Details about the development of the computer vision algorithm will be discussed in Chapter 5.
In addition to the vision recognition requirement, operation data and machine status also need to be available remotely. This is because the packaging machine will be placed at the supplier's factory of QuanRecovery vials. The factory is situated far
away from Waters' area of operation, and packaging will happen right after the vials are manufactured. This arrangement prevents Waters from monitoring the manufac-turing process. Therefore, a data storage and transfer system need to be created for Waters to access in real-time. Several channels of data communication were explored, and the details about connectivity will be discussed in Chapter 6.
To sum up, the automatic inspection system has two main function requirements: (1). Check 100 vials are packaged in each plastic tray.
(2). Relay the operation data to Waters in real-time.
4.2
Hardware setup
The vision system is enabled by a Raspberry Pi 3 Model B+[5] and its accompanying NoIR Infrared Camera Module[6], which are shown in Figure 4-1.
In order to ensure connectivity under all signal conditions, three different modes of communication were explored: Ethernet, WiFi, and 2G/3G connection. Both Eth-ernet and Wifi are default features that come with the Raspberry Pi 3 Model B+. 2G/3G connectivity is enabled by the Particle Boron 2G/3G Development Board[7], which is shown in Figure 4-2. Boron Development Board comes with an embedded SIM card that opens up access to the Particle Mesh Cloud, a cloud application plat-form. A simple digital signal interface can be set up between Raspberry Pi and Boron to allow Raspberry Pi to write high/low signals to Boron. Then Boron can publish the data in real-time to the Particle Mesh Cloud, which can then be accessed on any smart device.
as sa at fta a i 4a as t aoat sA 4aa aWS a s EaIN as WI' W14 a saR RE 22 aan 29am a a a
*An 3 a ska a ORa 1 as13
Figure 4-2: Particle Boron 2G/3G Development Board with Cellular Flex Antenna[7]
To ensure robust performance of the Raspberry Pi Camera module and the com-puter vision algorithm, the lighting condition around the vial package needs to be
controlled. This is the reason why a black box needs to be placed around the imaging
stage of the automated inspection system. LEDs are to be placed inside the black
box to produce a controlled and repeatable lighting condition each time the computer
vision algorithm is run. The LED of choice is a WS2812B LED stripe installed inside a pale diffuser bracket[8]. The WS2812B was selected for decent brightness. The
the performance of the vision algorithm. A sample LED with diffuser performance is shown in Figure 4-3.
Figure 4-3: WS2812B LED Stripe with Light Diffuser[8]
Two difference lighting condition setups with LED are arranged and tested. Side light condition has LED installed on the inner walls of the black box. The light comes from the side on to the tray of vials. The back light condition has the LED on the back side of the vials. Light comes through the clear plastic tray and illuminates all the vials. A demonstration of the two lighting setups is shown in Figure 4-4.
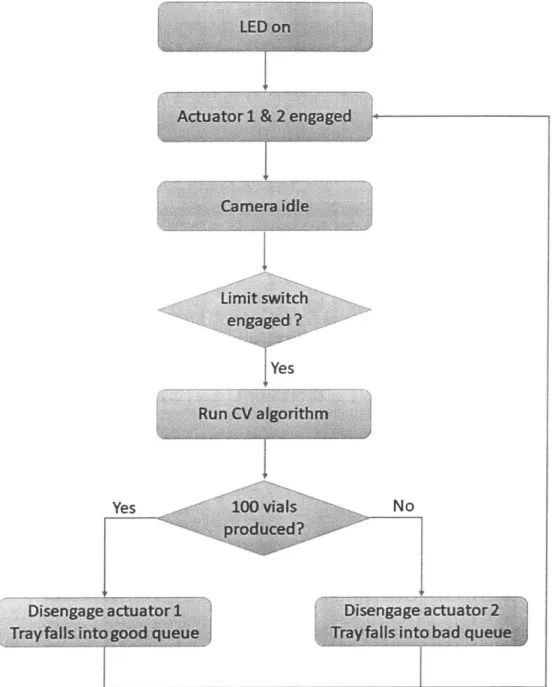
A limit switch is placed inside the imaging stage along the transfer line. When a package of vials falls to the right location, the limit switch will be engaged and sends a high signal to notify Raspberry Pi that a package of vials is in place. Then the Raspberry Pi can proceed to execute the computer vision algorithm.
Two actuators are used to control the exits of the imaging stage. Depending on the result from the computer vision algorithm, one of two results can occur: 100 vials are properly packed in the package, or not 100. The two actuators each control one outlet, which directs the package to the complete channel or the incomplete channel.
4.3
Software Architecture
The Raspberry Pi is loaded with Python 3 environment and OpenCV 3.4.0 Package. The limit switch produces a high/low signal that serves as the trigger for Raspberry pi to exit the idle state and start a program cycle. Each program cycle consists of the following steps:
1. Raspberry Pi receives trigger from the limit switch. Exit idle state. 2. Execute computer vision algorithm.
3. Update global variables, such as total machine uptime and total number of packages produced in the current work session.
4. Send actuation signal (Digital high/low signal) to PLC based on the computer vision algorithm result.
5. Relay information to Waters through internet 6. Raspberry Pi returns to idle state.
Camera
Side Light Setup
Camera
Back Light Setup
LED on
Actuator 1 & 2 engaged
Camera idle Limit switch engaged ? Yes Run CV algorithm Yes 100 vials produced? Disengage actuator 1
Trayfalls into good queue
No
Disengage actuator 2 Trayfalls into bad queue
Chapter 5
Vision Algorithm Development
5.1
Background
The main goal of the computer vision and imaging processing algorithm is to confirm that each package is properly packaged with 100 vials. And the core metric based on which the algorithm is evaluated is its robustness. Since the automated inspection system is the last stage of the entire machine, it must perform its function perfectly as there is no succeeding subsystem that can serve as a fail-safe. Any false positive result from the algorithm will negatively impact the overall performance of the machine and should be avoided.
To test the robustness of the algorithm, and to decide the optimal lighting setup, several test images were taken to serve as a reference. Recall in Chapter 4, there are two different lighting setups: side light and back light. The test images have varying lighting conditions, package orientations, and number of vials included. The images are shown in Figures 5-4 and 5-5. Some of the images have 100 vials in it, and some don't. In this way, by comparing the algorithm's output with the actual number of vials in the picture, the algorithm's robustness against lighting conditions and package orientation can be tested.
Some of the main sources of uncertainties in a computer vision algorithm include contrast resulting from the lighting condition in the image, image resolution, and the size and orientation of the features in the image. These variations are inevitable but
can be mitigated by construction a reliable and repeatable hardware setup to house software devices. In terms of algorithm development, there are different approaches, as image processing has been one of the research fields that has seen great develop-ment in the past decade. In this thesis, I mainly investigated two different approaches, namely template matching algorithm[9] and Hough Circle Transform[10]. The algo-rithms are programmed in Python and enabled by the OpenCV library. Details about the two algorithms will be discussed in detail in the following sections.
5.2
Pattern Matching
The dimension of the plastic vial containers is specifically designed so that it fits 100 vials in a certain way. Each row of vials has an offset from one another, and the total height of column stacks is constrained as well. As a result, whole packages of vials should appear to be the same, as there is only one way all 100 vials can be placed inside the package. As far as computer vision is concerned, the camera should be expecting a specific pattern of 100 vials every time. A pattern matching algorithm can be developed to check that the specific pattern of vials is present.
To implement a pattern matching algorithm, an image mask must be created. First, an image of 100 properly packaged and well-illuminated vials must be taken. A series of operations are performed on the image to create two different types of masks: primitive mask and edge mask. a primitive mask is just the original mask image cropped so that it only includes the package and vials. An edge mask only keeps the edge information. It is created by the Canny Edge Detection method in OpenCV[11]. The algorithm used to create an edge mask is in listing A.1. The image
I
Figure 5-1: Image Mask for template-matching. The algorithm used to generate the mask is listed in A.1.
OpenCV provides a function named "matchTemplate"[9]. It compares one original image with a template of a smaller size. The template slides through the original image, and a heuristic value is assigned to each possible template location. Depending on the method used to calculate the heuristic value, either the maximum or the minimum value should be targeted. There are six methods implemented in OpenCV. The equation used to calculate heuristic values is in Figure 5-2. Intuitively, the TMSQDIFF methods calculate how different the template is from the area under comparison in the original image. The TMCCOEFF and TMCCORR methods look at how similar they are. The output is a value calculated across every pixel in the template image. The NORMED methods are normalized values that range from 0 to 1. Therefore, between two very similar images, the output from TM_SQDIFF
methods should be small, while that from TMCCOEFF and TMCCORR methods should be large. We should be expecting a lower reading under TMCCOEFF and TMCCORREL methods from 99-vial testing images than from 100-vial images, and a higher reading in the case of TMSQDIFF method.
TM SQDIFF Pyhon: cv.TM_SQDIFF TM SQDIFFNORMED Python: cv.TMSQDIFFNORMED TM CCORR Python: cv.TMCCORR TMCCORRNORMED Python: cv.TMCCORRNORMED TM CCOEFF Pyhn: cv.TMCCOEFF TMCCOEFFNORMED Python: cv.TMCCOEFFNORMED
R(, y)Z(T(x', y') - I~+ x',y+y))2
z'j
- ,(T(', y') - I(z + _' y +
y'))2
T(z', y')2 • I(z + ', y + yI)2
R(z, y) = (T(z', y') • I(x + z, y + y'))
R(, ) -I(+ +))
T(z , y')2. I(z + X', y + y')2
R(, y) = (T'(x', y') I(z + d', y + '))
X'1W
where
T'(z', y') = T(z', y') - 1/(w .h)- T(z", y")
P(x + x', y + y') =I(x + z', y + y') - 1/(w - h) • ~e I(x + x", y + y")
Y Vy4,NT'(zdI y )2. E , I, (_ + ely+ y')2
Figure 5-2: Six Methods Implemented in matchTemplate function in OpenCV[12]. The R(x, y) functions produce the heuristics that indicate the difference between the template and the image for each method implemented.
The algorithm for testing each of the six template-matching methods is listed in A.2. Figure 5-3 shows the outputs from all six template-matching methods on test images. As we can see, the algorithm does not provide a robust solution. None of the six algorithms can consistently provide a correct reading to indicate a 99-vial package. Although the average reading manages to correctly indicate 99-vial packages in 11 out of 12 tests, such statistics is unacceptable for the automated inspection application.
is that the algorithm is run with the entirety of one 100-vial package as a mask. The lighting condition and contrast on each of the vials will impact the algorithm. The orientation of the package and the relative position angle between the package and the camera play important roles as well. Missing one vial will not create as large of a change to the sum of all pixel intensity values as a change in the overall lighting condition, or a shift in package orientation. Therefore to boost the robustness of the algorithm, a robust hardware setup is a must. The repeatability requirement of the imaging stage is extremely high.
100_side 99 side 1 2' Ave5 100_back 99_back Ave Figure 5-3: Data tion output from
432638336 445946880 44348569 0.5154561996: 0.5084495544 0.5152251124 0.5146155953. M1lj 96 832 0.545050025 2 984781888 0.5667471886 3 969152832 0.545050025, 41 1001298688 0.5497953892 5 855183616 0.4602040946 955913971.2 0.5333693445 from Template-matching 100-vial images. The red
correl normed sqdiff sqdiff normed
10516265984 0.9551101923 987810880 0.09019029886 10914385920 0.9611776471 882843456 0.07785610855 10572314624T 0.570474625T 949046912 0.08609685302 0739422208 0.9595266581 901946110.08095692M I 10784050176 0.9581692815 935473024 0.0836616531 87896576W ~ 539067264 0.44 M9 8660174848 0.7688021064 5209348608 0.4624569416 9008259072' 0.7910482883 47527377921 0.4181830585 8660174848 0.7688021064 520934 8 608 0.4624569416 91045591041 0.7770372629 5239642624 0.4481544495 7177293824 0.6760078669 6906083328 0.6506528854 8522092339 0.7563395262 53
Algorithm. The green rows show func-rows show average output from 99-vial images.The coeff, coeff normed, correl, and correl normed methods should theoreti-cally produce a higher reading from 100-vial images, while sqdiff and sqdiff normed methods should give a lower output from 100 vial images. As shown in the data spreadsheet, the function cannot reliably produce desires output under any of the six methods. The robustness of the algorithm needs to be improved.
5.3 Hough Circle Transform
Given the fact that all vials are circular, and appear as circular objects in camera images despite some perspective deformation, a circle detection algorithm can be used to perform individual identification on each of the 100 vials. OpenCV provides a function named "HoughCircles"[101 that conveniently provides the functionality of circle detection with good robustness. The main method behind the function is a fast
'445W I 15865695 le' 0 Y196S5f72 0,%§inle7AN9 875355W4 Uf/T2553136
7, loo
54387730W
coeff nonned correl coeff
Hough Transform based on the fact that circles can be described by the mathematical
expression (Xcircle - Xcenter) 2 + (ycircle - Ycenter) 2 = r2
. First, the image is reduced
to mostly edge feature information. Then each pixel is iterated through, and the likelihood that a circle of certain radius is centered on that pixel is calculated. The likelihood value is calculated as the number of possible circles centered on the pixel. If the value passes a certain threshold, the circle is returned as output. Details on the Hough Circle Transform is explained in the paper by Yuen et al [13].
As implemented in OpenCV, the HoughCircle function takes the following input arguments:
1. img: Grayscale input image
2. method: Circle detection method. The only implemented method is cv2.HOUGHGRADIENT, as described in the paper by Yuen et al [13].
3. dp: of the accumulator resolution to the image resolution. 4. minDist: Minimum distance expected between detected circles 5. param1: Upper threshold of the embedded edge detection method.
6. param2: Accumulator threshold of likelihood value. Lower the threshold is, the easier for the detected circles to be approved as output
7. minRadius: Minimum radius of expected circles. 8. maxRadius: Maximum radius of expected circles.
In terms of implementing the function for vial detection, the arguments need to be carefully tuned for the specific hardware setup. The dp argument is normally set to 1 according to the paper. minRadius and maxRadius, in pixels, can be measured off of the camera image. minDist is set to approximately double the maxRadius to prevent circles from overlapping. param1 and param2 are hard to find analytically. The best values for them were acquired iteratively over several rounds of trials. The
As we can see from the images, the main source of error comes from lighting condition and the edge of the package. Specifically, under back lighting condition, there is a chance that the four corners of the plastic package can be recognized as a vial when there is a vial missing in that corner. This issue is solved by using proper side lighting that illuminates the top side of vial package only. In this way, there will be less contrast along the edge of the package, and consequently less of a chance to invoke a false positive circle reading.
(1)
(2)
(3)
(4)
(5)
(6)
Figure 5-4: Test Images with Back Lighting: (1): 100-vial package. (2)-(6): 99-vial packages. Missing vial locations are indicated by circle
----(1)
(2)
(3)
(4)
(5)
(6)
Figure 5-5: Test Images with Side Lighting: (1): 100-vial package. (2)-(6): 99-vial packages. Missing vial locations are indicated by circle
(1)
(2)
(3)
(4)
(5)
(6)
Figure 5-6: Hough Circle Transform Results on Back Light Images. Note that in (4), error reading occurred in top right corner
(1)
(2)
(3)
(4)
(5)
(6)
Figure 5-7: Hough Circle ransform Results on Side Light Images. All vials are properly detected
Chapter 6
Connectivity
6.1
Why Machines Need Connectivity
As mentioned in the previous chapters, the particular situation between Waters and the vendor of QuanRecovery vial creates a need for connectivity feature in our ma-chine. The vendor's factory is located in a state which is far away from Water' main regions of operation. Therefore it is costly for Waters to deploy its own employee on-site, in order to audit the packaging process. The connectivity feature of the machine will enable Waters to remotely monitor the performance of the packaging process, and obtain crucial insight into the manufacturing process.
The need for such connectivity feature aligns well with the overall shift towards Industry 4.0 in the manufacturing industry. The term 'Industry 4.0" was first pro-posed by the German government
[14]
as a national effort to make the digitize the manufacturing industry and promote flexible and smart processes.Boston Consulting Group(BCG) later proposed nine core technologies that will transform various industry verticals. They are shown in Figure 6-1:
[151
1. Autonomous Robot 2. Simulations
3. Horizontal and Vertical System Integration 4. Industrial Internet of Things
(IoT)
5. Cybersecurity 6. Cloud 7. Additive Manufacturing 8. Augmented Reality 9. Big Data Autonomous robots Big data, ar'danalvtics Simulation
Au~mned Industry 4.0 Horizontland verical
Hotern integration
Nine Technologies Are
Transforming Industria[ Production
manufact g The c
The ctoud Cybersecunty
Source 6CG anaysg
The nine core technologies proposed by BCG can serve as a general guideline about the technologies that can play a significant role in the process of revolutioniz-ing the manufacturrevolutioniz-ing industry. Adoptrevolutioniz-ing any of the nine technologies in a traditional manufacturing environment can potentially boost efficiency, reject risk, and obtain insight on which well-informed decisions can be made. However, a closer look into the nine technologies reveals that to deploy any of them, digitization of the manufac-turing process needs to take place. That is, the data outputs, the machine status, as well as the control signals in the manufacturing process should be readily available, so that smart applications can be built upon such information. The availability of machine data is key. The digital age has brought around various microcontrollers and microprocessors that are more than capable of performing simple data-logging and data-transfer tasks. It is important to have the mentality to incorporate such devices to keep track of the data of interest. In this way, smart applications can be later developed upon them.
The functional requirement of a connectivity feature in the machine is a perfect opportunity to make data available. The short term benefit is for Waters to be able to remotely access the performance data, and monitor the machine status. In the long run, more industry 4.0 application can be developed upon this foundation.
In the following sections, I will discuss three channels of communication and the final communication protocol.
6.2
Modes of Communication : Ethernet & WiFi
Both Ethernet and WiFi are default features on the Raspberry Pi 3 Model B+ board. The Ethernet connection is easy to set up: plug in the Ethernet cable and the Rasp-berry Pi should be connected.
The WiFi setting on a Raspberry Pi can be done either headless, i.e. without a display, or with a display connected. With the display, the Raspberry Pi Desktop provides a simple GUI to set up WiFi connection. Under a headless setup, the WiFi configuration file is named wpa _supplicant, and is located under the root/etc
directory. The file can be edited on Raspberry Pi using the following command:
$ sudo nano /etc/wpa_ supplicant .conf
File editing screen is shown in Figure 6-2. Each network block corresponds to one WiFi connection. The ssid field is for the WiFi ID, and psk is for the WiFi password.
The priority field corresponds to order in which Raspberry Pi tries to connect to the list of networks. A higher priority value means a higher priority. In the picture, two networks are shown. The MIT public WiFi has a higher priority over personal phone hotspot.
This configuration file can be found on the Raspberry Pi on-board SD card, and thus can also be edited by plugging the SD card into a computer.
pi@raspberrypi: /etc/wpa.suppicant V ^ X
File Edit Tabs Help
Figure 6-2: wpa_suplicant.conf File. Each WiFi setting, including SSID, password, and connection priority, is shown in an individual block of code.
6.3
Modes of Communication : 2G/3G Connection
The Raspberry Pi does not have cellular connection capability with the default hard-ware setup, but there are various breakout boards and hardhard-ware extensions available on the market that can provide a cellular connection feature to Raspberry Pi. How-ever, given the need for constant monitoring of the manufacturing process, a separate microprocessor is preferred. In this way, all of the processing power of Raspberry Pi can be devoted to imaging processing, and the data-logging plus data-transfer process do not block the main algorithm on Raspberry Pi. With a separate and dedicated processor for image processing and connectivity, the design becomes modular and can be easily debugged. The modular design also results in great adaptability. Each processor can be switched out and upgraded for different applications.
Based on this perspective, the Particle Boron 2G/3G Development Board{7] was selected as the data outlet for the machine. Boron comes with an embedded SIM card, which by default enables cellular connection to the internet. Carrier selection and data plan management are both done by Particle service in the background. To start prototyping with Boron, or any other Particle device, a Particle account is needed. All devices and programs are registered in the cloud with the account, and all programming on Particle boards is done through the Particle Web IDE, as shown in Figure 6-3. Programs are pushed to selected devices wirelessly. The action logs of each device are stored in the cloud, which can be easily accessed and inspected through an online console.
On the software side, Boron operates like an Arduino with the addition of Par-ticle' all-in-one Application Programming Interface(API)[16] for cloud applications. Particle API provides a powerful library that enables actions such as publishing and subscribing. Devices can be programmed as publishers, which pushes updates to the cloud, or subscribers, which constantly monitor all publishers and their updates. This system enables a neat setup with all packaging machines working as publishers, and the central monitor station at Waters working as a subscriber. Waters can obtain no-tification whenever a package is produced, either successfully or unsuccessfully, along
-1
Particle Devices 0
OBoron
SpongeBoron >
oXenon
PatriXenonStar tie.variabeto( a "teovalue. V;
::ledfoggte(String cand)(
(comend- on" f
Figure 6-3: Particle Web IDE with Sample Code. Devices registered with the Particle account are shown in the column on the left. In this case, the two devices names are "SpongeBoron" and "PatriXenonStar". Code can be pushed to either device by highlighting the star next to the device name.
with the machine status data of interest. Published data are logged in the Particle online console, that can be accessed and downloaded, allowing further analysis to be run.
Unfortunately, it was revealed during the early stages of the project development that the facility where the machine is going to be placed does not have stable WiFI nor cellular connection. Ethernet is the only reliable connection method. Therefore, 2G/3G connection with Boron, along with the interface between Raspberry Pi and Boron is not thoroughly developed. Yet it remains an interesting topic that can be investigated in greater depth in the future.
6.4
Communication Protocol
A preliminary discussion with Waters and vial vendor reveals the following machine data of interest:
3. Date & Time: Timestamp of each data-transfer event. 4. Machine Uptime: Duration of the current work session.
5. Number of Good Packages Produced: Number of packages containing 100 vials produced in the current work session.
6. Number of Bad Packages Produced: Number of packages not containing 100 vials produced in the current work session.
To store and deliver the aforementioned data, various setups and protocols can be used to establish a wireless connection between the packaging machines and the monitor station. For example, a publisher-subscriber structure can be set up with the Particle API. Alternatively, data of interests can be encoded into UDP packets and delivered via the internet. In terms of data-logging, data can be stored either in the SD card with Raspberry Pi, or uploaded to a cloud space.
Per request from Waters, a simple Emailing system is set up as the data-transfer method, given the tight timeline of our project and the available resource at Waters. Python by default comes with the smtplib library[17], which provides functions that can send emails through Simple Mail Transfer Protocol(SMTP). SMTP is widely used as the email-sending protocol by all email service providers. Python's smtplib library provides an easy way to automate the email sending process. A sample python script is shown in Listing A.4. The algorithm automatically sends the packaging machine status to any designated email address, and the content of the email can be easily customized. Automated emails have been tested with most email service providers, including Gmail, Outlook, and Yahoo. Sometimes the automated email went to the spam folder because it is automatically generated. But in all tests, the emails were successfully received, and no blocking occurred.
Further work can be done to add more functionality to this data-transfer method: The script can be modified to read or write data into a .csv file. Machine data can be sent in the .csv file as an attachment to the email.
Chapter 7
Conclusion & Future Work
7.1
Conclusion
Over the course of the project work, the system architecture of the automated in-spection system is successfully designed and tested. The following conclusions can be drawn on both the software and the hardware side.
1. The combination of Raspberry Pi 3 Model B+ and NoIR Infrared Camera is powerful enough for the computer vision and imaging processing algorithm. 2. A robust and repeatable hardware setup is required for a good performance of
the computer vision algorithm. A black box with LED lights on the internal walls is recommended. Diffusers are also recommended to avoid glares on the plastic package.
3. The template-matching algorithm is very susceptible to lighting condition and package orientation changes. As a result, the robustness of the algorithm is not promising at the moment. Further hardware development is required to fully investigate the feasibility of this algorithm for the application of automated inspection.
4. The Hough Circle Transform algorithm demonstrated good robustness under the condition of side lighting. It is the recommended algorithm for the final
automated inspection machine.
5. The feasibility of using Email as the method of data-transfer is verified. Data about the machine can be stored in the on-board SD card on Raspberry Pi, and sent to parties of interest via automatic emails.
7.2
Future Work
I suggest the following action items to further develop the automatic inspection sys-tem, to achieve higher robustness and better connectivity.
1. Develop a robust hardware setup. This includes the interface between the imag-ing stage and the packagimag-ing stage. The main goal is to minimize external light coming into the imaging chamber.
2. Test the template matching algorithm further. With a more robust hardware setup, it is possible to significantly improve the performance of the template matching algorithm.
3. There are other computer vision algorithms that are not covered in this thesis that could be inherently more robust. Fast Radial Symmetry Transform(FRST) was introduced by Loy et al [18] as a fast and robust method to detect features in an image. And a method to adapt FRST into detecting circular objects was created by Ali et al
[19].
Further investigations can be done on Fast Radial Symmetry Transform, as it can potentially enhance the robustness of the whole inspection system.4. Further algorithm robustness analysis needs to be done with the automated inspection system installed with the entire packaging machine, as little testing has been done with the imaging stage integrated into the machine.
connection using Particle Development Boards or creating a server space in Waters Corporation Server for remote data logging and data display.
Appendix
A
Algorithms
Listing A.1: generateMask.py import numpy as np
import cv2
mask I cv2. imre ad (' ***.j p g ' , cv2.IREADGRAYSCALE)
mask2 cv2. imread (' ***.jpg ' , cv2.IMREADGRAYSCALE)
#shrirnking
#img = cv2. resize (img, None,
fxz=0.5,
fy =0.5, interpolation = cv2.INERAREA)#cropping
xMargin = 85yMargin = 60
maskI = mask1[yMargin+2:-yMargin+30, xMargin:-xMargin-25] mask2 = mask2[yMargin+15:-yMargin+49, xMargin-20:-xMargin-27]
#rotation
#img = imutils rotatebound(img, 180)
#blurring
mask1_blurred = cv2. GaussianBlur (maski, (3, 3), 0) mask2_blurred = cv2 .GaussianBlur(mask2, (3, 3), 0)
#Gaussian apeture width & height #Canny edge detection
mask1_edge cv2. Canny(maskl_blurred, mask2_edge cv2. Canny
(mask2
_blurred,#
Lower threshold, higher threshold#second blurring
maskI_ edgeBlurred = cv2.GaussianBlur( mask2_edgeBlurred = cv2.GaussianBlur(
#Gaussian apeture width & height
20, 100) 20, 100) maskl_edge, mask2_edge, (15, (15, #cv2. imshow ('1', maski) #cv2. imshow
(
'2', mask2) cv2. waitKey (0)cv2. imwrite ('maskl. jpg ' , mask1)
cv2. imwrite
('mask2.
jpg ' , mask2)cv2. imwrite ('masklblurred. jpg' , mask1_blurred)
cv2. imwrite
('mask2_blurred.
jpg'
, mask2_ blurred)cv2. imwrite
('maskiedge.
jpg ' , mask1 edge)cv2. imwrite
('mask2_edge. jpg
' , mask2 edge)cv2. imwrite
('mask1_edgeBlur.jpg'
, mask1_ edgeBlurred)cv2. imwrite
('mask2_
edgeBlur.jpg' , mask2_ edgeBlurred)15) , 15),
0) 0)
Listing A.2: patternMatch.py import numpy as np import cv2 fileName outputName= template = ***.jpg ' fileName[0:-4] + "_output. jpg" cv2. imread('maski. jpg ', img cv2. imread
(
'cv/' img2 img.copy() + fileName , cv2.IMREADGRAYSCALE) cv2.IMREAD_GRAYSCALE)#
All the 6 methods for comparison in a listmethods = [ 'cv2 .TMCCOEFF', ' c v2 .TMCCOEFFNORMED', ' cv2 .TMOCORR' , ' c v2 .TMCODRR_NRMED', ' c v2. TMSQDIFF ' , cv2.TMSQDIFFNORMED' for meth in methods:
img = img2.copy() method = eval(meth)
#
Apply template Matchingres = cv2. matchTemplate
(img,
template ,method)min_ val, max-val , minloc, maxloc cv2 .minMaxLoc ( r e s )
if method in [cv2.TMSQDIFF, topleft = minloc print (minval) else: topleft = maxloc print (maxval) cv2.TMSQDIFF_NORMED]:
ff If
cv2. circle (img, top_ left , radius = 10, color = (255,0,0), thickness = -1) subplot (121), plt t it e ('Matching xticks([]), plt subplot (122), plt title ('Detected xticks ([]) , plt suptitle (meth) show()
.imshow(res ,cmap = 'gray')
Result '), y tick s([]) .imshow(img,cmap = 'gray') Point'), yticks(/]) f, fi fi plt plt pIt plt plt plt plt plt
Listing A.3: houghCircle.py
import numpy as np import cv2
import imutils
fileName = '99_back_7.jpg'
outputName= fileName[0:-4] + "_output.jpg"
#img = cv2.imread('cv. png', cv2.IMREADGRAYSCALE)
img = cv2. imread('cv/' + fileName, cv2.IMREADGRAYSCALE)
#shrinking
#img = cv2. resize (img, None, fx=0.5, fyz=0.5,
interpolation = cv2.INTERAREA)
#cropping
xMargin = 100 yMargin = 50
img = img[yMargin:-yMargin-50, xMargin:-xMargin]
#rotation
#img = imutils. rotate_ bound (img, 180)
#blurring
img = cv2.GaussianBlur(img, (5, 5), 0)
#Gaussian apeture width & height
#Canny edge detection
#img = cv2.Canny(img, 20, 100)
# Lower threshold, higher threshold
Params:
minDist: min distance between circles
param1: Upper thresh. of internal canny edge
param2: accumulator threshold for circle centers at the detection stage minRadius: max expected circle radius
maxRadius: min expected circle radius
circles = cv2. HoughCircles (img, cv2.HOUGHGRADIENT, dp=1,\ minDist=40,\ param1=25,
\
param2=25,\
minRadius=14,\ maxRadius=24) for i in circles [0,:]:#
draw the outer circlecv2.circle(img,(i[0], i[1]), i[2],(0,255,0),2)
#
draw the center of the circlecv2. circle (img,(i[0], i[1]),2,(0,0,255),3) print("#-of- circles -found:" , circles .shape[1I)
cv2.imshow('1', img)
cv2. waitKey (0)
cv2. imwrite (outputName, img)
Listing A.4: smtpSend.py import smtplib
from email.mime.multipart import MIMEMultipart from email.mime.text import MIMEText
import datetime import math #**********Email Settings********** toaddr = "***@***.com" fromaddr = "***@***.com" password = "***" #**********Email T itle********** msg = MIMEMultipart() msg['From'] = fromaddr msg['To'] = toaddr msg['Subject'] = "Machine-Status-Update-"
+ datetime. datetime.now(). strftimemen-%d%9I:%M")
#**********Email Body**********
date = datetime . datetime.now(). strftime ("%tn-9k-%E9H:%M") machineName = 'Colombus-Prime'
machineLocation = 'Cambridge,VA'
machineUptime = 25086.24 #dummy number
machineUptime =
str (datetime. timedelta (seconds = math. floor (machineUptime))) numGoodPackage 9 # dummy number
body = """
This is an automatically generated email.\n
Status update on the QuanRecovery Vial Packaging Machine:\n
Machine Name: %s
\n
Machine Location: %s
\n
Date & Time: %s
\n
Machine Uptime: %s (hour: minute: second)\ n
Number of Good Packages Produced: %d
\n
Number of Bad Packages Produced: %d
""'% (machineName, machineLocation, date,
machineUptime, numGoodPackage, numBadPackage)
datetime. datetime. now(). strftime % -%d-% %:%M")
msg. at t ach (MIMEText (body , ' plain')) #*********Send Email**********
server = smtplib.SMTP('mail. example. com')
server . starttls
()
server .login (fromaddr password)
text = msg. asstring
()
server .sendmail(fromaddr , toaddr , text)

![Figure 4-1: Raspberry Pi 3 Model B+[5] and NoIR Infrared Camera Module[6]](https://thumb-eu.123doks.com/thumbv2/123doknet/14678767.558704/27.917.131.770.571.1052/figure-raspberry-pi-model-noir-infrared-camera-module.webp)
![Figure 4-2: Particle Boron 2G/3G Development Board with Cellular Flex Antenna[7]](https://thumb-eu.123doks.com/thumbv2/123doknet/14678767.558704/29.917.229.647.145.760/figure-particle-boron-development-board-cellular-flex-antenna.webp)
![Figure 4-3: WS2812B LED Stripe with Light Diffuser[8]](https://thumb-eu.123doks.com/thumbv2/123doknet/14678767.558704/30.917.132.769.211.557/figure-ws-b-led-stripe-light-diffuser.webp)
![Figure 5-2: Six Methods Implemented in matchTemplate function in OpenCV[12].](https://thumb-eu.123doks.com/thumbv2/123doknet/14678767.558704/37.917.127.771.262.758/figure-methods-implemented-matchtemplate-function-opencv.webp)
