Data Driven Health System
byMelissa Beth Rosen Ceruolo
B.S. Mechanical Engineering, 2001Carnegie Mellon University
)
Submitted to the System Design and Management Program In Partial Fulfillment of the Requirements for the Degree of
Master of Science in Engineering and Management
at the
Massachusetts Institute of Technology February 2013
@ 2013 Melissa Rosen Ceruolo All rights reserved
The author hereby grants to MIT permission to reproduce and to distribute publicly paper and electronic copies of this thesis document in whole or in part in any medium now known or hereafter created.
Signature of Author
Certified by
Accepted by
Melissa Rosen Ceruolo Design and Management Program January 18, 2013
Luis Perez-Breva, PhD
-Th esis Supervisor R sea entist and Lftbrer, sc obo, Engineering
Patrick Hale Director System Design and Management Program
Data Driven Health System
byMelissa Beth Rosen Ceruolo
B.S. Mechanical Engineering, 2001 Carnegie Mellon University
Submitted to the System Design and Management Program on January 18, 2013
In Partial Fulfillment of the Requirements for the Degree of Master of Science in Engineering and Management
ABSTRACT
Effective use of data is believed to be the key to address systemic inefficiencies in health innovation and delivery, and to significantly enhance value creation for patients and all stakeholders. However, there is no definition for health data. Rather, data in health is an assortment of observations and reports varying from science to clinical notes and reimbursement claims that emerge from practice rather than design. What is health data?
In this thesis we try to answer that question by looking at the system of health almost exclusively as a system that generates, transforms, and interprets data. We overview the different meanings data has throughout the health system, we analyze systematically the inefficiencies and trends as they emerge from data, and propose a new architecture for the system of health in which data is not present by accident. The result of this thesis is a new architecture for the system of health that is consistent with its present state but also consistent with a future learning system and a redefinition of value in health care that is patient and information centric.
Thesis Supervisor: Luis Perez-Breva, PhD
ACKNOWLEDGEMENTS
With sincere gratitude, I thank Patrick Hale and MIT's System Design and Management program for giving me the opportunity to engage in research at MIT and for giving me the tools I need to be successful in the next phases of my career as an engineering
leader.
This research is sponsored by MIT Center for Biomedical Innovation. I thank the Executive Director, Gigi Hirsch, for her support and the opportunity to be a part of the
New Drug Development Paradigm initiative (NEWDIGS).
I gratefully thank my advisor, Luis Perez-Breva, for
* his commitment to our work and dedication to academia and innovation * the freedom to explore with his patient guidance
* careful critique and strive toward perfection * instilling in me ownership and preciseness * his unique perspective and sense of humor
I would like to acknowledge my managers Michel Bruehwiler, Christian Peclat, and Walter Huber at Helbling Precision Engineering, Inc. for their support of my education and for nurturing my early knowledge of the health system in the medical device industry.
Lastly, I thank my husband, Christopher Ceruolo, for his strength, perseverance, and passion - constant inspirations leading me toward my true potential.
I dedicate this thesis to my parents who have instilled in me the value of hard work and laid the foundation for my success with their timeless support.
TABLE OF CONTENTS
A BSTRA CT ... ... ... ... ... . ... 3
A CK N OW LED GEM ENTS ... 4
TA BLE O F CO NTENTS... ... ... ... 5
TA BLE O F FIGU RES... ... ... 8
TA BLE O F TA BLES ... ... ... ... 10
TA BLE O F A CRO NYM S... ... ... 11
CH A PTER 1: INTRO D U CTION ... 12
1.1 Background on the Health System ... 14
1.1.1 Stakeholder Definition... 14
1.1.2 Stakeholder Netw ork Flow ... 16
1.1.3 System Problem Statem ent...17
1.2 M ethodology ... ... ... ... 18
1.3 Thesis Outline ... 19
CHAPTER 2: HEALTH DATA LANDSCAPE ... 20
2.1 Landscape overview ... 21
2.2 Provider Data... ...-... 22
2.2.1 Adm inistrative Data...24
2.2.2 Clinical Data...25
2.3 Patient Data ... ... 29
2.3.1 Personal Health Record... 30
2.3.2 Physiological M easurem ents ... 31
2.3.3 Genetic Data...34
2.4 Payor Data... ... .... .35
2.5 Manufacturer Data ... ... 40
2.5.1 Drug Discovery...42
2.5.2 Drug Developm ent...42
2.5.3 Clinical Trials ... 45
2.6 Regulator Data... ... 47
2.6.1 New Drug Application (NDA)...47
2.6.2 Label ... 49
2.6.4 FDA Data Resources ... 51
2.7 Distributor Data... 53
2.8 Data Landscape Sum m ary ... 57
CHAPTER 3: ANALYSIS OF HEALTH DATA ... 58
3.1 Cross-Stakeholder Com m unication... 59
3.2 Dependencies... 61
3.3 Attributes ... 66
3.4 Value Assessm ent ... 68
CHAPTER 4: PATIENT INTERACTION DATA FLOW... 72
4.1 Data Flow Diagram ... 72
4 .1 .1 In p u t D ata ... 7 4 4.1.2 Output Data...74
4.1.3 Com m unication Between Provider and Payor... 75
4.1.4 Com m unication Between Manufacturer and Public... 76
4.1.5 Com m unication Between Patient and Provider ... 76
4.1.6 Com m unication Between Providers... 77
CHAPTER 5: DATA DRIVEN TRENDS... 79
5.1 System Input (A) ... 82
5.1.1 W earable Sensors ... 82
5.1.2 Direct to Consumer Genetic Testing ... 84
5.1.3 Online Resources...84
5.2 Clinical Knowledge W arehouse (B) ... 85
5.3 Clinical Decision Support (C) ... 87
5.4 Claim M anagem ent Analytics (D) ... 88
5.5 Genetic Testing (E) ... 88
5.6 Open Innovation Initiatives (F) ... 90
5.7 Product Licensin G ... 91
5.8 Distribution M anagem ent and Analytics (H) ... 92
5.9 Localized Feedback (I) ... 93
5.10 Sum m ary of Trends... 94
CHAPTER 6: CONCEPT OF A LEARNING HEALTH SYSTEM... 95
6.1 Functional Architecture ... 95
6.1.1 Data Categories in Figure 40... 96
6.1.2 Process Categories in Figure 40... 97
6.2 System Concept Em erging From Figure 40 ... 98
6.2.1 A Learning Health System ... 99
6.3 System Problem Statem ent, Revisited... 101
7.1 Findings Supporting New Vision ... 103
7.2 Future W ork ... ... .... - . ... 104
REFERENCES ...- ... ... 106
APPENDIX A: REFERENCED WEBSITES...111
APPENDIX B: STAKEHOLDERS' NEEDS...112
APPENDIX C: PARTITIONED DSM, SECTION 3.2..-...113
TABLE OF FIGURES
FIGURE 1: STAKEHOLDER NETW ORK FLOW ... 16
FIGURE 2: W HAT IS DATA?...20
FIGURE 3: VISUALIZATION OF HEALTH DATA CATEGORIES... 21
FIGURE 4: EHR SCREENSHOT FROM NEXGEN HEALTHCARE ... 23
FIGURE 5: VISUALIZATION OF PROVIDER DATA CATEGORIES... 24
FIGURE 6: CATEGORIZATION OF PROVIDER ADMINISTRATIVE DATA... 25
FIGURE 7: CATEGORIZATION OF PROVIDER CLINICAL DATA... 26
FIGURE 8: VISUAL ILLUSTRATION OF PROVIDER CLINICAL SUBCATEGORY, PATIENT STATUS...27
FIGURE 9: ICD-10 SCREENSHOT OF LUNG CANCER DISEASE CLASSIFICATION ... 28
FIGURE 10: ZW EENAHEALTH PHR FEATURES ... 31
FIGURE 11: CORVENTIS' MOBILE PATIENT MANAGEMENT SYSTEM FOR HEART FAILURE PA T IE N T S3...34
FIGURE 12: CMS-1500 SMARTFORM, HEALTH INSURANCE CLAIM FORM... 36
FIGURE 13: CATEGORIZATION OF PAYOR DATA... 38
FIGURE 14: CATEGORIES OF DATA IN THE DRUG DEVELOPMENT AND APPROVAL PROCESS...41
FIGURE 15: DATA INCLUDED IN IND...42
FIGURE 16: SECTIONS FROM CASE REPORT FORM ... 44
FIGURE 17: CATEGORIZATION OF CASE REPORT FORM (CRF) DATA ... 44
FIGURE 18: DATA INCLUDED IN CLINICAL STUDY REPORT... 45
FIGURE 19: SIX SECTIONS OF THE NEW DRUG APPLICATION (NDA)...48
FIGURE 20: ADDITIONAL DATA INCLUDED IN A NEW DRUG APPLICATION (NDA)...48
FIGURE 21: SCREENSHOT OF AVASTIN LABEL FROM DAILYMED ... 50
FIGURE 22: DATA CONTENTS IN A DRUG LABEL... 50
FIGURE 23: DATA ELEMENTS FOR DRUG AVAILABLE FROM FDA ... 52
FIGURE 24: LIST OF RESOURCES AVAILABLE ON FDA W EBSITE... 52
FIGURE 25: PBM NETW ORK...53
FIGURE 26: CATEGORIZATION OF DISTRIBUTOR DATA ... 54
FIGURE 27: ADJACENCY MATRIX FOR CROSS-STAKEHOLDER COMMUNICATION...59
FIGURE 28: NETWORK DIAGRAM OF DATA FLOW BETWEEN STAKEHOLDERS...60
FIGURE 29: PARTITIONED DSM OF FIRST ORDER STAKEHOLDER COMMUNICATION DATA...62
FIGURE 30: 60 SELECTED SUBCATEGORIES OF DATA FROM CHAPTER 2... 63
FIGURE 31: NON-PARTITIONED DSM OF 60 DATA SUBCATEGORIES... 64
FIGURE 32: PARTITIONED DSM OF 60 DATA SUBCATEGORIES, DIRECT DEPENDENCIES...65
FIGURE 33: DATA ATTRIBUTE MAP ... 67 FIGURE 34: PATIENT INTERACTION DATA FLOW DIAGRAM ...
FIGURE 35: DATA DRIVEN TREND CATEGORIES A-I MAPPED ONTO INTERACTION DIAGRAM...80
FIGURE 36: VENDOR LANDSCAPE FOR W EARABLE TECHNOLOGY... 83
FIGURE 37: STAGES OF MEANINGFUL USE ... 86
FIGURE 38: MYRIAD CANCER PRODUCTS OFFERINGS... 89
FIGURE 39: TRANSPARENCY LIFE SCIENCES PROCESS LEVERAGE POINTS... 91
FIGURE 40: FUNCTIONAL ARCHITECTURE OF THE INTERACTION DIAGRAM ... 96
FIGURE 41: SYNTHESIZED SYSTEM IN OBJECT-PROCESS NOTATION... 98
TABLE OF TABLES
TABLE 1: DESCRIPTION OF PHYSIOLOGICAL MEASUREMENTS... 32
TABLE 2: PATIENT MONITORING DEVICES...33
TABLE 3: CLINICAL TRIAL PHASES...45
TABLE 4: ASSESSMENT OF METHODS AND TOOLS USED TO ANALYZE DATA...58
TABLE 5: SAMPLE ATTRIBUTE CATEGORIES... 67
TABLE 6: DATA VALUE ANALYSIS...69
TABLE 7: RESULTS OF DATA VALUE ANALYSIS... 70
TABLE 8: QUALITATIVE ASSESSMENT OF FUNCTION FOR SELECTED DATA CATEGORIES...70
TABLE OF ACRONYMS
ACO Accountable Care Organization
AMA American Medical Association
APCD All-Payor Claims Database
BMJ British Medical Journal
CDC Centers for Disease Control and Prevention
CDDS Clinical Decision Support System
CMS Centers for Medicare and Medicaid Services
CRF Case Report Form
CSR Clinical Study Report
DFD Data Flow Diagramming
DHHS Department of Health and Human Services
DOD Department of Defense
DSM Design Structure Matrix
EHR Electronic Health Record
EMA European Medicines Agency
EMR Electronic Medical Record
ETASU Elements to Assure Safe Use
FAERS FDA Adverse Event Reporting System
FDA U.S. Food and Drug Administration
GCP Good Clinical Practice
GSK GlaxoSmithKline
HGP Human Genome Project
HHS Health and Human Services
HIPAA Health Insurance Portability and Accountability Act
HITECH Health Information Technology for Economic and Clinical Health
HRQoL Health Related Quality of Life
ICD International Classification of Diseases
IND Investigational New Drug
NDA New Drug Application
NDC National Drug Code
NIH National Institutes of Health
NLM National Library of Medicine
PCAST President's Council of Advisors on Science and Technology (US)
PCMH Patient Centered Medical Home
PBM Pharmacy Benefits Management
PHR Personal Health Record
PRO Patient Reported Outcomes
RDE Remote Data Entry
REMS Risk Evaluation and Mitigation Strategies
RSM Remote Site Monitoring
SPS System Problem Statement
VA Department of Veteran's Affairs
VUE Visual Understanding Environment
CHAPTER 1: INTRODUCTION
The health industry has evolved from the scientific practice of medicine to a system that spans across many disciplines, public and private initiatives, and vastly different scales. This interconnectedness, in addition to the increase of the aging population and the multiplication of disease categories, has led to a system that is continuously forced to reconcile managing complexity with the opportunities presented by ad hoc and local advancement. The Institute of Medicine estimates that the United States spends $2.6 trillion on health, with $750 billion wasted on procedural inefficiencies, unnecessary services, and inflated costs; this amounts to a 30 percent loss, believed to be a symptom of a suboptimal system that fails to meet the needs of its stakeholders (Institute of Medicine, 2012).
Data in the health system is becoming more pervasive and its definition expands as new devices and technologies are created. However, the system has yet to evolve into an information system and data is managed within established stakeholder silos and is generally inaccessible from the outside, with no standard grid for data to flow or
incentive to share it. This data is an assortment of observations and reports varying from science to clinical notes and reimbursement claims that emerge from practice rather than design. We believe this data holds more information than is currently used and has potential to significantly improve the state of the health system.
The objective of this work is to arrive at a definition of health data and use that definition to understand the system of health for its ability to generate, transform, and interpret data. We view this as a prerequisite to understand the system of health as a learning system. With that in mind, we overview the different meanings data has throughout the health system, we analyze the inefficiencies and trends as they emerge from data, and propose a new architecture for the system of health in which data can no longer be thought of as accidental.
The result of this thesis is a new architecture for the system of health that is consistent with its present state but also consonant with the aspirations of a learning health system. Our interpretation of learning, borrowing from the artificial intelligence literature, is the process by which models and prior beliefs are updated given new data. We try to reconcile this definition with the aspirations of learning in health.
We use the insight gained from analyzing the inefficiencies, in combination with the principles of system design, to envision a health system that is patient and information centric.
Through the methodical evaluation of data types, sources, and interfaces, we introduce the conundrums in the current system. The two data problems outlined below summarize the questions and impediments to learning that emerge from our overview of the system through the lens of data.
Data problem #1: Data input to the clinical decisions that drive the entire system is unnecessarily limited.
1.1 Data sourced outside the clinical environment, beyond the purview of the provider system, does not have a defined use in the current health system. This includes patient sourced data from physiological monitors that do not yet have a standard entry into the care system.
1.2 Clinical decisions are made based on the data available. The selection of data collected to make these decisions is largely driven by consensus expectation and provider specific intuition. This suggests the introduction of unintended bias and inconsistencies that easily propagate to every decision.
1.3 There is no standard mechanism for the patient to provide feedback to the product manufacturer or to the care system after an intervention.
Data problem #2: There is no mechanism for data to flow through the system. Rather the flow of data is easily interrupted, which results in suboptimal decisions and missed opportunities for knowledge sharing.
2.1 There is no standard way for specific patient information to transfer between providers; either through referrals or during care transitions.
The result is a patient history at the point of care that is guaranteed to be incomplete.
2.2 Payors make decisions to reimburse for care based on transactional data from the provider. The content of this data has limited clinical information and is not a complete representation of the patient's health status.
2.3 Medical product data generated during the development process is not released in full after the product has been approved for commercialization. The system relies on the summary data that is hard to interpret in the context of a single patient, such as labels, medication guides, and publications.
1.1 Background on the Health System
In this section we summarize the critical aspects of the health system that are needed to understand the analysis done in this thesis, namely its six main stakeholders -patients, providers, payors, manufacturers, regulators, and distributors - and the way in which value is currently delivered. We use Crawley's system architecture methodology to guide our definition of the system and to introduce the system problem statement that can then be used to analyze alignment between stakeholders.
1.1.1 Stakeholder Definition
In principle, the patient is the direct beneficiary of the health system. The current system considers individuals as patients upon their entry to the care system. The only individuals today that are always considered patients are those with chronic conditions. For our analysis of the future scenario we will eventually broaden this definition to consider an individual who aspires to manage his health - either from within or outside the care system.
Manufacturers of medical products, including drug therapies and devices, are solution providers to the system. Manufacturers benefit from the revenue generated from the sale of their products. The global pharmaceutical market is significant with revenue
reaching $880 billion (Hirschler, 2012). The scope of the manufacturer stakeholder in this thesis is primarily pharmaceutical companies, or drug sponsors.
Manufacturers and patients have remarkably different objectives. Manufactures benefit from volume and repeated use of their products, while patients seek personalized treatments and unique cures. These needs are indicative of the nature of tensions in the system.
The other stakeholders are providers, payors, distributors, and regulators. Providers are individuals or institutions that provide health care services and payors are the funding arm for these services. There are nearly 200 major private payors in the United States, the leaders including Aetna, Humana, Kaiser, Unitedhealth, and Wellpoint, with collective revenues reported at $884 billion (HCAN, 2012). Payors coordinate directly with distributors and providers to reimburse for the cost of products and services.
Distributors close the loop back to the patient by managing the medical product stream from the manufacturers. The scope of the distributors used in this thesis is primarily drug distribution from pharmaceutical companies to patients. This type of distributor is also referred to as a pharmacy benefits manager, or PBM. The two largest PBMs, CVS Caremark and Express Scripts/Medco, process the prescriptions of an estimated 200 million people in the United States, with annual revenues of each of these companies exceeding $15 billion (NCPA, 2011).
Regulators assume the role of watchdog of the system to ensure product safety and ultimately resolve the aforementioned tensions. Regulators coordinate closely with the manufacturers and oversee the commercialization of products. The scope of the regulator stakeholder used in this thesis is primarily the United States FDA's regulation of drug products.
Combined, these six stakeholders account for economic activity north of $2 trillion.
1.1.2 Stakeholder Network Flow
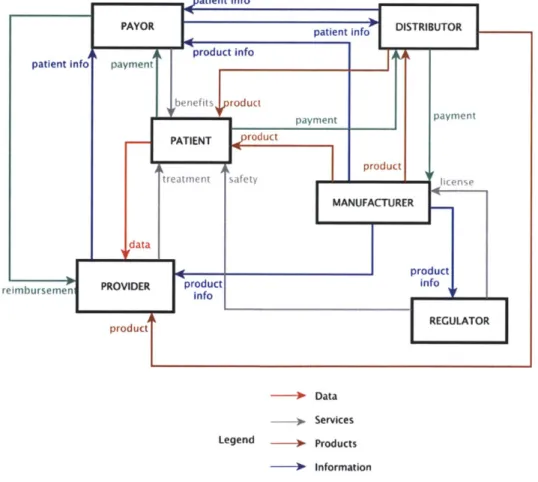
Figure 1 summarizes the nature of the flows between the stakeholders in five ways: data, services, products, information, and money. We develop these flows from interviews with stakeholders and review of the literature. The network flow is a convenient way to synthesize the vastness of the system and we use the outcome to identify the needs of each stakeholder (Appendix B). Following Crawley's framework, we interpret these needs into goals to derive the system problem statement (section 1.1.3). -- * Data -- + Services Legend 3- Products -0 Information -* Money
A significant takeaway from Figure 1 is that individual health data, that is, observables about a patient's health, are only exchanges at the patient-provider interface. All other exchanges between stakeholders are on products, payment, services, and summary information. The patient is the source of the data and is the receiver of care services, however, information does not flow directly to the patient. Rather, it is managed by the other stakeholders. As a matter of fact patients may find it cumbersome to gain access to their own complete health record. This contradicts the concept of a patient-centric system that has been previously defined by the Institute of Medicine (Institute of Medicine, 2001). The network flow diagram shows that the patient supplies the system with unlimited amounts of narrowly defined data and is not the primary receiver of information.
1.1.3 System Problem Statement
According to Crawley's framework, the system problem statement takes the form of a "to, by, using" sentence. Based on our stakeholder analysis, we derive the following system problem statement for the current health system:
To treat symptoms and diseases, By providing care services,
Using available medical information and products.
A recurring observation, pervasive in the literature, is the divergence of the current health system with the intended system. The inefficiencies presented earlier in this chapter indicate that the runaway costs and stagnant number of new drugs approved are symptoms of this divergence. Our analysis of the current system aligns with this shift, as we have indicated with the limited role of the patient. We believe that the root of the problem may be found by examining how the system utilizes the information it generates. Hence the objective of this thesis to focus on the data each
stakeholder needs and how they capture, use, and report the information as they fulfill these needs.
1.2 Methodology
We collected information about data in the health system through stakeholder interviews, from industry conferences and academic seminars, and through review of the most recent literature. Our analysis of current stakeholders' perception of data emerges from the reports published by key opinion leaders in health, namely the United States Food and Drug Administration (FDA), European Medicines Agency, United States President's Council of Advisors on Science and Technology (PCAST) reports, and several reports by the Institute of Medicine. We complemented this information with interviews to founders of companies working on implementing new health innovations.
Throughout the thesis we use several system and visualization tools. We use Crawley's framework of system design to define the stakeholder network, identify stakeholder needs, and derive a system problem statement. We continue to use the stakeholder method to organize the data, as a first level analysis. After compiling the data, we apply adjacency and design structure matrices to assess the cross-stakeholder communication and to define data dependencies. We use process modeling methods, namely data flow diagramming, to represent the flow of data as the patient interactions with the health system. We analyze our data flow diagram from various perspectives, and we arrive at an architecture for a system design concept using topology-preserving transformations of the flow diagram. We compare this method to object-process modeling to verify the system characteristics, identifying form and function. We compare our system representation with examples of data driven trends to ground our process and provide relevant insight to the analysis.
1.3 Thesis Outline
The thesis is organized as follows: In chapter 2, we describe the kinds of data that are associated with each stakeholder, creating the landscape of data referenced throughout the thesis. We explore the sources of data, how it is used, and where it resides in the system. The data analysis continues in chapter 3 with visualizations of data flow, defining the communication paths and dependencies. Taking a perspective beyond the stakeholders, we further compare the data against a set of attributes and assess value. In chapter 4 we merge the data analysis methods to derive the patient interaction data flow diagram to holistically view and analyze data as a whole. We discuss the impact when stakeholders have partial information through structured review of the interaction diagram. We continue referencing the interaction diagram in chapter 5, while we discuss the data driven trends and current state of the industry. Chapter 6 we revisit the system structure and through an architectural transformation derive the system vision for an improved health system that is based on knowledge generation and learning.
CHAPTER 2: HEALTH DATA LANDSCAPE
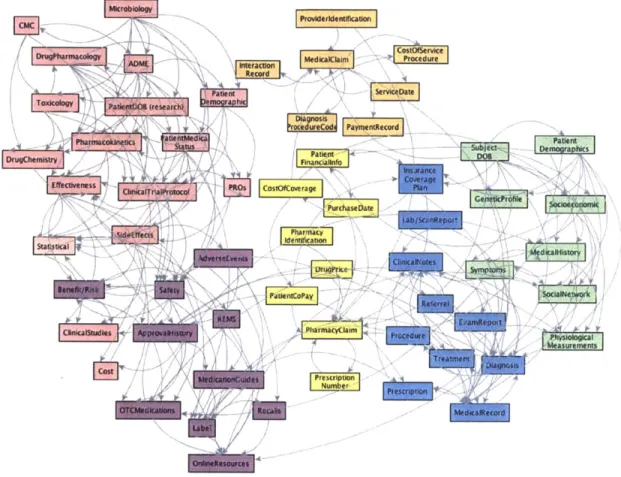
There is no single interpretation of data in the current health system. Figure 2 shows a visualization of several kinds of data to allude to the complexity of the system and the data it manages. In this chapter we define the meaning of health data. Results of this research are a better understanding of what data means in the health system and more insight into the role of each stakeholder.
r
at*,*a---Figure 2: What is data?
This figure shows the landscape of kinds of data present in the health system. Colors reflect the stakeholder managing the data and arrows correspond with dependencies.
Boxes indicate kinds of data of significant indexes used to sort data. This figure tries to capture the complexity of sources and meanings of data in the system of health absent a structured architecture for data in the system. The diagram is sorted by stakeholder; that sorting proves to be insufficient to understand the value of data, the inefficiencies that emerge from the lack of a data architecture, and the meaning one might want to ascribe to learning in health.
2.1 Landscape overview
We follow the stakeholder convention defined in chapter 1. Namely, there are six stakeholders - provider, patient, payor, manufacturer, regulator, and distributor. The data landscape assessment starts with a structured review of the kinds of data that each stakeholder manages. The data ranges from clinical measurements that inform patient health to administrative transaction records that reimburse care services. The breadth of kinds of data is as varied as the functions and needs of each stakeholder. We review various types of documents and enumerate the data housed within, resulting in nearly 500 distinct kinds of data. We sort the data into categories and subcategories to ease our analysis.
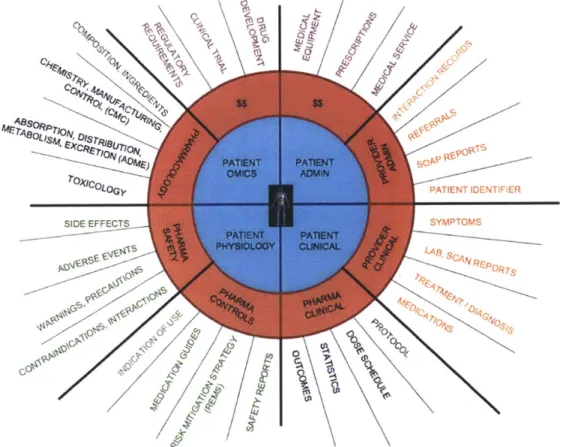
Figure 3: Visualization of Health Data Categories
In Figure 3 we outline the data categories with the patient at the center because our research suggests that no other element is shared across all the different kinds of data. We revisit this point when we review the flow of information creation in chapter 4.
Other data elements build off of the patient and are transformed, reformatted, and modified as they flow through the system among the stakeholders. The figure shows the extent of sources used to collect the data pieces and the organizational approach taken to envisage an understandable, yet comprehensive landscape.
This chapter looks at the landscape of data, without considering the level of adoption for each kind of data. The purpose is to give a holistic overview and we describe how the data is being used in subsequent chapter. Perceiving data from its stakeholder origin is convenient to start the assessment, but later we challenge the view and suggest alternate categories of data.
2.2 Provider Data
Providers are in direct contact with patients, with whom they often have multiple encounters a year. Providers collect, store, and maintain patients' detailed medical and interaction records. The format of these records is changing from paper-based to digital, with the worldwide adoption of electronic health records (EHRs). EHRs will provide electronic storage of patient data and the content is indicative of the type of data that is managed by the provider. Therefore, review of EHR data fields and format sufficiently defines the provider data and is used as a starting point for this analysis.
We compared ten major EHR vendors including AthenaHealth, Practice Fusion, Care360 Quest, Epic System, eClinicalworks, and NexGen Healthcare. Although the products themselves vary among vendors, the content of data within the EHR is comparable. Figure 4 shows an EHR screenshot from NexGen Healthcare, displaying the various fields of data.
i omc, JldBaayJOse MD
N. ifedUei Sot Hum MabtemW. flto~ole Satow...O AP.-M Pstt "It obaeV
"Adt
Office %Ask Phys"kaE It Tefame 17 bCU a ALTI
Echocatdloam Amn PSAMPM' PSA Toot f e e C
Nukiron Assessmenwt caten~seep 1ai 20 'IC
Sir os Master SW.nleMP II BWN'" WneN"****4
FBTO I3 I EKO TI
$i"ess Nucla indnZa vaC $I r laos* Too
-Figure 4: EHR screenshot from NexGen Healthcare
("EHR Market," 2009)
There are approximately 60 kinds of data that can be inputted into this single EHR screen, collected during the patient interaction with the provider. Some are administrative data such as name of patient, time, date; and some are clinical data such as temperature, blood pressure, and allergies. Although the EHR has the data content we seek for our analysis, the format is intended for provider input and it is not useful for data analysis. We reorganize the data elements into the administrative and clinical
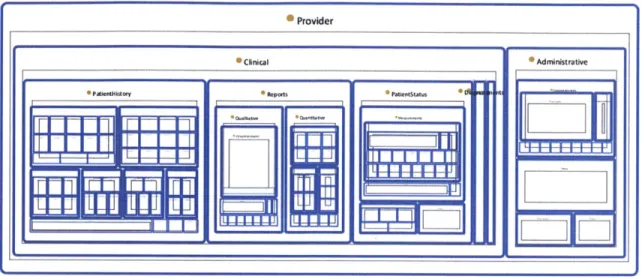
*Provider
olnical Administrative
Figure 5: Visualization of Provider Data Categories
Created with Protege software to compile and categorize the data contents within the 10 EHR implementations
The next two sections describe the kinds of data within these two categories in more detail.
2.2.1 Administrative Data
Administrative data includes all of the information needed to identify a patient and track encounters between the patient and provider. Administrative data is organized into four categories: identifiable, encounter, billing, and follow-up; Figure 6 shows further details. Patient identifiable data include name, demographics, contact
Administrative PatientAdmininfo Billing Insurance Codes Contactinfo Diagnosis Name Procedure Address Services Telephone Supplies Uniqueldentifler PaymentAmount Demograpics PaymentSource 0 HMO Gender Medicaid ZipCode Medicare Race NoCharge Ethnicity PPO Status Privateinsurance Marital SelfPay Student WorkerCompensation Employment Occupation ' EmergencyContact EncounterRecord Followuo AdmilssionRecord Procrdon AppointmentRecordecord Pharmacy DischargeRecord Referral ReasonFor~lisit
Figure 6: Categorization of Provider Administrative Data
The encounter subcategory includes information about the patient interaction with the
provider such as appointment records, admission/discharge records, and reason for visit. Referrals to other providers and corresponding contact information are included in the follow-up subcategory, in addition to prescription refill requests and pharmacy information. The billing subcategory contains the data used to generate a claim -diagnosis and procedure codes - and information about a patient's health insurance carrier and plan (section 2.4).
2.2.2 Clinical Data
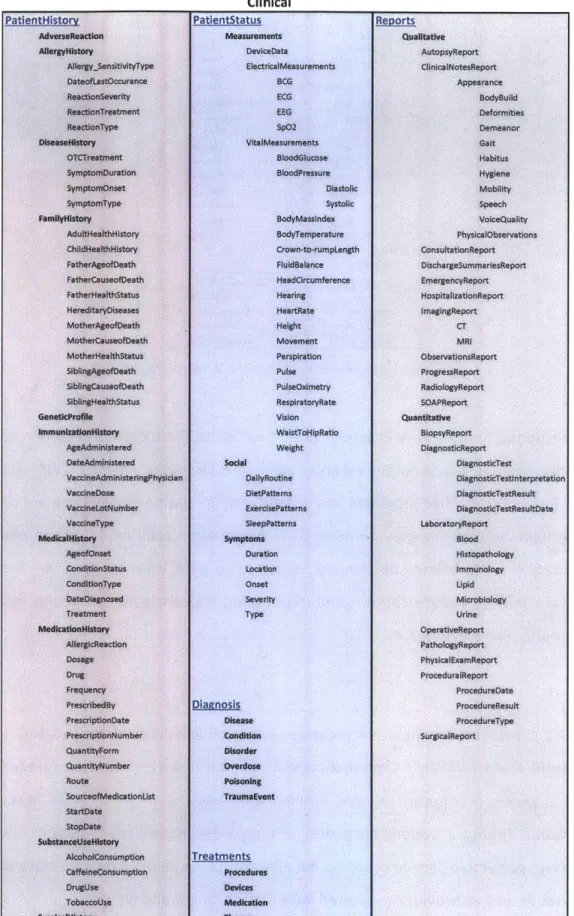
Figure 7 shows the five main subcategories within clinical data: history, status, reports, diagnosis, and treatment. Data in a patient's clinical history - diseases, family health, past surgeries or operations, and administered vaccines - are inputs to provider diagnosis. During a patient encounter, the provider characterizes patient status by collecting subjective patient reported data like symptom descriptions, exercise and diet routines as well as provider-measured data such as height and weight.
Clinical PatientStatus Measurements DeviceData ElectricalMeasurements BCG ECG EEG Sp02 VitalMeasurements BloodGlucose BloodPressure Diastolic Systolic BodyMassIndex BodyTemperature Crown-to-rumpLength FluldBaIance HeadClircumference Hearing HeartRate Height Movement Perspiration Pulse PulseOximetry RespiratoryRate Vision WalstToHIpRatIo Weight Sodal DailyRoutine DietPattems ExercisePatterns SleepPattems Symptoms Duration Location Onset Severity Type Diamnosis Disease Condidon Disorder Overdose Poisoning TraumaEvent imption Treatments umption Procedures Devices Medication Therapy
Figure 7: Categorization of Provider Clinical Data
Revorts Qualitative AutopsyReport ClinicalNotesReport Appearance BodyBuild Deformities Demeanor Galt Habitus Hygiene Mobility Speech VoiceQuality PhysicalObservations ConsultationReport DischargeSummariesReport EmergencyReport HospitalizationReport ImagingReport CT MRI ObservationsReport ProgressReport RadiologyReport SOAPReport Quantitative BiopsyReport DiagnosticReport DiagnosticTest DlagnostlcTestinterpretation DiagnosticTestResult DiagnosticTestResultDate LaboratoryReport Blood Histopathology Immunology Upid Microbiology Urine OperativeReport PathologyReport PhyslcalExamReport ProceduralReport ProcedureDate ProcedureResult ProcedureType SurgicalReport
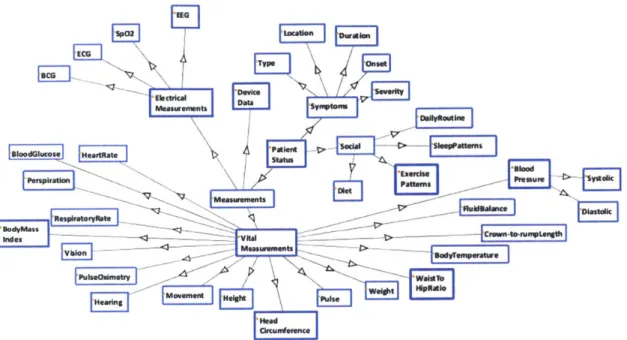
Figure 8 represents graphically the patient status subcategory from Figure 7. This illustration is useful for the patient input data discussion.
=BEG Musweents at m HeBring Movenen ... Vo pgiant OlScts
Figure 8: Visual Illustration of Provider Clinical Subcategory, Patient Status
Clinical data that is collected in reports contains both quantitative and qualitative data
elements. Qualitative reports consist of consultation notes and progress reports. These are typically subjective measurements or observations made by clinicians. These
reports, especially scanning reports require a degree of interpretation. Examples of quantitative reports are physical exams, biopsy reports, and most laboratory reports.
This is actual measured and physical data that typically has a numerical value that is documented during the patient encounter or on a test report.
Diagnosis data are statements of provider's interpretations of a patient's state based on known, defined symptoms. This may be diseases, disorders, or conditions. There are also several forms of diagnoses that include naming of a disease or dysfunction, indication of degree of abnormality, or nosological coding. Each clinical diagnosis has a corresponding diagnosis code, classified by the international classification of diseases
(ICD). During the diagnosis process, physicians match their judgment on the state of the patient to a standard diagnosis. Selected a diagnosis code is a form of matching to a category system, with the ICD being the taxonomy of codes.
The ICD, updated and maintained by the World Health Organization (WHO), is used to classify diseases and other health problems and the codes are the basis for reimbursement. Figure 9 shows a screenshot from the ICD-10 online browser, which includes over 16,000 codes.
Malignant neoplasms of respiratory and
intrathoracc organs
0 Malignant neoplasm of nasal cavity and middle
Mlignant neoplasm of accessory sinuses
Maigant neoplasm of lrn
Malignant neoplasm of trachea
Malignant neoplasm of bronchus and lung
Malignant neoplasm: Main bronchus Malignant neoplasm: Upper lobe. bronchus
or lung
Malignant neoplasm: Midde lobe, bronchus
or lung
Malignant neoplasm: Lower lobe, bronchus
or lung
Malignant neoplasm: Overlapping lesion of
bronchus and hang
Malignant neoplasmn: Bronchus or king,
unspecified
Malignant neoplasm of thymus
P Malignant neoplasm of heart, medastinum and
pleura
i Malignant neoplasm of other and 1Il-defined
sites in the respiratory system and intrathoracic
organ
o Malignant neoplasms of bone and articular cartilage
i Melanoma and other malignant neoplasms of skin
- Malignant neoplasm of bronchus and lung
C34.0 Main bronchus Carina
Hilus (of lung)
C34.1 Upper lobe, bronchus or lung
C34.2 Middle lobe, bronchus or ung
C34.3 Lower lobe, bronchus or lung C34.8 Overlapping lesion of bronchus and lung
[See note 5 at the beginning of this chapter]
C34.9 Bronchus or lung, unspecified
Malignant neoplasm of thymus
Malignant neoplasm of heart, mediastinum and pleura
xcI.: mesothelioma (C45-) C38.0 Heart
Pericardlum
Exci.: great vessels (C49.31
C38.1 Anterior mediastinum C38.2 Posterior medlastinum
C38.3 Medlastinum, part unspecified
C38.4 Pleura
C38.8 Overlapping lesion of heart, medlastinum and pleura
Figure 9: ICD-10 Screenshot of Lung Cancer Disease Classification
("ICD-10 Version:2010," 2010)
ICD-10 CM and ICD-10 PCS are the national modifications of ICD-10, which include more detail about clinical modifications of diseases (CM) and procedures (PCS). These databases are maintained by the United States' Centers for Disease Control and Prevention (CDC) and contain 68,000 and 76,000 codes respectively ("ICD -ICD-10-CM -International Classification of Diseases, Tenth Revision, Clinical Modification," 2012).
The provider treatment subcategory contains information about the therapy or medication that is prescribed as a result of a patient encounter or report analysis. There are many other subcategories of medication, including drug type, dosage, and frequency, as indicated in the medication history subset. The provider clinical record includes the drug prescribing history, but does not account for when the drug is actually distributed to the patient.
We make three observations based on the assessment of provider data. First, some of the data collected is subjective and the provider needs to interpret the data based on experience and knowledge. Second, the diagnosis is a result of a matching process to taxonomy of codes, indicating that the provider must select a pre-defined category that
most represents the patient state. Third, the provider data collection is more focused on diagnosis and intervention selecting, rather than monitoring for outcomes.
The EHR and ICD standards suggest commonality, however there is still much operational and workflow variance among providers, resulting in a wide range of data quality. As well, patients visit several different providers during their lifetime, so the records kept by a single provider do not always reflect the patient's complete medical history. Next, we discuss data that is collected and owned by the patient that can be used to supplement the data managed by the provider.
2.3 Patient Data
From a data perspective, patients are the ultimate source, with data being collected through testing, sensing, monitoring and direct query. However, the way in which the health system incorporates this data varies by stakeholder.
New technology is enabling the collection of data outside of the traditional provider environment. The kinds of data discussed in this section are patient input data into
personal health records, dynamic physiological signals, and patient acquired genetic information.
2.3.1 Personal Health Record
Much of the data captured in a patient's medical record or EHR originates from the patient. During patient encounters with providers, patients share information about their symptoms and behaviors, and report on treatment feedback. In most cases, this
is where data input stops. Patients typically do not document this kind of data, so the provider record is relied on for data collection and storage.
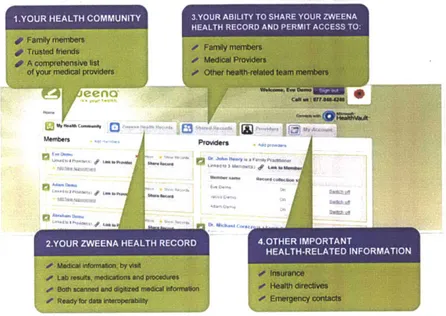
In some cases, patients may decide to maintain a health diary or personal health record (PHR), although currently not the norm as PHR adoption is low. PHRs are effectively like EHRs but are managed by the patient. A patient may use a PHR to collect all health information and maintaining a personal medical record for individual access. In addition to information from their EHR like allergies, lab results, and medications PHRs may include patient-reported outcome data and passively collected data from monitoring devices. Examples of PHR vendors for the patient consumer include Doclopedia, EmryStick, JuniperHealth, MiVIA, and ZweenaHealth.
Lw
Figure 10: ZweenaHealth PHR Features ("ZweenaHealth," 2012)
Services like Zweena claim to enable 24/7 access to complete medical records through an online secure platform. A benefit to the patient may be convenient management of the compilation of their health data from various sources. Patients own their PHR and have the option to permit external access or integration to a provider EHR system. The data in the PHR is from the perspective of the patient, while the EHR remains provider-focused. Both datasets may be used in tandem to yield a more holistic view of the patient's medical status, given the increase adoption of PHRs.
2.3.2 Physiological Measurements
Often the physiological signals measured during a patient-provider encounter, like blood pressure or heart rate, are not reflections of day-to-day average measurements. As well, these point-of-care collected data points do not give indication to conditions like arrhythmia, seizures, or other episodic driven disorders. Remote physiological measurements create a new category of data, which is in between encounter measurements, and may give a different view on of data. The results can provide additional data to enhance the clinical assessment of the patient. Table 1 lists several of the physiological signals that can be dynamically measured.
temperature of mouth, skin, ear, under arm, or
anus
Aoral normothermia 37C)
___
arterial palpation of the heartbeat to determine
cardiac performance
number of heart beats per unit time (typ 60-90 bpm), measure of exercise efficiency pressure exerted by circulating blood upon the
ure walls of blood vessels (avg 110/65 - 140/90 mmHg), measure of cardiovascular health number of breaths per unit time (60 sec) typicall
ate 12-20 for adults, indicator of potential respirator dysfunction
ce human homeostasis, amount of fluid lost from ti body is equal to the amount of fluid taken in thermoregulation, production of a fluid consistin n primarily of water as well as various dissolved
solids (chiefly chlorides), that is excreted by the sweat glands t Vision hearing weight -- height body mass index waistto hiprat blood glucos EEG ECG, EKG BCG SpO2 blood press respiratory r fluid balan perspiratio movemen
io girth ratio - measure of regional fat
distribution-e measurable amount of glucose (sugar) in the blood
Electroencephalography, electrical activity in br, to assess brain death, seizures
Electrocardiography, electrical activity in heart t assess regularity of heart beats
ballistocardiograph, measure of ballistic forces c the heart
oxygenation, oxygen saturation of tissue, blood
body
temperature pulse
heart rateI
Table 1: Description of Physiological Measurements
("Epson Enters Healthcare Business with Wristwatch-Type Pulse Monitor," 2012) ("Wearable Blood Pressure Sensor Offers 24/7 Continuous Monitoring," 2009)'
("Measuring and Managing Fluid Balance," 2011)
Automatic collection of physiological measurements is possible with the use of devices and monitors. There are several hundred ambulatory devices that attach to the body to enable dynamic monitoring of vital signals. Some of these devices are offered direct to consumer (patient), others are provider prescribed. The collected data can either be stored on the device, smartphone, or synced to a PHR/EHR platform. Many of these systems, approved as medical devices, alert the patient and/or provider of
-I
---thermometer, thermocouple, thermistor
finger touch, LED/photodiode, photoplethysmography sensor, electrode monitor on chest or wrist sphygmomanometer, pulse wave velocity
y counting breaths, transducing sensor
e observation, body weight, urine g output,blood chemistry
thermal sensor, LED/pH sensor accelerometer, pedometer, motion sensor
nal Snellen chart
audiometer
i mass scale linear scale
n calculated from weight and height measurements
calibrated tape
enzyme electrode, glucose oxidase strip
ain scalp electrodes
chest electrodes, sensor accelerometer, electrodes near infrared spectroscopy, pulse
oximeter
physical activity
visual acuity, acuteness or clearness of vision, which is dependent on the sharpness of the retii focus within the eye and the sensitivity of the
interpretative faculty of the brain
perceive sound by detecting vibrations through
organ such as the ear
lbs / kgs, needed for medicine dosing inches / meters, needed for medicine dosing BMI, or Quetelet index, heuristic proxy for huma body fat based on an individual's weight and height, indication of obesity
abnormalities and recommend interventions. Table 2 highlights the various features of selected devices with a range of usages.
a corventis- V V V 6/
I
V
SoteraVVV
V &DYMCDM I A+fitbit
Withings
Vv
v
v
VitaDock--- - - V V Vdigifi
v
Vv
v
Table 2: Patient Monitoring Devices
These monitoring devices improve signal capture from an individual data point to a data series collected over a period of time. Data trends can then be analyzed to develop a more complete assessment of patients' health. For instance, Corventis' AVIVO* system features a wearable device that attaches to the chest and measures
fluid status, heart rate, respiratory rate, posture, activity, and ECG. This data is transmitted to a handheld device that is connected to Corventis' clinical monitoring center. The physiological trends are reviewed by the patient's physician who uses the data to track heart failure and guide clinical decisions, enabling early intervention. (Corventis, 2012)
How the AVIVO' MPM System Works
Remote monitoring of physiological parameters
aink Mobdie
... WerableNX i n Transmittet Wearable Pix,
automatically collecting and transmitting data
Physcin Access Data Analysis
Figure 11: Corventis' Mobile Patient Management System for Heart Failure Patients
2.3.3 Genetic Data
Over 1,300 genetic tests have been developed since 1986 with about 1,000 currently available from testing laboratories ("Personalized Medicine: Trends and Prospects for the New Science of Genetic Testing and Molecular Diagnostics," 2012). Genetic data is determined by collecting a sample of DNA from blood or saliva that may be used to:
* diagnose disease
* confirm or rule out suspected genetic conditions
* determine risk of developing or passing on a genetic disorder
* inform the type or dose of a drug that will yield an effective response * determine variety of predispositions, characteristics, and phenotypes
Testing service companies now offer DNA analysis direct to consumer. For approximately $100, individuals can obtain genetic comparison of their DNA to 120 diseases, 57 traits, 48 carriers, and 21 drug responses ("Genetic Testing for Health, Disease & Ancestry; DNA Test - 23andMe," 2012). This is a limited amount, compared to the 16,000 ICD disease codes. Direct to consumer genetic testing vendors include 23andMe, deCODE Genetics, easyDNA, and VuGene. It is intended and claimed by these vendors that genetic data may be used to individualize care and inform clinical decisions.
Advancements in science, technology, and information systems are enabling patients to take a more active role in their health and be at the forefront of their own data collection. Monitoring devices are infiltrating every day life and knowledge of the chemical makeup of the human body continues to advance, and so do the personal data collection opportunities. Services are beginning to cater to the well-informed
patient, although adoption by patients remains low.
2.4 Payor Data
Most payors, public and private, use the data formats guided by the ICD standard, which enables comparison and we can analyze them together. Each interaction between the patient and provider is translated into a coded claim used for billing and reimbursement. Interactions include outpatient visits, inpatient stays, laboratory services, prescription filling, and medical device distribution. The claim includes the date and place of service and applicable codes, which are used to calculate the payment amount. The Centers for Medicare and Medicaid Services (CMS) provide numerous forms to assist payors in collecting the data required for provider reimbursement. Private health insurers, like Aetna and Tufts Health Plan, may use different claim forms than CMS-1500, but the content is nearly identical. A sample claim form is shown in Figure 12.
HEALTH INSURANCE CLAIM FORM APPROVED BY NATIONAL UNIFORM CLAIM COMMITTEE 08/M6
BLUE CROSS AND BLUE SHIELD OF MN
914 43RD STREET SUITE W-201 ST PAUL, MN 00123-0098 t -PICA PICA
1. MEDICAE MEDICM) CHAMPVA GROUP FECA OTHER I a. INSURED'S I.D NUMBER (Fcr Program in Item 1) l,01oafia] A4dr*0 (sponoouss 5 17 ([]iMaetarm10e)y (sN 0ork p[] s) [1011 X987-1234A-032
2. PATIENTS NAME (Lat Nam. FAt Nane. Middle InWW5 3. PATENT'S RTH DATE SEX A INSURED'S NAME (Lam Nme, First Name, Midle InItal)
THOMPSON, ANNE MARIE, H 12 12 1958 M] F THOMPSON, ROBERT, H
& PATIENT'S ADDRESS (No.. 1ree 6. PATIENT RELATlONSHIP TO INSURED 7. INSURED'S ADDRESS (No., Sro.e
5813 CRADLE ROCK COURT seIL] spre. [CNd 1Er 5813 CRADLE ROCK COURT
CITY STATE 8. PATIENT STA1US CITY STATE Z
ST PAUL MN single [ Mward [x Oth* 7 ST PAUL MN
ZIP CODE TELEPHONE Qnclude Alea Code) ZIP CODE TELEPHONE (Include Area Ccdo) Full-Tim Part-Tim
00123-0054 (001) 5551212 Empd tudn ,= stud.J El 00123-0054 (510 ) 5551212 0
9. OTHER INSURED'S NAME (Last Noa. First Nam. Middle WInal) 10. IS PArI ENT'S CONDITION RELATED TO' 11. INSURED'S POLICY GROUP CR FECA NUMBER
THOMPSON SR, ROBERT, G BSBS54321
a, OTHER INSURED'S POUCY OR GROUP NUMBER a. EMPLOYMENT? (Curnt or Previou* a. INSURFDS DATE OF BIRTH SEX
X0987654321 YES XjNO 01
_18_
I1956 MF
bOTHER INSURED'S MM DOGEPAC)MtDATE OF BIRTH SEX b. AUTO ACCIDENT? b. EMPLOYER'S NAME OR SCHOOL NAME
12 12 1918 MX F YES NO IMN I PRICE WATERHOUSE COOPERS
c EMPLOYER'S NAME OR SCHOOL NAME c. OTHER ACCIDENT? c. INSURANCE PLAN NAME OR PROGRAM NAME z
US ARMY (RETIRED) YES [ NO BLUE CROSS BLUE SHIELD PPO
5-d. INSURANCE PLAN NAME OR PROGRAM NAME I0d RESERVED FOR LOCAL USE d. 18 THERE ANOTHER HEALTH BENEFIT PLAN7
MAMSI SENIOR PREFERRED PPO CLAIM ATTACHMENT [x1YES ["NO #yv, return
toandcompleteItem9a-READ BACK OF FORM BEFORE COMPLETING A SIGNING THIUS FORM. 13. INSUREDS OR AUTHORIZED PERSON'S SIGNATURE I authorize
12, PATIENS OR AUTHORIZED PERSON'S SIGNATURE. I autoriohe rdease ofanymedicSqm or ottr itiron necessary payment of medical beei.ts to the rIrnooar ad ohys=can or sipplm tot to porn... this claim. I Also request payment O government benfrt ahoer to myself or to !he party ro accepts assignrent sarvices described bealow.
SIGNED SOF DATE 07/01/200 SIGNED SOP
1 2 3 4 5 6
14. DATE OFCURRENT: ILLMS9 fis asyptom 15. PATIENT HASHAD E s1S6. IS DATES PATIENT UNABLE TO WORK IN CURRENT OCCUPATION
GIVE FAIRSTr DAEMMIDOI
A 2fl74 PREA7 101 2007 FROM07 101 12007 To 07 20 2007
17. NAME OF REFERlNG PROVIDER OR OTHER SOURCE 17.1 -r- - -18. HOSPITALZATION DATES RELATED TO CURRENT SERVICES
ROBERT SMITH MD 7b NR 0005678 --20-7 FROM- TO 07 . 1 D oy
19. RESERVED FOR LOCAL USE 20. OUTSIDE LAB? $CHARGES
1234567890A [j]YES [ NO 150050 I
21. DIAGNOSIS OR NATURE OF LLNESS OR INJURY (Areo trms 1. 2.3 or 4 to lam 24E lby Lin 22 MEDICAD RESUBMISSICN CODE ORIISNALREF, NO
1.1E88 5 0 190 1 1234S6799S I ABC1234567990
23 PRIOR AUTHORIZATION NUMBER
2 E2i 903_ 5490 123456789123456789123456789555
24. A. DATE(S) OF SERVICE C. I D.PROCEDURES.SERVICES. ORUPPLES E. H I JF J. 2
From To IR E G (Explain Unueuel Circumace DI3NOSIS B tD. RENDERING 2
MM DD YY MM DO W LREEMG CPDMCPCS MODIFER POINTER ISCHARGES S A PRODEER 1D.
7ZIN 1245 MW 1426 TINE 90 HEUs --123450789D2
07 101 107 07 !05 !07 122 1 N 00770 25 26 LT RT 134 1 8751001 61Y NPI 012345789
711|"IN 2245 EMD 1415 A AD123
67890-07 01 07 10701 07 122 1 Y 00770 P2 1P2 P2 12I 134 1 875100 90 N NPl 0123456789
WzXRY WALKER NL!-I 13 4 -7 pz~
--07 | 01 107 07 |01! 07 112 IN IE1399 1 25126 26 1281 12 1 165150 1 N NPI 0123456789
N400026064071 { GOBULIN Ih"N*iVta lUo V41? AV 13 1235679901
07 01 | 07 107 01 07 111 N J1563 RT1 LT 128 1291 13 5001 00 20 N NP 0123456789 m222BIes 7 NUs 1 234S6789901 07 01 07 107 02 07 1 11 1 N A6410 I 13 15 1001 2 I NPI 0123456789 vi 020,20011346780 N 1 12345679901 ! 500100 21N 1~ 0123456789 07 ' 01 's I o7 ! o7 o7 i1 1 Y A41o 25C1 26 1RT TX 1 1% 500 00|2|NN1 02468
25. FEDERAL TAX .D. NUMBER SSN EIN 26. PATENT'S ACCOUNT NO 27 ACCEPT ASSIGNMENT? 2. TOTAL CHARGE 29. AMOUNT PAID 30. BALANCE DUE
555666777888 D Fx 20070613235249 E 2930150 5 3of49* 2900!01
3. SIGNATUREOF PHYSICIANOR EUPPIER 32. SERVICE FACILUTY LOCATION INFORMATION 3. BIWN PROVIDER INFO & FH a (012) 5551212
INCLUDINIG DEGREES OR CREDENTIALS
Iomfy that theestrirmetfenfte rews LABOORP DIAGNOSTC THE PEDIATRICS GROUP appl lo thisllandaa nd a pan l*) 123 HEALTHCARE LANE 1234 MAIN STREET SOF 12/12/2008 ST PAUL MN 00342-1111 COLUMBIA MN 00123-0765
SIGNED DATE * 0123454789 l 13123456789 a 012341!6789 b-13987654321
P"LEASE PRINT OR TE APPROVED OMB-098- g FM 5U0 (UOIU5))MS-1
Figure 12: CMS-1500 SmartForm, Health Insurance Claim Form
("New CMS-1500 (08/05) Healthcare Claim PDF SmartForm With Built in 837P EDI Capabilities," 2007)
As described in the provider section, clinical information about a patient is translated into a standard code that represents the patient diagnoses, procedures performed, services delivered, or supplies tendered. Example codes are shown in items 21, 24D, and 24E in Figure 12 and their meaning can be searched on various online databases, including the WHO and CMS. Most every disease and clinical service has a corresponding code, used nationally for billing. This format defines the communication structure between providers and payors.
Dates are recorded on a claim to capture the time sequence of clinical events. The codes captured in a claim represent the closest description of a diagnosis, procedure, or service for which a code exists. Due to the code renewal schedule, new procedures may be available that do not yet have a unique code. As well, due to the coding complexity and variations among providers, errors in claims are frequently observed. The recorded claim error rates for various payors have ranged from nine to sixty percent, according to the American Medical Association's (AMA) annual health insurer report card (American Medical Association, 2012).
Besides for the series of codes, the payors collect additional information about the patient and provider. Some of this information is also included on the claim form, while some is collected during enrollment. The five categories of data payors use to process reimbursements and management patients are patient administration, product, medical claim, pharmacy claim, and provider information, as shown in Figure 13. These five categories represent five separate databases that payors manage.
MedicalClaim Record0finteractions Outpatient Inpatient Emergency Dates Dental DateOfService DateOfFirstSymptom DateFlirstConsulted DateOfAccident DateOfPregnancy DateOfPridrillness DateOfDisability DateReturnToWork DateOfAdmission DateOfHospitalization DateOfDischarge DateOfPayments Codes Diagnosis Primary (ICD) Secondary (ICD) Procedures HCPCS CPT CDT (dental) CodeModifier ICD Revenue Services Laboratory Supplies MedicalDevices Drug Resubmission Costs ChargeAmount PaidAmount PrepaldAmount CoPay Coinsurance Deductible Reimbursement Days/Units Denialinfo PriorAuthorationNumber
Figure 13: Categorization of Payor Data
PharmacyClaim Druginfo DrugCode (NDC) DrugName PrescriptionInfo Number Date New/Refill DosePerDay DaysSupply Quantity Strength Generic FormularyCode RouteOfAdministration Natureofillness NatureOnfnjury PharmacyInfo PharmacyName Pharmacyidentification PharmacyAddress PrescribingPhysicianinfo PurchaseDate Costs ChargeAmount CoPay Reimbursement Providerinfo ServiceProvider Name Gender DOB Contactinfo ProviderDemographics Providerldentification Uicenseinfo ProviderTaxID ProviderType Specialty PrimaryCarePhysician PrescribingPhysician PlaceOfService FacilityType FederalTaxD Address Telephone Referralinfo EMRVendor AcceptingNewPatients
The data in the patient administrative and product categories may be used before a patient receives care to vet plan eligibility and determine coverage type. Once care has been received, claim processors assess patient eligibility and payment applicableness of the services rendered. Most health care insurance plans have coverage for prescriptions and the details of drug distribution are recorded on a pharmacy claim. This includes the drug code, strength, dosage, and quantity as well as pharmacy and prescribing physician information. Pharmacy claims themselves do not include the diagnosis code relevant to the prescription, but may have a brief description of the patient's condition. Currently, there is no standard link between pharmacy claims and medical claims. Pharmacy related data is further discussed in section 2.7.
The last category is the provider, which includes data about the physician submitting the claim. The payor requests standard information (national identification number, license, specialty, and facility type) in order to properly identify the provider and verify credentials.
The volume and availability of claims have led to analytic efforts aimed at optimizing health care. Groups of payors combine claims about their patients/employers into commercial claims databases, such as PharMetrics, MarketScan, and Medco. Recently, several states in the United States have initiated the development of an all-payer claims database (APCD). This database combines claims of all members within as state for the purpose of facilitating a holistic view of cost and utilization (Patrick, Murray, Bigby, & Boros, 2012). These efforts to collate different kinds of data for the purposes of analysis and research stress further the need to ensure better quality assurance
practices.
The transactions between the payor and provider rely on a series of codes, yet result in decisions that drive the health care system. With limited clinical details to support the claims, the payor's assessment of the value of patient care is based on claim
interpretation. As well, the payor manages five separate databases for each function it provides and experiences an abundance of information due to the nature of the data. The availability of data presents opportunities to relate and compare, regardless of the quality of the data.
2.5 Manufacturer Data
This section overviews the variety of data that is managed by the manufacturers of drug products. We describe the data that is collected during each development phase: pre-discovery, discovery, development, and clinical trials.
The time from drug discovery to adoption is approximately ten years and over that period manufacturers store and maintain data for compounds. The data originates from basic science, pre-discovery, discovery, and evolves into information about the safety, efficacy, and effectiveness of a compound in humans. Several kinds of data are introduced into this process and Figure 14 gives an overview from the perspective of data. We use the United States FDA's regulatory process as an example for this section.
FDA S First in Human Clinical' Tril WI / / / 1~ I, I, ii / jiji I
Figure 14: Categories of Data in the Drug Development and Approval Process
In order to license a drug, regulators must review the clinical trials and other documentation that supports the benefit claims of the drug made by the sponsor, or drug manufacturer. Manufacturers have incentive to adapt their processes and how they manage data to the rules and communications around the regulator.
The manufacturer and regulator sections that follow individually describe the data elements that are enumerated in Figure 14.