Unmet needs in patients with first-episode
schizophrenia: a longitudinal perspective
K. Landolt1*, W. Ro¨ssler1,2, T. Burns3, V. Ajdacic-Gross1, S. Galderisi4, J. Libiger5, D. Naber6, E. M. Derks7, R. S. Kahn7, W. W. Fleischhacker8, for the EUFEST Study Group#
1Department of General and Social Psychiatry, Zurich University Psychiatric Hospital, University of Zurich, Switzerland
2Collegium Helveticum, Institute for Transdisciplinary Research of the Swiss Federal Institute of Technology and the University of Zurich, Switzerland
3Department of Psychiatry, Warneford Hospital, University of Oxford, Oxford, UK 4Department of Psychiatry, University of Naples SUN, Naples, Italy
5Psychiatric Clinic, Faculty Hospital Hradec Kra´love´, Charles University Medical School, Hradec Kra´love´, Czech Republic 6Department of Psychiatry and Psychotherapy, University Medical Center Hamburg-Eppendorf, Hamburg, Germany 7Rudolf Magnus Institute of Neuroscience, Department of Psychiatry, University Medical Center, Utrecht, The Netherlands 8Biological Psychiatry Division, Department of Psychiatry and Psychotherapy, Medical University Innsbruck, Innsbruck, Austria
Background. This study aimed to identify the course of unmet needs by patients with a first episode of schizophrenia and to determine associated variables.
Method. We investigated baseline assessments in the European First Episode Schizophrenia Trial (EUFEST) and also follow-up interviews at 6 and 12 months. Latent class growth analysis was used to identify patient groups based on individual differences in the development of unmet needs. Multinomial logistic regression determined the predictors of group membership.
Results. Four classes were identified. Three differed in their baseline levels of unmet needs whereas the fourth had a marked decrease in such needs. Main predictors of class membership were prognosis and depression at baseline, and the quality of life and psychosocial intervention at follow-up. Depression at follow-up did not vary among classes. Conclusions. We identified subtypes of patients with different courses of unmet needs. Prognosis of clinical im-provement was a better predictor for the decline in unmet needs than was psychopathology. Needs concerning social relationships were particularly persistent in patients who remained high in their unmet needs and who lacked additional psychosocial treatment.
Received 14 September 2010 ; Revised 28 September 2011 ; Accepted 29 September 2011 ; First published online 21 November 2011 Key words: First episode, longitudinal studies, needs assessment, schizophrenia.
Introduction
Despite continuing efforts within the framework of early intervention programmes to identify persons at risk, the initial contact with mental health services of-ten coincides with a first episode of schizophrenia (McGorry et al. 1996 ; Klosterko¨tter et al. 2005 ; Lester et al. 2009 ; Ruhrmann et al. 2010). Early treatment re-duces the potential for an unfavourable course that comprises persistent symptoms, (re)hospitalizations and deficits in social and vocational functioning (Perkins et al. 2005 ; Addington et al. 2007 ; Barnes et al. 2008 ; de Koning et al. 2009 ; Farooq et al. 2009 ; McGorry et al. 2010). First-episode patients benefit
from a treatment approach that decreases pathological symptoms but also focuses on psycho-social functioning (Penn et al. 2005). In many cases, such functioning has already deteriorated before the exacerbation of the first psychosis ; in young people, psychosocial development is impaired by the illness and those persons remain at a low level of functioning (Ha¨fner et al. 1999). Most of the negative changes in social disability attributed to schizophrenia occur in the first 2–5 years of illness (an der Heiden & Ha¨fner, 2000). Thus, stopping this process is a core component of successful treatment (an der Heiden & Ha¨fner, 2000). One way to develop better treatment strategies is to monitor changes in treatment needs over time and to identify the conditions under which they arise. Assessing treatment needs is an established element of clinical practice and service evaluation. In this con-text, needs are defined as the potential to benefit from (mental) health care (Wiersma, 2006), that is reversing * Address for correspondence : K. Landolt, M.Sc., Research Unit for
Clinical and Social Psychiatry, Psychiatric University Hospital, Milita¨rstrasse 8/PO Box 1930, 8021 CH-Zurich, Switzerland.
(Email : [email protected])
a deficit by treatment. A more realistic definition states that needs are the prerequisite for maintaining or re-storing an acceptable level of social independence and quality of life (McCrone et al. 2001). The concept of needs has been criticized because it presupposes an effective, but general, treatment that works for every patient with a given diagnosis, and for confounding the identification of a need with its potential solution (Priebe et al. 1999a). Nevertheless, the widespread use of needs assessment in research and practice calls for critical appraisal.
Several interviews for assessing needs for care have been developed. The most commonly applied are the Needs for Care Assessment (NCA ; Brewin et al. 1987) and the Camberwell Assessment of Need (CAN ; Phelan et al. 1995). The NCA includes an elaborate evaluation of psychopathology and psychosocial status. The NCA and its revised form, the Cardinal Needs Schedule (CNS ; Marshall et al. 1995), are more extensive than the CAN, and hence the latter is gen-erally used in larger studies (Kilian et al. 2001).
The CAN inquires about 22 potentially problematic areas of living, and differentiates among (1) ‘ met needs ’ (patient has a specific need and this need is met by treatment), (2) ‘ unmet needs ’ (specific needs that are not met by treatment), and (3) ‘ no needs ’ (patient does not have a need in this area of living). Several attempts have been made to establish groupings of the CAN items. However, the results from studies using data reduction techniques have been inconsistent (Wennstro¨m et al. 2004 ; Korkeila et al. 2005) and none of the factor solutions have become widely accepted or replicated. Here, we propose an alternative approach in which several classes of patients are identified who show different trajectories of needs over time.
Most research using the CAN considers only patients with a chronic or well-established illness. Our study is the first to adopt that approach in determining needs within first-episode schizophrenia. Treatment of acute episodes can be divided into three phases. The acute phase (weeks or a few months) is followed by a post-acute stabilization phase (3–6 months), and then by a stable phase of (partial) remission (months to years) (DGPPN, 2006). All of these phases should be examined when evaluating the progression of needs in first-episode patients over time.
Aims of the study
Three questions are addressed by the present study : (1) What is the course of needs over a 12-month
period in first-episode patients compared with chronic schizophrenia patients ?
(2) Can we identify clusters of patients with different trajectories of unmet needs ?
(3) If so, what are the variables associated with those trajectories ?
Method Database
Our study used data from the European First Episode Schizophrenia Trial (EUFEST ; Fleischhacker et al. 2005 ; Kahn et al. 2008). In the EUFEST, four second-generation antipsychotics (amisulpride, 200– 800 mg ; olanzapine, 5–20 mg ; quetiapine, 200– 750 mg ; and ziprasidone, 40–160 mg) were compared against each other and against treatment with a low dose of haloperidol (1–4 mg) (Kahn et al. 2008). The main outcome measure was 1-year medication reten-tion rates, that is the proporreten-tion of patients who con-tinued with the same medication and the same initial dosage. In addition, a battery of outcome and diag-nostic measures was assessed at defined time points for all patients who did not withdraw informed con-sent or drop out for other reasons. The precon-sent study investigated a selection of those measures.
Sample
Fifty mental health centres in 13 European countries and Israel were selected for participation. Altogether, 1047 patients were screened for eligibility between December 2002 and January 2006. Inclusion criteria were ages 18–40 years ; a DSM-IV diagnosis of schizo-phrenia, schizophreniform disorder or schizo-affective disorder ; onset of positive symptoms dating backf2 years ; use of antipsychotic drugs forf2 weeks in the previous year or forf6 weeks at any time; and no known intolerance or contraindication for one of the study drugs. Diagnoses were confirmed by the Mini International Neuropsychiatric Interview (MINI-Plus ; Sheehan et al. 1998). In all, 498 patients gave informed consent and were randomly assigned to five treatment groups. The study protocol was evaluated by local ethics committees or review boards according to country-specific laws.
Attrition rate
Attrition was not similar to loss of retention of the study drug because patients were followed up beyond loss of retention. Of the 498 patients initially included, 342 (68.7 %) completed the assessments scheduled by the study according to protocol. Of the 156 with-drawals (31.3 % of the baseline total sample), in-vestigators withdrew six, and another four did not meet the inclusion criteria. The remaining 146 patients decided by themselves not to continue the study by withdrawal of consent or no-show. Fig. 1 presents an
adapted flow chart for the sample used in our analyses (shaded boxes). More details about the entire trial are included within the main EUFEST paper (Kahn et al. 2008).
Measures
Met and unmet needs were evaluated according to the CAN (Phelan et al. 1995), which assesses ratings by patients and also by therapists, case-workers or research assistants. Because scores can differ substan-tially between patients and professionals, it is import-ant to consider whose perspective is reported when needs are discussed (Slade et al. 1996, 1998 ; Issakidis & Teesson, 1999 ; Priebe et al. 1999a ; Lasalvia et al. 2000 ; Hansson et al. 2001 ; Macpherson et al. 2003 ; Wennstro¨m & Wiesel, 2006 ; Wiersma, 2006). Validity and reliability were previously established in several studies and deemed acceptable (Phelan et al. 1995). In the original paper, inter-rater reliability was r=0.99 (patients) and r=0.98 (staff), and test–retest reliability between r=0.78 (patients) and r=0.71 (staff) (Phelan et al. 1995). However, test–retest reliability was not adequate for some single items (Kilian et al. 2001), but this could be due to skewed distributions of the re-spective items (Phelan et al. 1995).
We also used the Positive and Negative Syndrome Scale (PANSS ; Kay et al. 1987), the Manchester
Short Assessment of Quality of Life (MANSA ; Priebe et al. 1999b), the Calgary Depression Scale for Schizophrenia (CDSS ; Addington et al. 1993) and the Global Assessment of Functioning (GAF ; Jones et al. 1995). In addition, the Hayward Scale assessed com-pliance (a one-item seven-point rating scale, with higher scores suggesting better adherence ; Kemp et al. 1998), and prognosis was evaluated along a six-point scale that ranged from 1=best to 6=bad.
The PANSS measures positive and negative symp-toms and the general psychopathology of schizo-phrenia. Consisting of 30 items, it is scored by a trained rater during a structured interview of 30–40 min. Leucht et al. (2005) proposed that a re-duction of 50 % (respectively of 25 % in treatment-refractory patients) indicates treatment success. We used the 50 % criterion, even though the exact level of symptom reduction indicating response has been debated (e.g. Kinon et al. 2008), because this was only used to describe the sample. The percentage reduction was calculated after subtracting 30 (the minimal score) from the PANSS sum score. The CDSS, a nine-item scale, measures the level of depression in schizophrenia with good reliability (Addington et al. 1992). A cut-off of seven points re-fers to a specificity of 82 % and a sensitivity of 85 % for detecting major depressive episodes (Addington et al. 1993).
1047 patients assessed for eligibility
549 ineligible 498 patients randomised
207 patients discontinued study drug (loss of retention)
144 patients completed follow-up (69.6%)
198 patients completed follow-up (68.8%) • 57 patient withdrawal
• 1 inclusion criteria not met • 5 investigator withdraws patient
93 patients lost to follow-up (31.2%)
63 patients lost to follow-up (30.4%)
• 89 patient withdrawal • 3 inclusion criteria not met • 1 investigator withdraws patient
291 patients continued study drug until-drop out of follow-up • 103 haloperidol • 104 amisulpride • 105 olanzapine • 104 quetiapine • 82 ziprasidone • 110 insufficient efficacy • 38 side effects • 58 non-compliance • 1 other reason
Fig. 1.Simplified flow chart to illustrate the sample used here. Shaded boxes indicate 342 patients who completed the study according to our protocol (but independently of the trial randomization) and thus were included in the present analyses.
The 14 participating countries were clustered into two regions : West European (The Netherlands, Belgium, France, Switzerland, Austria, Germany, Sweden, Spain and Italy) and East and Central European (Bulgaria, Poland, Romania and Czech Republic). Because only a few patients were from Israel, that country was added to the West European category to control for cell sizes and confidence inter-vals in the analyses.
Sociodemographic variables were assessed at the beginning of the study (baseline, 0 months). At each assessment, relapse and psychosocial interventions were described. Episodes of psychosocial treatment were recorded with beginning and ending dates. Compliance with medication was measured at 1, 6 and 12 months. All other measures were assessed at least at baseline, 6 and 12 months1#
. Observer-rated measures were assessed by site coordinators or co-investigators, for example psychiatrists (including trainees), research nurses or psychologists.
Statistical analyses
The analyses were preceded by a comparison between the baseline sample characteristics of completers and the baseline characteristics of the complete sam-ple. We used SPSS (PASW Statistics 18.0 for Windows) to calculate t tests for continuous variables (or the non-parametric equivalent Mann–Whitney test for vari-ables with non-normal distributions) and x2
statistics for categorical variables.
Because we were interested in individual trajec-tories of unmet needs over three time points, we de-veloped a latent class growth model using Latent Gold 4.5. This modelling technique identifies different types of patients by estimating continuous latent variables for individual intercepts and slopes, in addition to a categorical latent variable that represents groups with similar trajectories (Nagin, 1999). The analysis was based on the sum score of unmet needs. Our aim was to identify groups of patients as determined by maxi-mally distinct trajectories of needs between groups and minimally distinct individual trajectories within groups. The number of groups was obtained statisti-cally by comparing the model-fit indices of models with successive numbers of clusters. Because data were sparse, model significance (p value associated) with the L2
fit statistic was assessed using the boot-strap option within Latent Gold 4.5 rather than with standard x2
values. Model fit was based upon the Bayesian Information Criterion (BIC). To decide on the final model, statistical fit indices were supplemented by the criteria of suitability for answering the research
question, parsimony, theoretical justification, and in-terpretability (Muthe´n & Muthe´n, 2000). The sum of unmet needs was defined as a count variable.
Finally, we determined the predictors of member-ship for latent clusters of unmet-needs trajectories and the outcomes of clusters. Although Latent Gold 4.5 allows predictors to be included directly, that op-tion is restricted to categorical variables. Because the measures used in this EUFEST study were count, ordered-categorical or continuous, we preferred a multinomial logistic regression with cluster member-ship as the dependent variable. In the bivariate multi-nomial regressions, associated variables were selected on the basis of their significance (p<0.1 to consider weak effects also). Positive and negative symptoms, insight (one item from the PANSS), gender, region, and age were included by default. In the outcome model, follow-up values for the same longitudinal variables were used, and information was added for the number of relapses and psychosocial intervention (duration ofo1 month). In the combined multinomial regression model, variables with a significant Likeli-hood Quotient Test (LQT ; p<0.05) were considered main influences. Those that discerned only one group from another due to a significant odds ratio, but without any significant LQT, are also discussed. Multinomial regression was calculated with SPSS.
Differences in single needs that arose between as-sessment periods were not subjected to statistical testing because of limited cell sizes.
Results
Sample characteristics
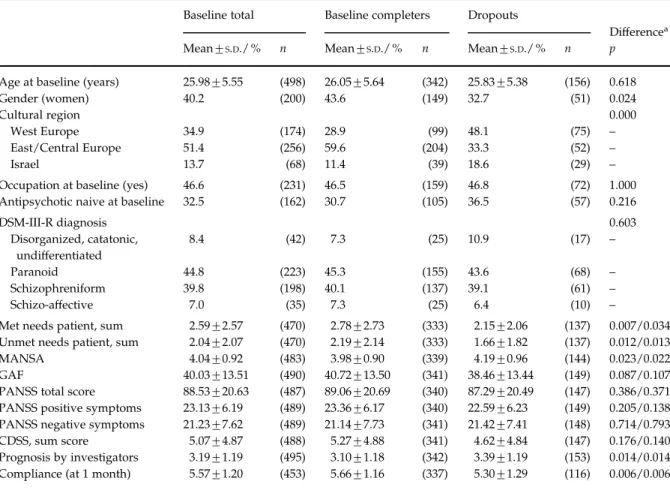
The sample of study completers was used in our analyses. The mean age was 26.1 years at baseline, and more men (56.4 %) participated than women (Table 1). More than half of the sample (59.6 %) was from Central and East European countries. Paranoid schizophrenia (45.3 %) and schizophreniform disorder (40.1 %) were the most prevalent diagnostic categories.
Significant, but not large, dropout effects (dif-ferences in baseline scores between completers and dropouts) were found for the following variables : gender (more male dropouts), region (fewer dropouts in East and Central European countries), treatment compliance (more adherent patients completed the study), and prognosis (completers had a better prog-nosis). Finally, completers had more met and unmet needs at baseline than did dropouts.
From baseline to 12 months of follow-up, 78.7 % (263 of 334 completers) reached a 50 % reduction in their PANSS total scores. At baseline, 36.1 % (123/341) had a diagnosis of major depression according to the CDSS score ; at 12 months, this was only 3.5 % #The notes appear after the main text.
(12/340). Most subjects were part of in-patient treat-ment settings at the beginning of the study (89.8 % ; 307/342) versus only 4.7 % (16/340) at the 12-month follow-up. About 32.5 % of the patients (111/342) had received some psychosocial treatment for at least 1 month.
Figure 2 depicts the course of patient-rated met and unmet needs, measured by the CAN. Both clearly decreased from baseline to 6 months. Whereas the number of met needs continued to decline in the sec-ond half of the study, the amount of unmet needs tended to remain stable over that period. Compared with baseline findings, at 12 months 65.0 % (n=208) patients had fewer unmet needs, 27.5 % had an equal number, and 7.5 % (24) had more. At baseline, met needs were slightly more frequent than unmet needs (ratio met/unmet=1.41), but after 6 and 12 months, at least two out of three needs were met (ratio met/ unmet=2.41 and 1.96 respectively) (Fig. 2).
Differences in the course of unmet needs between patient classes
A four-class model describing the course of unmet needs best fitted the data (Fig. 3). This solution ful-filled other criteria of model usability, being practical and easy to explain (Muthe´n & Muthe´n, 2000). Class 1 (autonomous group) had few unmet needs and a dim-inishing trend between baseline and 6 months. A sec-ond started with a mean of 2.5 unmet needs, then declined sharply to 1.25 from baseline to 6 months and slowly to 1.15 afterwards (ordinary group, class 2). Our uncomplicated group (class 3) started with 4.5 unmet needs, then markedly decreased to nearly zero unmet needs in the first 6 months before showing no other change. Finally, class 4 (complicated group) be-gan with nearly 5.0 unmet needs at baseline, which distinctly dropped to 3.75 at 6 months before increas-ing to 4.0 unmet needs by month 12.
Table 1.Descriptive statistics of selected variables at baseline (total sample, n=498) and sample of completers (n=342)
Baseline total Baseline completers Dropouts
Differencea
Mean¡S.D./ % n Mean¡S.D./ % n Mean¡S.D./ % n p
Age at baseline (years) 25.98¡5.55 (498) 26.05¡5.64 (342) 25.83¡5.38 (156) 0.618
Gender (women) 40.2 (200) 43.6 (149) 32.7 (51) 0.024
Cultural region 0.000
West Europe 34.9 (174) 28.9 (99) 48.1 (75) –
East/Central Europe 51.4 (256) 59.6 (204) 33.3 (52) –
Israel 13.7 (68) 11.4 (39) 18.6 (29) –
Occupation at baseline (yes) 46.6 (231) 46.5 (159) 46.8 (72) 1.000
Antipsychotic naive at baseline 32.5 (162) 30.7 (105) 36.5 (57) 0.216
DSM-III-R diagnosis 0.603 Disorganized, catatonic, undifferentiated 8.4 (42) 7.3 (25) 10.9 (17) – Paranoid 44.8 (223) 45.3 (155) 43.6 (68) – Schizophreniform 39.8 (198) 40.1 (137) 39.1 (61) – Schizo-affective 7.0 (35) 7.3 (25) 6.4 (10) –
Met needs patient, sum 2.59¡2.57 (470) 2.78¡2.73 (333) 2.15¡2.06 (137) 0.007/0.034
Unmet needs patient, sum 2.04¡2.07 (470) 2.19¡2.14 (333) 1.66¡1.82 (137) 0.012/0.013
MANSA 4.04¡0.92 (483) 3.98¡0.90 (339) 4.19¡0.96 (144) 0.023/0.022
GAF 40.03¡13.51 (490) 40.72¡13.50 (341) 38.46¡13.44 (149) 0.087/0.107
PANSS total score 88.53¡20.63 (487) 89.06¡20.69 (340) 87.29¡20.49 (147) 0.386/0.371
PANSS positive symptoms 23.13¡6.19 (489) 23.36¡6.17 (340) 22.59¡6.23 (149) 0.205/0.138
PANSS negative symptoms 21.23¡7.62 (489) 21.14¡7.73 (341) 21.42¡7.41 (148) 0.714/0.793
CDSS, sum score 5.07¡4.87 (488) 5.27¡4.88 (341) 4.62¡4.84 (147) 0.176/0.140
Prognosis by investigators 3.19¡1.19 (495) 3.10¡1.18 (342) 3.39¡1.19 (153) 0.014/0.014
Compliance (at 1 month) 5.57¡1.20 (453) 5.66¡1.16 (337) 5.30¡1.29 (116) 0.006/0.006
MANSA, Manchester Short Assessment of Quality of Life ; GAF, Global Assessment of Functioning ; PANSS, Positive and Negative Syndrome Scale ; CDSS, Calgary Depression Scale for Schizophrenia ;S.D., standard deviation.
aDropouts – completers : significance of differences between baseline completers and dropouts was calculated for each
continuous/count/ordinal variable with t tests (first p value), to control for non-normal distributions with the Mann–Whitney test (second p value), and with x2tests for nominal variables.
When the ratio of met to unmet needs was con-sidered, change in the first 6 months was greatest in the uncomplicated group, that is from a ratio of 0.74 at baseline, the ratio increased to 4 met needs for every 1 unmet need (n=2). By contrast, ratios for the compli-cated class remained relatively stable over the three time points (0.80, 1.51, 1.37).
Predictors and outcomes of needs course
Covariates of the course of unmet needs that were significant at p<0.1 in bivariate analysis were com-bined in one multinomial regression model. Positive and negative symptoms in addition to the item ‘ in-sight ’ from the PANSS were included by default. Table 2 shows our results from the multinomial re-gression analysis of baseline variables. The auton-omous group was chosen as the reference class. From our model, the significant predictors at baseline were depression (means : class 1=4.17, class 2=5.25, class 3=8.00, class 4=6.51), prognosis (class 1=2.92, class 2=3.43, class 3=2.93, class 4=3.60), age (class 1=25.78, class 2=27.26, class 3=25.06, class 4=26.16), region (West Europe and Israel, class 1=33.5%, class 2=53.2%, class 3=41.1%, class 4=37.1%) and being antipsychotic naive (class 1=32.9%, class 2=26.0%,
class 3=39.3%, class 4=14.3%) according to the LQT (p<0.05). Patients in the ordinary group had less favourable prognoses than those in the reference group. Persons with an uncomplicated course were distinguished from the autonomous group only by higher depression scores and lower quality of life at baseline. Patients with a complicated-needs course were more often male, had higher baseline depression scores, a less favourable prognosis, and lower com-pliance. Moreover, they included more patients who had already used antipsychotic medication before the study began. Prognosis at baseline indirectly sep-arated the complicated from the uncomplicated group. Values for variables used in the baseline model (age, region and gender) were included in the follow-up model (Table 2), as were the number of relapses and psychosocial intervention (duration of o1 month). Psychosocial interventions (class 1=35.3%, class 2=42.9%, class 3=25.0%, class 4=11.4%) and quality of life (class 1=5.06, class 2=4.66, class 3=4.82, class 4=4.16) were significant covariates in the model (LQT p<0.05). None of the follow-up variables differ-entiated between the autonomous (reference) and the ordinary group. The uncomplicated group had lower functioning scores at follow-up compared with the reference group. The complicated group had fewer psychosocial interventions, lower quality of life, more positive symptoms, fewer negative symptoms, and better compliance than did the autonomous group (Table 2). 3.0 2.5 2.0 1.5 1.0 0.5 0 T1 T7 T9
Mean number of met needs Mean number of unmet needs Mean ratio met needs/unmet needs
Fig. 2.Means for number of met needs, unmet needs, and ratios for met needs/unmet needs according to patient ratings from baseline (T1) to 6 months (T7) and 12 months (T9) in the European First Episode Schizophrenia Trial (EUFEST). All patients providing Camberwell Assessment of Need (CAN) ratings at the respective assessments were included. If a person indicated no unmet needs, the respective case was set to the ‘ system missing ’ value. Therefore, the sample from ratios is much smaller than the sample used for sum scores.
5.0 4.5 4.0 3.5 3.0 2.5 2.0 1.5 1.0 0.5 0 T1 T7 T9 Class 1 “autonomous” (50.3%) Class 2 “ordinary” (22.8%) Class 3 “uncomplicated” (16.6%) Class 4 “complicated” (10.4%)
Fig. 3.Four-class model of sum of unmet-need patient ratings (total n=338). The lines represent the mean number of unmet needs in each class. The four-class model was selected according to the Bayesian Information Criterion (BIC). Class sizes were n (class 1)=170, n (class 2)=77, n (class 3)=56, n (class 4)=35. T1, baseline ; T7, 6 months ; T9, 12 months.
Specific unmet needs
In all four classes, daytime activities, psychotic symp-toms, psychological distress and social integration
were most often rated as unmet needs (Fig. 4a). In areas of life where unmet needs were prevalent at baseline, some still remained unmet after 12 months. Met needs (Fig. 4a) were more persistent, being Table 2.Baseline and follow-up covariates of unmet needs by different trajectory classes (total n=331 at baseline and n=327 at follow-up). Reference class : Class 1 ‘ autonomous ’ (n=167)a,b
Class 2 ‘ ordinary ’ Class 3 ‘ uncomplicated ’ Class 4 ‘ complicated ’
OR (95 % CI) OR (95 % CI) OR (95 % CI)
Baseline
GAF functioning 0.99 (0.97–1.01) 0.98 (0.95–1.00) 0.97 (0.93–1.01)
CDSS depression score 1.04 (0.97–1.11) 1.14 (1.06–1.23) 1.13 (1.02–1.25)
MANSA quality of life 0.70 (0.49–1.01) 0.63 (0.41–0.97) 0.60 (0.36–1.02)
PANSS positive symptoms 1.00 (0.94–1.06) 1.04 (0.97–1.11) 0.95 (0.86–1.04)
PANSS negative symptoms 0.99 (0.95–1.03) 0.96 (0.92–1.01) 0.95 (0.89–1.01)
PANSS insight 1.02 (0.80–1.31) 0.86 (0.64–1.15) 0.81 (0.55–1.18) Prognosisc 1.33 (1.03–1.73) 1.07 (0.78–1.47) 1.74 (1.16–2.60) Compliance 1 month 0.92 (0.69–1.22) 0.99 (0.70–1.39) 0.62 (0.42–0.92) Age 1.05 (1.00–1.10) 0.96 (0.90–1.03) 0.99 (0.91–1.07) Men (ref.)d Women 0.55 (0.30–0.95) 0.69 (0.35–1.38) 0.35 (0.14–0.89)
East/Central Europe (ref.)
West Europe 1.85 (0.98–3.48) 1.12 (0.54–2.33) 0.37 (0.13–1.09)
Occupation yes (ref.)
Occupation no 1.41 (0.76–2.63) 1.07 (0.53–2.16) 2.37 (0.86–6.55)
Not naive (ref.)
Naive 0.60 (0.31–1.16) 1.09 (0.54–2.21) 0.20 (0.06–0.68)
Follow-up
GAF functioning 0.98 (0.95–1.01) 0.97 (0.93–1.00) 0.96 (0.92–1.00)
CDSS depression score 1.03 (0.88–1.20) 0.97 (0.80–1.17) 1.15 (0.94–1.41)
MANSA quality of life 0.67 (0.42–1.07) 0.68 (0.40–1.13) 0.30 (0.15–0.60)
PANSS positive symptoms 1.10 (0.99–1.22) 1.09 (0.97–1.23) 1.15 (1.01–1.31)
PANSS negative symptoms 0.95 (0.89–1.02) 0.93 (0.87–1.01) 0.89 (0.80–0.98)
PANSS insight 1.02 (0.73–1.41) 0.76 (0.51–1.13) 0.91 (0.56–1.49)
Compliance 1.22 (0.97–1.53) 1.11 (0.86–1.42) 1.49 (1.05–2.13)
Psychosocial intervention, yes (ref.)
No 1.05 (0.53–2.31) 1.98 (0.89–4.42) 5.82 (1.51–22.50)
Number of relapses 1.34 (0.72–2.49) 0.98 (0.46–2.09) 1.31 (0.58–2.98)
Age 1.04 (0.99–1.10) 0.97 (0.91–1.04) 0.98 (0.90–1.06)
Men (ref.)
Women 0.60 (0.32–1.12) 0.84 (0.43–1.65) 0.38 (0.14–1.00)
East/Central Europe (ref.)
West Europe 1.84 (0.53–2.06) 1.39 (0.62–3.07) 1.02 (0.33–3.09)
GAF, Global Assessment of Functioning ; CDSS, Calgary Depression Scale for Schizophrenia ; MANSA, Manchester Short Assessment of Quality of Life ; PANSS, Positive and Negative Syndrome Scale ; OR, odds ratio ; CI, confidence interval.
Bold figures indicate significance at p<0.05.
aAccording to the Likelihood Quotient Test (LQT), the omitting of region, CDSS, being antipsychotic naive at baseline, and
prognosis led to significantly different models (p<0.05). Overall model fit : x2118.066, degrees of freedom (df) 39, p<0.000.
Pseudo R2: Cox & Snell 0.300, Nagelkerke 0.329, McFaden 0.148.
bAccording to the LQT, only the omissions of MANSA and psychosocial intervention led to significantly different models.
Overall model fit : x2104.402, df 36, p<0.000. Pseudo R2: Cox & Snell 0.273, Nagelkerke 0.300, McFaden 0.131. cPrognosis is inversely scored : higher scores mean a more unfavourable prognosis.
associated with hardly any reduction in psychotic symptoms and social integration. Figure 4b depicts the change in specific unmet needs for each class. A bar corresponds to the total change in a particular item in the total sample (=100%). Each bar contains infor-mation on change in the four classes. The negative section of the bars represents fewer unmet needs at 12 months than at baseline whereas the positive portion corresponds to an augmentation in unmet needs. For example, ‘ intimate relationship ’ : change in class 1=x6, change in class 2=x1, change in class 3=x18, change in class 4=+7; total change in unmet needs=28 (100%).
Those needs concerning self-care, sexual ex-pression, education and transport became more fre-quent in the ordinary group whereas those related to sexual expression, intimate relationship, company, education, looking after home, and money became more frequent in the complicated group.
Discussion
Information is scarce about the course of treatment needs for persons in the early stages of schizophrenia. We analysed patient ratings of needs over a 12-month span in a homogeneous sample of participants suffer-ing from first-episode schizophrenia. It became clear that the first 6 months were of outmost importance to treatment because the largest proportion of change in needs occurred during that period.
The EUFEST sample contains many relatively well-integrated patients who possibly will never become chronically ill. Accordingly, the degree of reduction in unmet needs over time has proven more pronounced in that study than in other research encompassing the same time-span in longer established illness (Priebe et al. 2002). Because the EUFEST sample was homo-geneous for the phase of illness at baseline, the ma-jority of patients made a transition from the acute
160 140 120 100 80 60 40 20 0 Accommodation Food
Looking after home Self care Day time activities
Physical health Psychotic symptoms Information Psychological distress Safety to self Safety to others
AlcoholDrugsCompany
Intimate relationshipSexual expression
Child careEducationTelephoneTransport MoneyBenefits Total unmet needs T1
Total met needs T1
Total unmet needs T9 Total met needs T9
60% 40% 20% 0% –20% –40% –60% –80% –100% Accommodation Food
Looking after home Self care Day time activities
Physical health Psychotic symptoms Information Psychological distress Safety to self Safety to others AlcoholDrugs Company
Intimate relationshipSexual expression
Child careEducationTelephoneTransport MoneyBenefits Class 1 “autonomous” Class 3 ”uncomplicated” Class 2 “ordinary” Class 4 “complicate” (a) (b)
Fig. 4.(a) Distribution of needs in detail. Bars represent numbers of met (triangles) and unmet (darker bars) needs at baseline (T1) ; crosses (met needs) and lighter bars (unmet needs) represent numbers of needs at the 12-month follow-up (T9). (b) Percentage change between baseline (T1) and 12-month follow-up (T9) in single unmet needs in the four classes. 100 % represents the total change in a particular item in the total sample. The coloured bars represent how much of this change was present in each of the latent classes. Positive values mean more unmet needs, negative values indicate a reduction in unmet needs.
phase of illness to remission after about 6 months. They then reached the stabilization phase during the second half of the study. At least at baseline, all were under neuroleptic medication, which helped to reduce symptoms and contributed to an initial decline in unmet treatment needs in the majority of patients. Neither the duration of medication nor first- versus second-generation neuroleptic medication had a sig-nificant impact on the course of unmet needs. How-ever, a floor effect may have been responsible for the relatively stable course of unmet needs between 6 and 12 months.
The overall curve of unmet needs was composed of three groups that differed mainly in their baseline numbers of unmet needs, plus one relatively small group that showed a marked decline in those needs. The largest group had few unmet needs throughout the study. From the beginning, patients from this group had better prognoses than those who remained higher in unmet needs. They also experienced less depression and a better quality of life than did patient groups with more initial unmet needs. This group was called the ‘ autonomous ’ group because they had fewer unmet needs, even if they did not have more psychosocial interventions. The ‘ ordinary ’ group had slightly more unmet needs throughout the study compared with the autonomous group, in addition to a less favourable initial prognosis. Accordingly, more patients in this group underwent some type of psychosocial treatment. Although many of their un-met needs had disappeared by month 6, those that concerned education and transport, which might be-come more important in more stable phases of illness, had increased. Patients in the ‘ uncomplicated group ’ had relatively numerous unmet needs at the beginning but then showed a very steep decline from baseline until the 6-month assessment, even if they did not have more frequent psychosocial treatment than the other two groups. Strong initial depression and low quality of life might have been reasons for the elevated number of unmet needs at baseline. Patients in the ‘ complicated group ’, who had fairly elevated levels of unmet needs over the entire time-span, had more initial depression, as was also found with the un-complicated group. However, they seemed to miss the opportunity for recovery, as evidenced by their greater number of positive symptoms at follow-up compared with other groups. The lack of psychosocial inter-ventions might have been a reason for this because patients’ psychosocial needs had increased at the time of follow-up.
Some processes that influence the course of unmet needs merit a closer look. For example, high de-pression scores at the beginning of our study co-incided with a high degree of unmet needs. However,
depression did not differ between the uncomplicated group with declining unmet needs and the compli-cated group that sustained a high level of such unmet needs. Because depression during the follow-up period was no longer associated with various courses of needs, this finding cannot be explained by a self-rating bias of both instruments (Hansson et al. 2007). Findings that concern predictions of later depressive episodes based upon depression in the prodromal or acute states are unequivocal (an der Heiden & Ha¨fner, 2000 ; Birchwood et al. 2000 ; Upthegrove et al. 2010). Our results might also be interpreted as evidence that depression in the acute phases does not have to be exactly the same as depression in later phases of schizophrenia. Patients in acute phases of schizo-phrenia probably do not entirely realize that they need help because of their contemporaneous delusions and grandiosity. By contrast, depression implicates a stronger urge to seek assistance and greater insight into their illness, thereby leading them to a greater recognition of those needs (Mintz et al. 2003 ; Schennach-Wolff et al. 2011). By the later phases, working alliances might develop and patients may learn to rate their need for treatment independently of depressive symptoms. However, the missing impact of insight revealed in our study discounts this hy-pothesis.
Surprisingly, neither baseline positive nor negative symptoms were relevant. However, at follow-up, positive and negative symptoms and also functioning differed among the groups. One possible conclusion is that neither psychotic symptoms nor depression and functioning in acute phases could predict whether patients would require more intensive help, especially with social needs. Nevertheless, at follow-up there may have been larger differences among patients (i.e. whether they are in acute or stabilization phase of illness), and therefore stronger effects of psychopath-ology. A more profound examination of the topic would be interesting. For now, this lies beyond the scope of our paper.
The prognosis of clinical improvement seemed to discern the uncomplicated and complicated needs course in patients with initially high numbers of un-met needs. Thus, the prognosis was fairly exact be-cause patients remaining high in unmet needs also had more positive symptoms or lower functioning scores at follow-up. However, our data did not clearly indicate the basis upon which investigators drew their conclusions concerning prognosis. There, an ad-hoc scale was applied, for which psychometric properties have not been ascertained. Despite the correct prog-nosis at baseline, patients with a complicated needs course had less frequent psychosocial interventions. This could not have been explained as a failure to
recognize their own needs because, at both baseline and follow-up, those patients had indeed expressed psychosocial needs. In general, the persistently high occurrence of unmet social needs in patients with a complicated course demonstrates the necessity to ad-dress social and relationship needs during both acute and post-acute phases of illness. Impairments in (social) functioning can also be very stable in the middle and late courses of schizophrenia (Ha¨fner et al. 1999). Antipsychotic treatment alone is not sufficient to improve such functioning (Swartz et al. 2007). By attending to unmet social needs at the early stages, the progressive loss of meaningful relationships can be prevented. Although we could not obtain information about why those patients with many needs did not receive help, these results indicate the importance of studying the processes that lead to a clinical prognosis and also the relationship between that prognosis and treatment planning in first-episode patients.
Whereas revealing more unmet needs at follow-up coincided with better compliance, the opposite was true at baseline. Using univariate analysis, we found similar effects of compliance at baseline and follow-up. Therefore, compliance was better in patients with more unmet needs later on, but only with regard to other variables that were included in the follow-up model.
Summary
The results from this study have demonstrated that, in a sample of first-episode patients, strong differences were found among their 1-year courses of treatment needs. An unfavourable course of unmet needs co-incided with more positive symptoms. Psychosocial treatment seemed to play a crucial role in influencing the development of unmet needs. Whether in-vestigators are able to predict those courses and whether psychosocial treatment is responsible for an improved needs course should be confirmed by studies that use more elaborate assessments. This may identify those patients at risk for more unfavourable courses, thereby prompting attention to reduce their unmet needs.
Limitations
One limitation to the generalization of these results was participants’ attrition. Our results are valid only for patients who completed the study ; it is unclear whether the data would have been the same if all patients had been included. We did not use impu-tation of missing values because they were not ran-domly distributed. Because unmet needs and several other variables were predictors of missingness, such
imputation would have borne a high risk of biasing the results.
A second limitation lay within the analytic strategy. Low levels of unmet needs can be due to generally few needs, but may also be a consequence of many needs being met. The approach we used did not differentiate between those conditions.
Other limitations were due to instruments and study design. For example, the CAN is not devised especially for first-episode schizophrenia. If needs ex-ist that are exclusively relevant in this phase of illness, they may be missed by the CAN. Needs were assessed during a controlled randomized trial that was aimed, instead, at testing different neuroleptic medications. Other factors may have influenced the course of unmet needs that were not addressed in this study.
Appendix
EUFEST Study Group
Steering Committee : R. S. Kahn, Utrecht, The Netherlands ; W. W. Fleischhacker, Innsbruck, Austria ; H. Boter, Utrecht, The Netherlands ; I. P. M. Keet, Amsterdam, The Netherlands ; C. Brugman, Utrecht, The Netherlands ; M. Davidson, Tel Hashomer, Israel ; S. Dollfus, Caen, France ; W. Gaebel, Du¨sseldorf, Germany ; S. Galderisi, Naples, Italy ; M. Gheorghe, Bucharest, Romania ; I. Gonen, Bucharest, Romania ; D. E. Grobbee, Utrecht, The Netherlands ; L. G. Hranov, Sofia, Bulgaria ; M. Hummer, Innsbruck, Austria ; J. Libiger, Hradec Kra´love´, Czech Republic ; N. Lindefors, Stockholm, Sweden ; J. J. Lo´pez-Ibor, Madrid, Spain ; K. Nijssen, Utrecht, The Netherlands ; J. Peuskens, Leuven, Belgium ; A. Riecher-Ro¨ssler, Basel, Switzerland ; J. K. Rybakowski, Poznan, Poland ; G. Sedvall, Stockholm, Sweden ; M. V. Wilmsdorff, Du¨sseldorf, Germany.
Acknowledgements
The EUFEST trial was supported by the European Group for Research in Schizophrenia (EGRIS) with grants from AstraZeneca, Pfizer and Sanofi-Aventis. We thank all patients who participated in the study.
Declaration of Interest
W.R. has received speaker’s honoraria and served as a consultant for Elli Lilly, Janssen-Cilag, AstraZeneca and BMS. R.S.K. has received honoraria for edu-cational programmes and grants, or has served as consultant for Astellas, AstraZeneca, BMS, Eli Lilly, Janssen-Cilag, Pfizer, Roche and Sanofi-Aventis. W.W.F. has received research grants from BMS/ Otsuka, Eli Lilly, Janssen-Cilag and Servier ; honoraria
for educational programmes from AstraZeneca and Pfizer ; speaking fees from AstraZeneca, BMS/Otsuka, Janssen-Cilag and Pfizer ; and advisory board honor-aria from AstraZeneca, BMS/Otsuka, Janssen-Cilag, Servier and Wyeth. S.G. has received fees for edu-cational programmes or advisory boards from Astra-Zeneca, Innova-Pharma, Bristol-Myers Squibb and Janssen-Cilag. J.L. is a faculty member at the Lund-beck Institute (LundLund-beck Neuroscience Foundation) ; and has also received speaking fees, travel grants or consultancy fees from Eli Lilly, Bristol-Myers Squibb, Lundbeck and Servier.
Note
1 CAN : 0, 6, 12 months ; PANSS : 0, 1, 3, 6, 9, 12 months ;
MANSA : 0, 3, 12 months ; CDSS : 0, 1, 3, 6, 12 months ; GAF : 0, 1, 2, 3, 6, 9, 12 months ; Hayward Scale : 1, 6, 12 months.
References
Addington D, Addington J, Maticka-Tyndale E(1993). Assessing depression in schizophrenia : the Calgary Depression Scale. British Journal of Psychiatry. Supplement 22, 39–44.
Addington D, Addington J, Maticka-Tyndale E, Joyce J (1992). Reliability and validity of a depression rating scale for schizophrenics. Schizophrenia Research 6, 201–208.
Addington D, Addington MD, Patten S(2007). Relapse rates in an early psychosis treatment service. Acta Psychiatrica Scandinavica 115, 126–131.
an der Heiden W, Ha¨fner H(2000). The epidemiology of onset and course of schizophrenia. European Archives of Psychiatry and Clinical Neuroscience 250, 292–303.
Barnes TR, Leeson VC, Mutsatsa SH, Watt HC, Hutton SB, Joyce EM(2008). Duration of untreated psychosis and social function : 1-year follow-up study of first-episode schizophrenia. British Journal of Psychiatry 193, 203–209. Birchwood M, Iqbal Z, Chadwick P, Trower P(2000).
Cognitive approach to depression and suicidal thinking in psychosis. 1. Ontogeny of post-psychotic depression. British Journal of Psychiatry 177, 516–521.
Brewin CR, Wing JK, Mangen SP, Brugha TS, MacCarthy B (1987). Principles and practice of measuring needs in the long-term mentally ill : the MRC needs for care assessment. Psychological Medicine 17, 971–981.
de Koning MB, Bloemen OJ, van Amelsvoort TA, Becker HE, Nieman DH, van der Gaag M, Linszen DH(2009). Early intervention in patients at ultra high risk of psychosis : benefits and risks. Acta Psychiatrica Scandinavica 119, 426–442.
DGPPN(2006). Treatment Guidelines for Schizophrenia. Springer, Berlin.
Farooq S, Large M, Nielssen O, Waheed W(2009). The relationship between the duration of untreated psychosis and outcome in low-and-middle income countries : a
systematic review and meta analysis. Schizophrenia Research 109, 15–23.
Fleischhacker WW, Keet IP, Kahn RS(2005). The European First Episode Schizophrenia Trial (EUFEST) : rationale and design of the trial. Schizophrenia Research 78, 147–156. Ha¨fner H, Lo¨ffler W, Maurer K, Hambrecht M, an der
Heiden W(1999). Depression, negative symptoms, social stagnation and social decline in the early course of schizophrenia. Acta Psychiatrica Scandinavica 100, 105–118. Hansson L, Bjo¨rkman T, Priebe S(2007). Are important
patient-rated outcomes in community mental health care explained by only one factor ? Acta Psychiatrica Scandinavica 116, 113–118.
Hansson L, Vinding HR, Mackeprang T, Sourander A, Werdelin G, Bengtsson-Tops A, Bjarnason O, Dybbro J, Nilsson L, Sandlund M, Sorgaard K, Middelboe T(2001). Comparison of key worker and patient assessment of needs in schizophrenic patients living in the community : a Nordic multicentre study. Acta Psychiatrica Scandinavica 103, 45–51.
Issakidis C, Teesson M(1999). Measurement of need for care : a trial of the Camberwell Assessment of Need and the Health of the Nation Outcome Scales. Australian and New Zealand Journal of Psychiatry 33, 754–759.
Jones SH, Thornicroft G, Coffey M, Dunn G(1995). A brief mental health outcome scale-reliability and validity of the Global Assessment of Functioning (GAF). British Journal of Psychiatry 166, 654–659.
Kahn RS, Fleischhacker WW, Boter H, Davidson M, Vergouwe Y, Keet IP, Gheorghe MD, Rybakowski JK, Galderisi S, Libiger J, Hummer M, Dollfus S, Lopez-Ibor JJ, Hranov LG, Gaebel W, Peuskens J, Lindefors N, Riecher-Ro¨ssler A, Grobbee DE(2008). Effectiveness of antipsychotic drugs in first-episode schizophrenia and schizophreniform disorder : an open randomised clinical trial. Lancet 371, 1085–1097. Kay SR, Fiszbein A, Opler LA(1987). The positive and
negative syndrome scale (PANSS) for schizophrenia. Schizophrenia Bulletin 13, 261–276.
Kemp R, Kirov G, Everitt B, Hayward P, David A(1998). Randomised controlled trial of compliance therapy. 18-month follow-up. British Journal of Psychiatry 172, 413–419.
Kilian R, Bernert S, Matschinger H, Mory C, Roick C, Angermeyer MC(2001). The standardized assessment of the need for treatment and support in severe mental illness : the development and testing of the German version of the Camberwell assessment of Need-EU [in German]. Psychiatrische Praxis 28 (Suppl. 2), 79–83.
Kinon BJ, Chen L, Ascher-Svanum H, Stauffer VL, Kollack-Walker S, Sniadecki JL, Kane JM(2008). Predicting response to atypical antipsychotics based on early response in the treatment of schizophrenia. Schizophrenia Research 102, 230–240.
Klosterko¨tter J, Ruhrmann S, Schultze-Lutter F, Salokangas RK, Linszen D, Birchwood M, Juckel G, Morrison A, Vazquez-Barquero JL, Hambrecht M, von Reventlow H(2005). The European Prediction of Psychosis Study (EPOS) : integrating early recognition and intervention in Europe. World Psychiatry 4, 161–167.
Korkeila J, Heikkila J, Hansson L, Sorgaard KW,
Vahlberg T, Karlsson H(2005). Structure of needs among persons with schizophrenia. Social Psychiatry and Psychiatric Epidemiology 40, 233–239.
Lasalvia A, Ruggeri M, Mazzi MA, Dall’Agnola RB(2000). The perception of needs for care in staff and patients in community-based mental health services. The South-Verona Outcome Project 3. Acta Psychiatrica Scandinavica 102, 366–375.
Lester H, Birchwood M, Freemantle N, Michail M, Tait L (2009). REDIRECT : cluster randomised controlled trial of GP training in first-episode psychosis. British Journal of General Practice 59, e183–e190.
Leucht S, Kane JM, Kissling W, Hamann J, Etschel E, Engel RR(2005). What does the PANSS mean ? Schizophrenia Research 79, 231–238.
Macpherson R, Varah M, Summerfield L, Foy C, Slade M (2003). Staff and patient assessments of need in an epidemiologically representative sample of patients with psychosis – staff and patient assessments of need. Social Psychiatry and Psychiatric Epidemiology 38, 662–667.
Marshall M, Hogg LI, Gath DH, Lockwood A(1995). The Cardinal Needs Schedule – a modified version of the MRC Needs for Care Assessment Schedule. Psychological Medicine 25, 605–617.
McCrone P, Leese M, Thornicroft G, Schene A, Knudsen HC, Vazquez-Barquero JL, Tansella M, Becker T(2001). A comparison of needs of patients with schizophrenia in five European countries : the EPSILON Study. Acta Psychiatrica Scandinavica 103, 370–379.
McGorry P, Johanessen JO, Lewis S, Birchwood M, Malla A, Nordentoft M, Addington J, Yung A(2010). Early intervention in psychosis : keeping faith with evidence-based health care. Psychological Medicine 40, 399–404.
McGorry PD, Edwards J, Mihalopoulos C, Harrigan SM, Jackson HJ(1996). EPPIC : an evolving system of early detection and optimal management. Schizophrenia Bulletin 22, 305–326.
Mintz AR, Dobson KS, Romney DM(2003). Insight in schizophrenia : a meta-analysis. Schizophrenia Research 61, 75–88.
Muthe´n B, Muthe´n LK(2000). Integrating person-centred and variable-centred analyses : growth mixture modeling with latent trajectory classes. Alcoholism : Clinical and Experimental Research 24, 882–891.
Nagin DS(1999). Analyzing developmental trajectories : a semi-parametric group-based approach. Psychological Methods 4, 139–157.
Penn DL, Waldheter EJ, Perkins DO, Mueser KT, Lieberman JA(2005). Psychosocial treatment for first-episode psychosis : a research update. American Journal of Psychiatry 162, 2220–2232.
Perkins DO, Gu H, Boteva K, Lieberman JA(2005). Relationship between duration of untreated psychosis and outcome in first-episode schizophrenia : a critical review and meta-analysis. American Journal of Psychiatry 162, 1785–1804.
Phelan M, Slade M, Thornicroft G, Dunn G, Holloway F, Wykes T, Strathdee G, Loftus L, McCrone P, Hayward P (1995). The Camberwell Assessment of Need : the validity and reliability of an instrument to assess the needs of people with severe mental illness. British Journal of Psychiatry 167, 589–595.
Priebe S, Huxley P, Burns T(1999a). Who needs needs ? European Psychiatry 14, 186–188.
Priebe S, Huxley P, Knight S, Evans S(1999b). Application and results of the Manchester Short Assessment of Quality of Life (MANSA). International Journal of Social Psychiatry 45, 7–12.
Priebe S, McCabe R, Bullenkamp J, Hansson L, Rossler W, Torres-Gonzales F, Wiersma D(2002). The impact of routine outcome measurement on treatment processes in community mental health care : approach and methods of the MECCA study. Epidemiologia e Psichiatria Sociale 11, 198–205.
Ruhrmann S, Schultze-Lutter F, Salokangas RK, Heinimaa M, Linszen D, Dingemans P, Birchwood M, Patterson P, Juckel G, Heinz A, Morrison A, Lewis S, von Reventlow HG, Klosterko¨tter J(2010). Prediction of psychosis in adolescents and young adults at high risk : results from the prospective European prediction of psychosis study. Archives of General Psychiatry 67, 241–251. Schennach-Wolff R, Obermeier M, Seemuller F, Ja¨ger M,
Messer T, Laux G, Pfeiffer H, Naber D, Schmidt LG, Gaebel W, Klosterko¨tter J, Heuser I, Maier W,
Lemke MR, Ruther E, Klingberg S, Gastpar M, Mo¨ller HJ, Riedel M(2011). Evaluating depressive symptoms and their impact on outcome in schizophrenia applying the Calgary Depression Scale. Acta Psychiatrica Scandinavica 123, 228–238.
Sheehan DV, Lecrubier Y, Sheehan KH, Amorim P, Janavs J, Weiller E, Hergueta T, Baker R, Dunbar GC (1998). The Mini-International Neuropsychiatric Interview (M.I.N.I.) : the development and validation of a structured diagnostic psychiatric interview for DSM-IV and ICD-10. Journal of Clinical Psychiatry 59 (Suppl. 20), 22–33.
Slade M, Phelan M, Thornicroft G(1998). A comparison of needs assessed by staff and by an epidemiologically representative sample of patients with psychosis. Psychological Medicine 28, 543–550.
Slade M, Phelan M, Thornicroft G, Parkman S(1996). The Camberwell Assessment of Need (CAN) : comparison of assessments by staff and patients of the needs of the severely mentally ill. Social Psychiatry and Psychiatric Epidemiology 31, 109–113.
Swartz MS, Perkins DO, Stroup TS, Davis SM, Capuano G, Rosenheck RA, Reimherr F, McGee MF, Keefe RS, McEvoy JP, Hsiao JK, Lieberman JA(2007). Effects of antipsychotic medications on psychosocial functioning in patients with chronic schizophrenia : findings from the NIMH CATIE study. American Journal of Psychiatry 164, 428–436.
Upthegrove R, Birchwood M, Ross K, Brunett K,
McCollum R, Jones L(2010). The evolution of depression and suicidality in first episode psychosis. Acta Psychiatrica Scandinavica 122, 211–218.
Wennstro¨m E, Sorbom D, Wiesel FA(2004). Factor structure in the Camberwell Assessment of Need. British Journal of Psychiatry 185, 505–510.
Wennstro¨m E, Wiesel FA(2006). The Camberwell Assessment of Need as an outcome measure in routine
mental health care. Social Psychiatry and Psychiatric Epidemiology 41, 728–733.
Wiersma D(2006). Needs of people with severe mental illness. Acta Psychiatrica Scandinavica. Supplementum 429, 115–119.