HAL Id: hal-00303287
https://hal.archives-ouvertes.fr/hal-00303287
Submitted on 6 Feb 2008HAL is a multi-disciplinary open access
archive for the deposit and dissemination of sci-entific research documents, whether they are pub-lished or not. The documents may come from teaching and research institutions in France or abroad, or from public or private research centers.
L’archive ouverte pluridisciplinaire HAL, est destinée au dépôt et à la diffusion de documents scientifiques de niveau recherche, publiés ou non, émanant des établissements d’enseignement et de recherche français ou étrangers, des laboratoires publics ou privés.
Characteristics of the NO-NO2-O3 system in different
chemical regimes during the MIRAGE-Mex field
campaign
Z.-H. Shon, S. Madronich, S.-K. Song, F. M. Flocke, D. J. Knapp, R. S.
Anderson, R. E. Shetter, C. A. Cantrell, S. R. Hall
To cite this version:
Z.-H. Shon, S. Madronich, S.-K. Song, F. M. Flocke, D. J. Knapp, et al.. Characteristics of the NO-NO2-O3 system in different chemical regimes during the MIRAGE-Mex field campaign. Atmospheric Chemistry and Physics Discussions, European Geosciences Union, 2008, 8 (1), pp.2275-2309. �hal-00303287�
ACPD
8, 2275–2309, 2008 Characteristics of the NO-NO2-O3 system during the MIRAGE-Mex Z.-H. Shon et al. Title Page Abstract Introduction Conclusions References Tables Figures ◭ ◮ ◭ ◮ Back CloseFull Screen / Esc
Printer-friendly Version Interactive Discussion
Atmos. Chem. Phys. Discuss., 8, 2275–2309, 2008 www.atmos-chem-phys-discuss.net/8/2275/2008/ © Author(s) 2008. This work is distributed under the Creative Commons Attribution 3.0 License.
Atmospheric Chemistry and Physics Discussions
Characteristics of the NO-NO
2
-O
3
system
in different chemical regimes during the
MIRAGE-Mex field campaign
Z.-H. Shon1, S. Madronich2, S.-K. Song3, F. M. Flocke2, D. J. Knapp2, R. S. Anderson2, R. E. Shetter2, C. A. Cantrell2, and S. R. Hall2
1
Department of Environmental Engineering, Dong-Eui University, 995 Eomgwangno, Busan 614-714, Republic of Korea
2
Atmospheric Chemistry Division, National Center for Atmospheric Research, P.O. Box 3000 Boulder, CO 80307, USA
3
School of Earth and Atmospheric Sciences, Georgia Institute of Technology, Atlanta, GA 30318, USA
Received: 20 December 2007 – Accepted: 3 January 2008 – Published: 6 February 2008 Correspondence to: Z.-H. Shon (zangho@deu.ac.kr)
ACPD
8, 2275–2309, 2008 Characteristics of the NO-NO2-O3 system during the MIRAGE-Mex Z.-H. Shon et al. Title Page Abstract Introduction Conclusions References Tables Figures ◭ ◮ ◭ ◮ Back CloseFull Screen / Esc
Printer-friendly Version Interactive Discussion
Abstract
The NO-NO2system was analyzed in different chemical regimes/air masses based on observations of reactive nitrogen species and peroxy radicals made during the inten-sive field campaign MIRAGE-Mex (4 to 29 March 2006). In general, NO2/NO ratios, which can be used as an indicator to test current understanding of tropospheric
chem-5
istry mechanism, are near photostationary state. The air masses were categorized into 5 groups: boundary layer (labeled as “BL”), free troposphere (continental, “FTCO” and marine, “FTMA”), biomass burning (“BB”), and Tula industrial complex (“TIC”). The time- and air mass-dependent NO2/NO ratios ranged from 2.35 (TIC) to 5.18 (BB), while the NOx/NOyratios varied from 0.17 (FTCO) to 0.54 (BL). The ozone production
10
efficiency for the 5 air mass categories ranged from 5.0 (TIC) to 10.2 (BL), indicating photochemically young and reactive air masses.
1 Introduction
During March of 2006, the Megacities Impact on Regional and Global Environment: Mexico (MIRAGE-Mex) field campaign took place in the region of the Mexico City
15
Metropolitan Area (MCMA) including the Gulf of Mexico. This field campaign was de-signed to examine the chemical and physical transformations of gases and aerosols in the polluted outflow from MCMA and to assess the current and future impacts of these exported pollutants on regional and global air quality, ecosystems, and climate. MCMA is a megacity of about 20 million people residing in an area of 1500 km2,
sur-20
rounded by mountains and at an elevation of 2.2 km above sea level (asl). The air quality in MCMA is affected by strong anthropogenic sources of NOx (NO+NO2) and volatile organic compounds (VOCs) in conjunction with high solar irradiance facilitating photochemistry (Raga et al., 2001). In the 1990’s, hourly averaged ozone concentra-tions in MCMA exceeded the Mexican national standard of 110 ppbv for much of the
25
ACPD
8, 2275–2309, 2008 Characteristics of the NO-NO2-O3 system during the MIRAGE-Mex Z.-H. Shon et al. Title Page Abstract Introduction Conclusions References Tables Figures ◭ ◮ ◭ ◮ Back CloseFull Screen / Esc
Printer-friendly Version Interactive Discussion
As essential ingredients for the formation of O3, the reactive nitrogen species (NOx) are emitted to the atmosphere mainly in the form of NO from road traffic (Soltic and Weilenmann, 2003). NO and NO2 are interconverted rapidly through following reac-tions:
NO + O3→NO2+O2 (R1)
5
NO2+hν(λ<420 nm)(+O2)→NO+O3 (R2)
NO+HO2→NO2+OH (R3)
NO+RO2→NO2+RO (R4)
where RO2is any organic peroxy radical including CH3O2, and RO is the corresponding alkoxy radical. The NO2/NO ratio can be formulated as:
10 [NO2] [NO] = (k1[O3] + k3[HO2] + k4[RO2]) J2 (1)
where k1, k3, and k4 are reaction rate constants for the reactions R1, R3, and R4, respectively and J2 photolysis frequency of NO2. Previous studies investigating the NO-NO2 cyclic system were conducted in urban and remote areas utilizing observa-tions of O3(R1) and/or peroxy radicals (R3–R4) (Cantrell et al., 1997; Crawford et al.,
15
1996 and references therein). They found that model-predicted peroxy radicals were often less than those required to explain the observed NO2/NO ratio. In addition, the model-predicted NO2 levels were reported to be somewhat lower than observations. For example, comparison between observations and predictions ([NO2]obs/[NO2]calc) in several field campaigns (CITE-3, ABLE-3B, CITE-2, and TRACE-A) typically showed
20
1.3 to 1.6 with a maximum of up to 3.4 in PEM-West A (Crawford et al., 1996). In con-trast, Ridley et al. (1992) found good agreement between model peroxy radicals and those estimated from the NO2/NO ratio. Meanwhile, the potential role of iodine chem-istry in NO2/NO ratio change as well as HO2/OH has been suggested based on field,
ACPD
8, 2275–2309, 2008 Characteristics of the NO-NO2-O3 system during the MIRAGE-Mex Z.-H. Shon et al. Title Page Abstract Introduction Conclusions References Tables Figures ◭ ◮ ◭ ◮ Back CloseFull Screen / Esc
Printer-friendly Version Interactive Discussion
model, and kinetic studies (Chameides and Davis, 1980; Davis et al., 1996; Knight and Crowley, 2001; Kanaya et al., 2002, 2007). Since both hydroperoxyl and organic per-oxy radicals were measured during the MIRAGE-Mex campaign, the photostationary state (PSS) of the NO-NO2 system can be assessed based on field observations in this study without model estimates.
5
To assess the impact of MCMA emission on O3 and its precursors on regional and hemispheric scales, it is important to evaluate the loss and transformation processes of reactive nitrogen species (NOx to NOy, which is total reactive nitrogen oxides) in the course of transport of urban or industrial plumes. The emitted NOx can be oxi-dized in the atmosphere by OH, forming HNO3 which is subject to removal from the
10
air mass through dry and wet deposition. The average lifetime of NOy in an urban, industrial (Nunnermacker et al., 2000) or continental outflow plumes (Takegawa et al., 2004) ranges from 0.25 to 2 days; whereas that of NOxin each environment is slightly shorter (less than 0.25 day in the former environment with longer lifetime in the latter environment, e.g., 1.2 days).
15
High levels of NOx in the urban plume result from enhanced local emission sources including transportation. Thus, NOxcan be a measure of anthropogenic impacts at the sampling position and the ratio of NOx to NOy can be of value in understanding the chemical evolution process as an indicator for photochemical age (Carroll et al., 1992). In this study, we analyzed the NO-NO2 cyclic system in different chemical regimes/air
20
masses based on observations of reactive nitrogen species and peroxy radicals. The analysis of PSS allows us to assess the current understanding of tropospheric NOx chemistry including the potential for yet-unidentified chemical reaction. We also ex-amined the NOx/NOy ratios and ozone production efficiencies of the polluted outflow from MCMA, providing some insight on the photochemical aging processes in various
25
ACPD
8, 2275–2309, 2008 Characteristics of the NO-NO2-O3 system during the MIRAGE-Mex Z.-H. Shon et al. Title Page Abstract Introduction Conclusions References Tables Figures ◭ ◮ ◭ ◮ Back CloseFull Screen / Esc
Printer-friendly Version Interactive Discussion
2 Observational data
The intensive field campaign of MIRAGE-Mex was carried out from 4 March to 29 March, involving the NSF/NCAR C-130 aircraft, ground-based measurements, and satellite observations. This campaign made numerous physico-chemical measure-ments such as reactive nitrogen species, oxidized sulfur species, oxygenated VOCs,
5
aerosols, peroxy radicals, and so on. It also included the measurements of actinic flux and atmospheric photolysis frequencies such asJ(O3),J(NO2),J(HNO2), etc. (Shetter et al., 2002). In this study, we focused on the data of chemical measurements of reac-tive nitrogen species (NO, NO2, HNO3, PANs, organic nitrates, particulate nitrate, NOy) and other trace gases such as O3, which were made on the C-130. Reactive nitrogen
10
species, including NO, NO2, NOy, and O3were measured at 1 Hz with a chemilumines-cence technique (Weinheimer et al., 1998). HNO3and organic nitrates were measured with a chemical ionization mass spectrometer (CIMS, Crounse et al., 2006 and refer-ences therein), while PANs were measured with a thermal dissociation CIMS (Slusher et al., 2004). As one of key measurements for the analysis of NO-NO2 PSS (Eq. 1),
15
peroxy radicals (HO2+RO2) were measured with the four-channel CIMS (Cantrell et al., 2003).
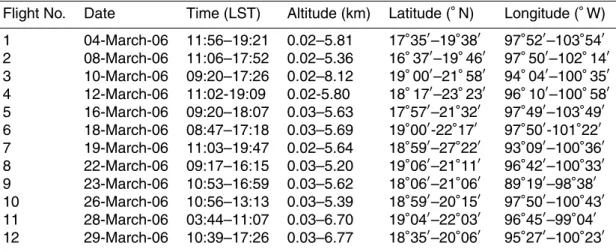
Twelve C-130 missions were flown during the campaign, covering the altitude from the surface to about 7 km. Most of the flights sampled air over the MCMA basin and central Mexico, and several of the flights extended over the Gulf of Mexico to sample
20
continental outflow from the MCMA. Table 1 shows detailed information on the 12 flights including spatial and temporal coverage. The data of flight 6 was excluded in the PSS analysis due to malfunction of the ozone instrument. More detailed flight tracks are available at the web sitehttp://www.eol.ucar.edu/flight data/mirage1/.
ACPD
8, 2275–2309, 2008 Characteristics of the NO-NO2-O3 system during the MIRAGE-Mex Z.-H. Shon et al. Title Page Abstract Introduction Conclusions References Tables Figures ◭ ◮ ◭ ◮ Back CloseFull Screen / Esc
Printer-friendly Version Interactive Discussion
3 Results and discussion
3.1 Air mass category and photostationary state analysis of NO-NO2system
In order to analyze the NO-NO2 cycling in different chemical regimes, the air masses were categorized into 5 groups: boundary layer (BL), free troposphere (continental, FTCO and marine, FTMA), biomass burning (BB), and Tula Industrial Complex (TIC).
5
The air mass characterization was determined based on geographical location, mete-orological parameters (temperature and relative humidity, etc.), model (Weather Re-search and Forecasting with Chemistry, WRF-Chem, Tie et al., 2007 and references therein), and observations of trace gases. For instance, the category for the BL air masses was determined based on meteorological parameters and WRF-Chem and
10
those for FTCO and FTMA were based on geographical locations of airborne sam-pling. In addition, that for the BB was determined based on hydrogen cyanide (HCN), perchlorethene (C2Cl4), and CO (Gregory et al., 1996; Li et al., 2000), while that for TIC was based on the concentration levels of CO, NOx, and SO2. The average con-centrations of HCN, C2Cl4, and CO in the BB air masses corresponding to the flights
15
on 4, 22, and 23 March were 965±761 pptv (median of 905), 4.2±7.5 pptv (0.92), and 278±184 ppbv (225), respectively. The median concentration of HCN for the BB is fac-tors of 1.6 (TIC), 1.9 (BL), 2.5 (FTMA), and 2.8 (FTCO) higher than those for other air mass categories. The mean concentrations of SO2, CO, and NOx for the TIC corre-sponding to the data measured on 10, 19, and 22 March were 22±40 (median of 9.4),
20
186±81 (192), and 2.6±4.4 (0.82) ppbv, respectively. The mean concentration of SO2 for TIC is higher than those for other air mass categories by factors ranging from 4.7 to 15.
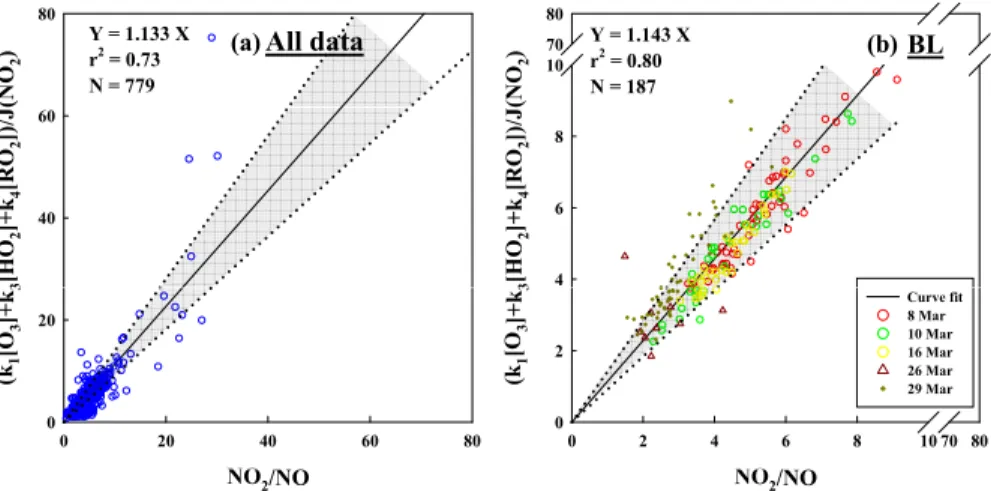
The PSS of NO-NO2 systems with different air mass categories was analyzed in Fig. 1. The PSS parameter (φ) is defined as follows:
25
φ = {k1[O3] + k3[HO2] + k4[RO2]}/J(NO2)
ACPD
8, 2275–2309, 2008 Characteristics of the NO-NO2-O3 system during the MIRAGE-Mex Z.-H. Shon et al. Title Page Abstract Introduction Conclusions References Tables Figures ◭ ◮ ◭ ◮ Back CloseFull Screen / Esc
Printer-friendly Version Interactive Discussion
In Eq. (2), the reaction rate constants (k1, k3, and k4) are taken from Sander et al. (2002) and k4 is the coefficient corresponding to the reaction between NO with CH3O2. If Reactions 1–4 represent adequately the NO-NO2 partitioning, the value
ofφ (and the slope of Fig. 1) would be expected to be near unity. The PSS
param-eter (φ) ranged from 0.89 (FTMA) to 2.60 (BB) with the slope value of 1.13 for all
5
data (Fig. 1a). The uncertainty (1σ) of the parameter is estimated to range from 23
(BL, FTCO, FTMA, and TIC) to 25% (BB) based on error propagation analysis us-ing measurement uncertainties. In general, NO2/NO ratios are near PSS, showing a strong correlation (r2=0.73) with the value of k1[O3]+k3[HO2]+k4[RO2]}/J(NO2). The discrepancy between the observed [NO2]/[NO] ratios (denominator in Eq. 2) and
cal-10
culated ratios (numerator in Eq. 2) was not always statistically significant for BL, FTMA, and FTCO. In contrast, there was slight deviation from the PSS for TIC. However, there was large deviation from the PSS for the BB air mass and the NO2/NO ratio in BB (5.18) was higher than those (2.35–4.17) in other air masses. The large deviation from the PSS for the BB might result from significantly less photochemical aging process
15
(or relatively fresh plume), supported by lower ozone production efficiency (OPE of 4.6, detailed discussion in Sect. 3.3) and higher NOx/NOy ratio (e.g., 0.3), compared to other air masses. More discussion on the ratio is given below. The discrepancy be-tween the observed and calculated ratios can suggest the possibility of lack of current understanding of the tropospheric chemistry mechanism. The potential role of iodine
20
chemistry in NO2/NO ratio change has been suggested based on field, model, and kinetic studies (Chameides and Davis, 1980; Davis et al., 1996; Knight and Crowley, 2001). Recently, significant impact of iodine chemistry (e.g., reaction of IO with NO producing NO2) on the observed NO2/NO ratio has been reported for the field study at Rishiri island, Japan (Kanaya et al., 2002, 2007). The IO mixing ratio required to
repro-25
duce the PSS of NO-NO2system were estimated to be 0.8 pptv for FTMA on average. Similar ranges of IO levels (e.g., 0.3 at Cape Grim and 0.5–7 pptv at Mace Head) have been observed in the marine atmosphere (McFiggans, et al., 2000; Allan et al., 2000; Saiz-Lopez and Plane, 2004) and this suggests the potential role of halogen chemistry
ACPD
8, 2275–2309, 2008 Characteristics of the NO-NO2-O3 system during the MIRAGE-Mex Z.-H. Shon et al. Title Page Abstract Introduction Conclusions References Tables Figures ◭ ◮ ◭ ◮ Back CloseFull Screen / Esc
Printer-friendly Version Interactive Discussion
in NO2/NO ratio shift.
For the BB, O3 and NOx concentrations were relatively higher with mean levels of 74 and 3.1 ppbv, respectively, higher than those for TIC, but less than those for the BL (79 and 3.7 ppbv, respectively) (Table 2). Mean concentrations of NO and NO2for the BB were 0.51 and 2.5 ppbv respectively. The mean NO2 level for the BB was higher
5
than those in other air mass categories by at least a factor of 1.3 and as much as a factor of 11 for the FTCO. The only exception to this was the BL. The relatively high NOxlevels for the BB are likely to be affected by outflow from MCMA. NOxenrichment was also reported in the forest fire emissions near MCMA during the MIRAGE-Mex campaign on a different airborne platform (Twin Otter), ascribed to the deposition of
10
nitrogen-containing pollutants in the outflow from the MC urban area (Yokelson et al., 2007). The concentrations of peroxy radicals, HO2 and RO2 for the BB were 58 and 159 pptv, respectively, which were factors of 1.3 to 4.7 (except for the BL) and 1.6 to 7.2 higher than those in other air mass categories, respectively.
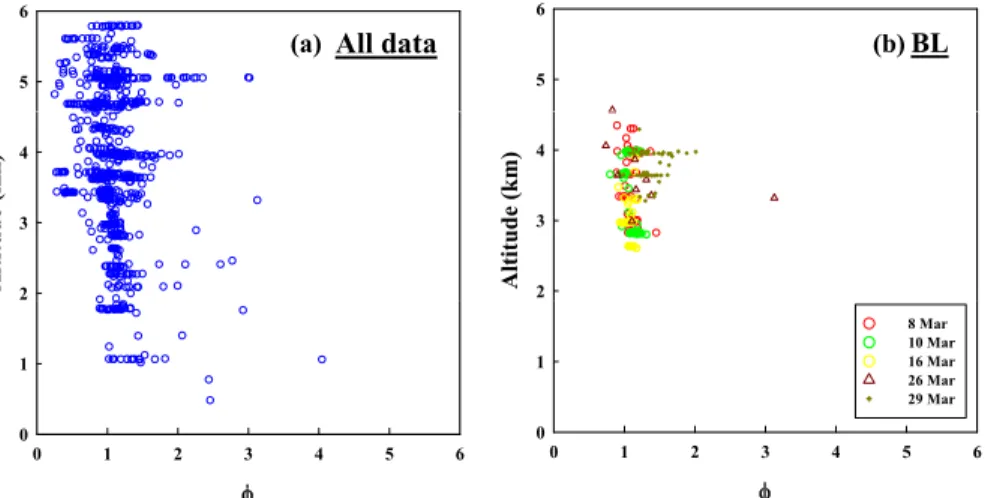
It appears that there is no distinct trend in the PSS parameterφ in terms of altitude
15
(above ground level and asl) (Fig. 2). In general, there was large variation in values of the parameter (φ) at altitude less than 3 km, as well as around 5 km for FTCO (Fig. 2d).
For FTCO, the mixing ratios of air pollutants such as O3and NOxwere low in compari-son to other air mass categories, with mean values of 51 and 0.3 ppbv. With increasing altitudes, the proportion ofφ values less than 1 increases, possibly due to the increase
20
of NO2/NO and/or the decrease of peroxy radical mixing ratios. Overall, there was no distinct PSS dependence on altitude.
According to a previous study of the PSS analysis of NO-NO2system (Crawford et al., 1996), the inverse value of the PSS parameter (φ−1) was reported to range from 1.33 to 3.36, estimated for several airborne sampling campaigns such as PEM-West
25
A, CITE-3, ABLE-3B, CITE-2, and TRACE-A. From these campaigns, mostφ−1values were close to 1.4, but that for PEM-West A (3.36) was significantly higher in compari-son. The cause for the significantly large deviation from the PSS in PEM-West A was suggested to be interference in the NO2 measurement and this possibility stimulated
ACPD
8, 2275–2309, 2008 Characteristics of the NO-NO2-O3 system during the MIRAGE-Mex Z.-H. Shon et al. Title Page Abstract Introduction Conclusions References Tables Figures ◭ ◮ ◭ ◮ Back CloseFull Screen / Esc
Printer-friendly Version Interactive Discussion
improvements to the measurement technique during PEM-Tropics A (Bradshaw et al., 1999). Note that the number of data used in our PSS analysis was somewhat reduced due to lack of peroxy radical observations during the measurement period, compared to the NO2/NO and NOx/NOydata.
3.2 NOxpartitioning for air mass category and photochemical aging
5
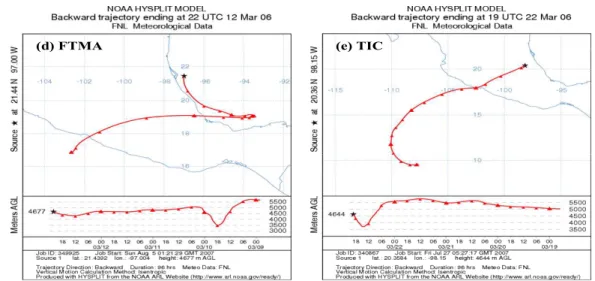
The NO2/NO ratios for each air mass ranged from 2.35 (TIC) to 5.18 (BB), as shown in Fig. 3. There is significant correlation (r2=0.55 to 0.88) between NO2and NO in each air mass, indicating the same source in each air mass, supported by air mass back trajectory analysis (NOAA HYSPLIT model) (Fig. 4). Figure 4 shows only the most frequent air mass back trajectory for each air mass category. For the BL, westerly
10
winds (W and SW) were predominant (75%) and southwesterly wind (75%) for the BB. For the FTCO, westerly wind was dominant (35%) and southwesterly (41 and 67%) for the FTMA and TIC, respectively. The strong correlation (0.76–0.88) between NO2 and NO was observed for the BL, BB, FTCO, and TIC air mass, whereas the FTMA category showed relatively weaker correlation (0.55). For the BL air mass, there was
15
slight reduction in correlation intensity due to data on 26 and 29 March (data group in right-hand side (RHS) of curve fit, as shown in Fig. 3a). The re-calculated NO2/NO ratio (4.79 andr2=0.95) for the BL air mass increased when the data on 26 and 29 March were excluded. The air mass on 26 March for BL category is likely to be affected by Tula plume, supported by the somewhat similar NO2/NO ratio (1.54 and r
2
=0.99) to
20
that (2.35 andr2=0.88) for the TIC and by air mass back trajectory analysis (downwind from TIC). In addition, the origin of the air mass on 29 March for BL seems to be changing from rural to urban. In other words, the air mass from about 12:00 to 13:00 local standard time (LST) (NO2/NO ratio of 1.81 andr
2
=0.97) originated from the rural air and from about 13:00–14:00 LST (ratio of 4.17 and r2=0.77) originated from the
25
polluted MCMA air. The concentration level of NOx(2.3±4.3 ppbv with median of 0.94) in the data group of the RHS was similar to that for TIC.
ACPD
8, 2275–2309, 2008 Characteristics of the NO-NO2-O3 system during the MIRAGE-Mex Z.-H. Shon et al. Title Page Abstract Introduction Conclusions References Tables Figures ◭ ◮ ◭ ◮ Back CloseFull Screen / Esc
Printer-friendly Version Interactive Discussion
High levels of NOxand NOywithin the megacity result from enhanced local emission sources such as combustion. Thus, NOx can be a measure of anthropogenic impact at the sampling position. In addition, the ratio of NOx to NOy can be valuable for un-derstanding the chemical process as an indicator for photochemical age (Carroll et al., 1992), in spite of several limitations including the assumptions of no physicochemical
5
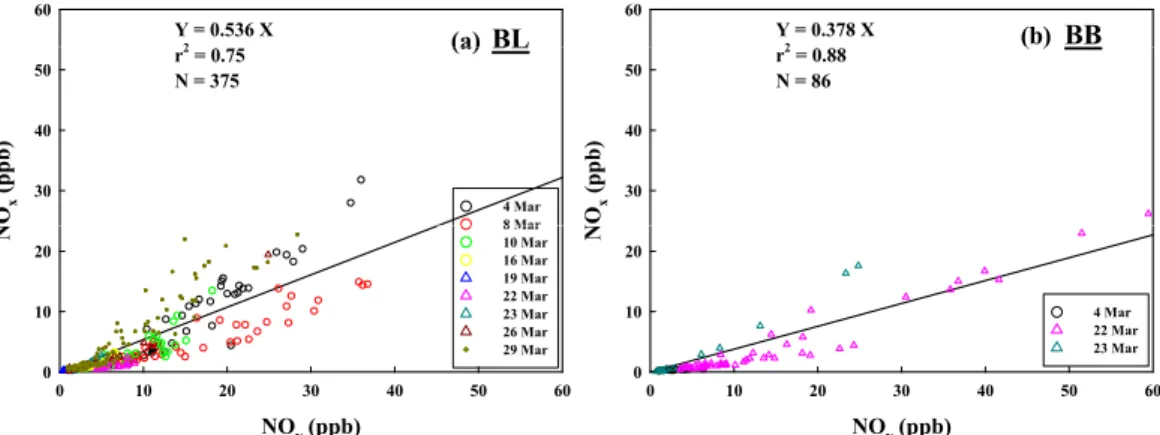
loss (only dilution of NOy), no chemical transformation from NOyto NOx (e.g., thermal decomposition of PAN), constant emission sources, and constant background concen-tration. In this field study, the NOx/NOy ratio varied from 0.17 (FTCO) to 0.54 (BL), depending on air mass category (Fig. 5). The higher ratios (0.38–0.54) for BL, BB, and TIC (Fig. 5a, b, and e, respectively) indicate less aged air than those (0.17–0.18)
10
for FTCO and FTMA (Fig. 5c and d, respectively). The lower ratios for FTCO and FTMA indicated significant photochemical aging, which is supported by higher ozone production efficiencies, as described below.
The NOx/NOyratios during MIRAGE-Mex were significantly higher than those (0.02– 0.2) in continental outflow from East Asia during TRACE-P (Koike et al., 2003).
How-15
ever, the higher ratios (0.38–0.54) for BB, TIC, and BL were comparable to those in the near 2 day aged Asian outflow plume measured during the PEACE-A campaign (Takegawa et al., 2004). Our ratios (0.17–0.18) for the FTCO and FTMA were similar to the ratios (0.13–0.15) for marine air during PEM-Tropics B (Maloney et al., 2001).
3.3 Ozone Production Efficiency (OPE)
20
Photochemical oxidation of NOx and its oxidation products were intercorrelated with O3formation during the daytime. The OPE, which is the number of O3molecules pro-duced per molecule of NOx oxidized (Kleinman et al., 2002 and references therein), was estimated using the linear regression slope between O3 and oxidized NOx prod-ucts (NOz=NOy–NOx). Figure 6 shows the correlation between odd oxygen (O3+NO2)
25
and NOz and the OPEs for the 5 air mass categories in this field campaign ranged from 4.5 (TIC) to 8.5 (FTMA), indicating both photochemically young and reactive air masses. In general, higher efficiencies (5.9–8.5) were observed in FTCO and FTMA,
ACPD
8, 2275–2309, 2008 Characteristics of the NO-NO2-O3 system during the MIRAGE-Mex Z.-H. Shon et al. Title Page Abstract Introduction Conclusions References Tables Figures ◭ ◮ ◭ ◮ Back CloseFull Screen / Esc
Printer-friendly Version Interactive Discussion
whereas lower OPEs (4.5–4.6) in TIC and BB. The OPEs in this field campaign were significantly lower than those (73–246) observed in the remote marine atmosphere such as the western North Pacific (Davis et al., 1996), but within the OPE ranges for the urban and rural atmosphere (Marion et al., 2001).
4 Summary and conclusions
5
Previous studies testing the NO-NO2 cyclic system were conducted in urban and re-mote areas using observations of O3(R1) and/or peroxy radicals (R3–R4). These ear-lier studies used the concentrations of model-predicted peroxy radicals test the PSS for NO-NO2 cyclic system and indicated that the peroxy radicals were not sufficient to explain the observed NO2/NO ratio. In addition, the model-predicted NO2 levels in
10
previous studies were reported to be somewhat lower than observations. In this study, we analyzed the NO-NO2 system in different chemical regimes/air masses based on observations of reactive nitrogen species and peroxy radicals measured during the in-tensive field campaign of MIRAGE-Mex (4 to 29 March 2006). In general, NO2/NO ratios seem to be near PSS. For this analysis, the air mass was categorized into 5
15
groups such as BL, FTCO, FTMA, BB, and TIC. The NO2/NO ratios for each air mass ranged from 2.35 (TIC) to 5.18 (BB) and NOx/NOy ratio varied from 0.17 (FTCO) to 0.54 (BL), indicating both relatively photochemically young and reactive air masses (i.e., OPE ranges from 4.5 (TIC) to 8.5 (FTMA)). The potential role of halogen chem-istry in NO2/NO ratio shift (i.e., lowering the PSS parameter,φ) can not be excluded
20
according to our simple calculation of conversion of NO to NO2 by IO in the marine atmosphere (FTMA case).
Acknowledgements. ZHS was financially supported by the Climate Environment System Re-search Center sponsored by the SRC program of Korea Science and Engineering Foundation. The National Center for Atmospheric Research is operated by the University Corporation for 25
ACPD
8, 2275–2309, 2008 Characteristics of the NO-NO2-O3 system during the MIRAGE-Mex Z.-H. Shon et al. Title Page Abstract Introduction Conclusions References Tables Figures ◭ ◮ ◭ ◮ Back CloseFull Screen / Esc
Printer-friendly Version Interactive Discussion
References
Allan, B., McFiggans, G., and Plane, J.: Observations of iodine monoxide in the remote marine boundary layer, J. Geophys. Res., 105, 14 363–14 369, 2000.
Bradshaw, J., Davis, D., Crawford, J., Chen, G., Shetter, R., M ¨uller, M., Gregory, G., Sachse, G., Blake, D., Heikes, B., Singh, H., Mastromarino, J., and Sandholm, S.: Photofragmentation 5
two-photon laser-induced fluorescence detection of NO2and NO: Comparison of
measure-ments with model results based on airborne observations during PEM-Tropics A, Geophys. Res. Lett., 26(4), 471–474, doi:10.1029/1999GL900015, 1999.
Cantrell, C. A., Edwards, G. D., Stephens, S., Mauldin, L., Kosciuch, E., Zondlo, M., and Eisele, F.: Peroxy radical observations using chemical ionization mass spectrometry during TOPSE, 10
J. Geophys. Res., 108(D6), 8371, doi:10.1029/2002JD002715, 2003.
Cantrell, C. A., Shetter, R. E., Calvert, J. G., Eisele, F. L., Williams, E., Baumann, K., Brune, W. H., Stevens, P. S., and Mather, J. H.: Peroxy radicals from photostationary state deviations and steady state calculations during the Tropospheric OH Photochemistry Experiment at Idaho Hill, Colorado, 1993, J. Geophys. Res., 102(D5), 6369–6378, doi:10.1029/96JD01703, 15
1997.
Carroll, M. A., Ridley, B. A., Montzka, D. D., H ¨ubler, G., Walega, J. G., Norton, R. B., Huebert, B. J., and Grahek, F. E.: Measurements of nitric oxide and nitrogen dioxide during the Mauna Loa Observatory Photochemistry Experiment, J. Geophys. Res., 97(D10), 10 361–10 374, 1992.
20
Chameides, W. L. and Davis, D. D.: Iodine: its possible role in tropospheric chemistry, J. Geo-phys. Res., 85, 7383–7398, 1980.
Crawford, J., Davis, D., Chen, G., Bradshaw, J., Sandholm, S., Gregory, G., Sachse, G., Anderson, B., Collins, J., Blake, D., Singh, H., Heikes, B., Talbot, R., and Rodriguez,
J.: Photostationary state analysis of the NO2-NO system based on airborne
observa-25
tions from the western and central North Pacific, J. Geophys. Res., 101(D1), 2053–2072, doi:10.1029/95JD02201, 1996.
Crounse, J. D., McKinney, K. A., Kwan, A. J., and Wennberg, P. O.: Measurement of gas-phase hydroperoxides by chemical ionization mass spectrometry (CIMS), Anal. Chem., 78, 6726–6732, 2006
30
Davis, D. D., Crawford, J., Chen, G., Chameides, W., Liu, S., Bradshaw, J., Sandholm, S., Sachse, G., Gregory, G., Anderson, B., Barrick, J., Bachmeier, A., Collins, J., Browell, E.,
ACPD
8, 2275–2309, 2008 Characteristics of the NO-NO2-O3 system during the MIRAGE-Mex Z.-H. Shon et al. Title Page Abstract Introduction Conclusions References Tables Figures ◭ ◮ ◭ ◮ Back CloseFull Screen / Esc
Printer-friendly Version Interactive Discussion
Blake, D., Rowland, S., Kondo, Y., Singh, H., Talbot, R., Heikes, B., Merrill, J., Rodriguez, J., and Newell, R. E.: Assessment of ozone photochemistry in the western North Pacific as inferred from PEM-West A observations during the fall 1991, J. Geophys. Res., 101(D1), 2111–2134, doi:10.1029/95JD02755, 1996.
Davis, D., Crawford, J., Liu, S., McKeen, S., Bandy, A., Thornton, D., Rowland, F., and Blake, 5
D.: Potential impact of iodine on tropospheric levels of ozone and other critical oxidants, J. Geophys. Res., 101(D1), 2135–2147, doi:10.1029/95JD02727, 1996.
Gregory, G. L., Fuelberg, H. E., Longmore, S. P., Anderson, B. E., Collins, J. E., and Blake, D. R.: Chemical characteristics of tropospheric air over the tropical South Atlantic Ocean: Relationship to trajectory history, J. Geophys. Res., 101(D19), 23 957–23 972, 10
doi:10.1029/96JD01160, 1996.
Kanaya, Y., Tanimoto, H., Matsumoto, J., Furutani, H., Hashimoto, S., Komazaki, Y., Tanaka, S.,
Yokouchi, Y., Kato, S., Kajii, Y., and Akimoto, H.: Diurnal variations in H2O2, O3, PAN, HNO3
and aldehyde concentrations and NO/NO2ratios at Rishiri Island, Japan: Potential influence
from iodine chemistry, Sci. Total Environ., 376, 185–197, 2007. 15
Kanaya, Y., Yokouchi, Y., Matsumoto, J., Nakamura, K., Kato, S., Tanimoto, H., Furutani, H.,
Toyota, K., and Akimoto, H.: Implications of iodine chemistry for daytime HO2levels at Rishiri
Island, Geophys. Res. Lett., 29, 1212, doi.:10.1029/2001GL014061, 2002.
Kleinman, L. I., Daum, P. H., Lee, Y. -N., Nunnermacker, L. J., Springston, S. R., Weinstein-Lloyd, J., and Rudolph, J.: Ozone production efficiency in an urban area, J. Geophys. Res., 20
107(D23), 4733, doi:http://dx.doi.org/10.1029/ 2002JD002529, 2002.
Knight, G. P. and Crowley, J. N.: The reactions of IO with HO2, NO and CH3SCH3: flow tube
studies of kinetics and product formation, Phys. Chem. Chem. Phys., 3, 393–401, 2001. Koike M., Kondo, Y., Kita, K., et al.: Export of anthropogenic reactive nitrogen and
sul-fur compounds from the East Asia region in spring, J. Geophys. Res., 108(D20), 8789, 25
doi:10.1029/2002JD003284, 2003.
Li, Q., Jacob, D. J., Bey, I., Yantosca, Y. M., Zhao, Y., Kondo, Y., and Notholt, J.: Atmospheric hydrogen cyanide (HCN): biomass burning source, ocean sink?, Geophys. Res. Lett., 27, 357–360, 2000.
Maloney, J. C., Fuelberg, H. E., Avery, M. A., Crawford, J. H., Blake, D. R., Heikes, B. G., 30
Sachse, G. W., Sandholm, S. T., Singh, H., and Talbot, R. W.: Chemical characteristics of air from different source regions during the second Pacific Exploratory Mission in the Tropics (PEM-Tropics B), J. Geophys. Res., 106(D23), 32 609–32 626, doi:10.1029/2001JD900100,
ACPD
8, 2275–2309, 2008 Characteristics of the NO-NO2-O3 system during the MIRAGE-Mex Z.-H. Shon et al. Title Page Abstract Introduction Conclusions References Tables Figures ◭ ◮ ◭ ◮ Back CloseFull Screen / Esc
Printer-friendly Version Interactive Discussion
2001.
Marion, T., Perros, P. E., Losno, R., and Stenier, E.: Ozone production efficiency in Savanna and forested areas during the EXPRESSO experiment, J. Atmos. Chem., 38, 3–30, 2001. McFiggans, G., Plane, J., Allan, B., and Carpenter, L.: A modeling study of iodine chemistry in
the marine boundary layer, J. Geophys. Res., 105(D11), 14 371–14 385, 2000. 5
Nunnermacker, L. J., Kleinman, L. I., Imre, D., Daum, P. H., Lee, Y.-N., Lee, J. H., Springston,
S. R., Newman, L., and Gillani, N.: NOy lifetimes and O3 production efficiencies in urban
and power plant plumes: Analysis of field data, J. Geophys. Res., 105(D7), 9165–9176, doi:10.1029/1999JD900753, 2000.
Raga, G. and Raga, A.: On the formation of an elevated ozone peak in Mexico City, Atmos. 10
Environ., 34, 4097–4102, 2000.
Raga, G., Baumgardner, D., Castro, T., Mart´ınez-Arroyo, A., and Navarro-Gonz ´alez, R.: Mexico City air quality: a qualitative review of gas and aerosol measurements (1960–2000), Atmos. Environ., 35, 4041–4058, 2001.
Ridley, B. A., Madronich, S., Chatfield, R. B., Walega, J. G., Shetter, R. E., Carroll, M. A., and 15
Montzka, D. D.: Measurements and model simulations of the photostationary state during MLOPEX: Implications for radical concentrations and ozone production and loss rates, J. Geophys. Res., 97, 10 375–10 388, 1992.
Saiz-Lopez, A. and Plane, J. M. C.: Novel iodine chemistry in the marine boundary layer, Geophys. Res. Lett., 31, L04112, doi:10.1029/2003GL019215, 2004.
20
Sander, S. P., Friedl, R. R., Golden, D. M., Kurylo, M. J., Moortgat, G. K., Ravishankara, A. R., Kolb, C. E., Molina, M. J., and Finlayson-Pitts, B. J.: Chemical kinetics and photochemical data for use in stratospheric modeling, Jet Propulsion Laboratory Publication 02–25, Jet Propulsion Laboratory, Pasadena, California, 2002.
Shetter, R. E., Cinquini, L., Lefer, B. L., Hall, S. R., and Madronich, S.: Comparison of airborne 25
measured and calculated spectral actinic flux and derived photolysis frequencies during the PEM Tropics B mission, J. Geophys. Res., 107, 8234, doi:10.1029/2001JD001320, 2002, (printed 108 (D2), 2003).
Slusher D. L., Huey, L. G., Tanner, D. J., Flocke, F. M., and Roberts. J. M.: A thermal dissociation–chemical ionization mass spectrometry (TD-CIMS) technique for the simulta-30
neous measurement of peroxyacyl nitrates and dinitrogen pentoxide, J. Geophys. Res., 109, D19315, doi:10.1029/2004JD004670, 2004.
ACPD
8, 2275–2309, 2008 Characteristics of the NO-NO2-O3 system during the MIRAGE-Mex Z.-H. Shon et al. Title Page Abstract Introduction Conclusions References Tables Figures ◭ ◮ ◭ ◮ Back CloseFull Screen / Esc
Printer-friendly Version Interactive Discussion
trucks with Euro-2 emission standard, Atmos. Environ., 37, 5207–5216, 2003.
Takegawa, N., Kondo, Y., Koike, M., et al.: Removal of NOx and NOyin Asian outflow plumes:
Aircraft measurements over the western Pacific in January 2002, J. Geophys. Res., 109, D23S04, doi:10.1029/2004JD004866, 2004.
Tie, X., Madronich, S., Li, G. H., Ying, Z., Zhang, R., Garcia, A. R., Lee-Taylor, J., and Liu, Y.: 5
Characterizations of chemical oxidants in Mexico City: A regional chemical dynamical model (WRF-Chem) study, Atmos. Environ., 41, 1989–2008, 2007.
Weinheimer, A. J., Montzka, D. D., Campos, T. L., et al.: Comparison between DC-8 and ER-2
species measurements in the tropical middle troposphere: NO, NOy, O3, CO2, CH4, and
N2O, J. Geophys. Res., 103(D17), 22 087–22 096, 1998.
10
Yokelson, R., Urbanski, S., Atlas, E., Toohey, D., Alvarado, E., Crounse, J., Wennberg, P., Fisher, M., Wold, C., Campos, T., Adachi, K., Buseck, P. R., and Hao, W. M.: Emissions from forest fires near Mexico City, Atmos. Chem. Phys. Discuss., 7, 6687–6718, 2007,
http://www.atmos-chem-phys-discuss.net/7/6687/2007/. 15
ACPD
8, 2275–2309, 2008 Characteristics of the NO-NO2-O3 system during the MIRAGE-Mex Z.-H. Shon et al. Title Page Abstract Introduction Conclusions References Tables Figures ◭ ◮ ◭ ◮ Back CloseFull Screen / Esc
Printer-friendly Version Interactive Discussion Table 1. Temporal and spatial information on airborne sample acquisition during the
studyper-iod.
Flight No. Date Time (LST) Altitude (km) Latitude (◦N) Longitude (◦W)
1 04-March-06 11:56–19:21 0.02–5.81 17◦35′–19◦38′ 97◦52′–103◦54′ 2 08-March-06 11:06–17:52 0.02–5.36 16◦37′–19◦46′ 97◦50′–102◦14′ 3 10-March-06 09:20–17:26 0.02–8.12 19◦00′–21◦58′ 94◦04′–100◦35′ 4 12-March-06 11:02-19:09 0.02-5.80 18◦17′–23◦23′ 96◦10′–100◦58′ 5 16-March-06 09:20–18:07 0.03–5.63 17◦57′–21◦32′ 97◦49′–103◦49′ 6 18-March-06 08:47–17:18 0.03–5.69 19◦00′-22◦17′ 97◦50′-101◦22′ 7 19-March-06 11:03–19:47 0.02–5.64 18◦59′–27◦22′ 93◦09′–100◦36′ 8 22-March-06 09:17–16:15 0.03–5.20 19◦06′–21◦11′ 96◦42′–100◦33′ 9 23-March-06 10:53–16:59 0.03–5.62 18◦06′–21◦06′ 89◦19′–98◦38′ 10 26-March-06 10:56–13:13 0.03–5.39 18◦59′–20◦15′ 97◦50′–100◦43′ 11 28-March-06 03:44–11:07 0.03–6.70 19◦04′–22◦03′ 96◦45′–99◦04′ 12 29-March-06 10:39–17:26 0.03–6.77 18◦35′–20◦06′ 95◦27′–100◦23′
ACPD
8, 2275–2309, 2008 Characteristics of the NO-NO2-O3 system during the MIRAGE-Mex Z.-H. Shon et al. Title Page Abstract Introduction Conclusions References Tables Figures ◭ ◮ ◭ ◮ Back CloseFull Screen / Esc
Printer-friendly Version Interactive Discussion Table 2. A statistical summary of reactive nitrogen compounds, major air pollutants, and peroxy
radicals with air mass categories measured during the MIRAGE fieldcampaign.
Air mass NO (ppbv) NO2(ppbv) NOx(ppbv) NOy(ppbv) CO (ppbv) O3(ppbv) SO2(ppbv) HO2(pptv) RO2(pptv) category* BL 0.7±1.1a 3.0±4.2 3.7±5.1 7.8±7.4 249±110 79±25 4.7±17.9 77±49 54±48 0.27b 1.0 1.3 4.9 223 76 1.9 55 35 0.01–7.8c 0.07–27 0.09–32 0.9–37 111–688 32–153 0.2–207 12–246 0.8–241 387d 387 387 375 170 396 278 267 255 BB 0.5±0.8 2.5±4.6 3.1±5.3 10.2±11.5 278±184 74±30 2.7±2.1 58±26 159±71 0.2 0.7 0.9 6.3 225 72 2.0 59 158 0.02–4.0 0.06–23 0.08–26 0.7–59 81–937 29–151 0.2–9.7 12–106 58–362 88 88 88 86 58 90 60 24 30 FTCO 0.05±0.09 0.2±0.4 0.3±0.5 1.7±2.6 128±41 51±14 2.0±6.8 45±33 43±38 0.03 0.1 0.2 1.3 119 50 0.68 40 29 0–1.7 0.01–5.7 0.03–7.4 0.06–25 69–424 0.4–144 0–120 0.01–353 0.02–194 1125 1185 1132 1057 636 1246 687 778 564 FTMA 0.06±0.1 0.3±0.4 0.3±0.6 2.0±2.2 123±64 57±17 1.4±1.6 30±20 22±17 0.03 0.1 0.1 1.4 112 57 0.93 29 21 0–1.9 0.02–4.2 0.03–4.9 0.1–16 60–416 29-129 0–10.0 0.1–129 0.3–190 561 563 561 519 351 595 375 237 206 TIC 0.7±1.3 2.0±3.1 2.6±4.4 8.5±7.4 186±81 72±19 22.3±40.4 12±4 101±42 0.2 0.6 0.8 6.0 192 74 9.4 13 108 0.02–7.4 0.03–19 0.05–26 0.3–40 67–418 40–120 0.15–235 8–18 10–168 69 69 69 67 59 70 43 5 30 a
Mean±1σ;bMedian;cMin.–Max.;dNumber of data.∗The category for the BL air masses was
determined based on meteorological parameters and WRF-Chem; those for FTCO and FTMA based on geographical locations of airborne sampling; that for the BB based on hydrogen
cyanide (HCN), perchlorethene (C2Cl4), and CO; and that for TIC based on the concentration
ACPD
8, 2275–2309, 2008 Characteristics of the NO-NO2-O3 system during the MIRAGE-Mex Z.-H. Shon et al. Title Page Abstract Introduction Conclusions References Tables Figures ◭ ◮ ◭ ◮ Back CloseFull Screen / Esc
Printer-friendly Version Interactive Discussion All data (N O2 ) 80 Y = 1.133 X r2 = 0.73 N = 779 BL (N O2 ) 10 70 80 Y = 1.143 X r2 = 0.80 N = 187 (a) (b) 3 [H O2 ]+ k4 [R O2 ]) /J ( 40 60 3 [H O2 ]+ k4 [R O2 ]) /J ( 4 6 8 NO / O 0 20 40 60 80 (k1 [O 3 ]+ k3 0 20 NO 0 2 4 6 8 10 70 80 (k1 [O 3 ]+ k3 0 2 Curve fit 8 Mar 10 Mar 16 Mar 26 Mar 29 Mar 2 ) 80 2 (N O ) 80 NO2/NO NO2/NO O 2 3 2 4 O 3 4 R 10 R 10
Fig. 1. Photostationary state analysis for the NO-NO2 system during the MIRAGE-Mex field
campaign (4 March to 29 March 2006) for 5 air mass categories (all (a), BL (b), BB (c), FTCO
(d), FTMA (e), and TIC (f)). The photostationary parameter φ is the slope of these plots.
The uncertainty ranges (1σ) of φ for the 5 air mass categories (23–25%) are denoted by grey shading.
ACPD
8, 2275–2309, 2008 Characteristics of the NO-NO2-O3 system during the MIRAGE-Mex Z.-H. Shon et al. Title Page Abstract Introduction Conclusions References Tables Figures ◭ ◮ ◭ ◮ Back CloseFull Screen / Esc
Printer-friendly Version Interactive Discussion Y = 1.299 X r2 = 0.81 N = 408 FTCO 2 ]) /J (N O2 ) 15 60 80 Y = 1.299 X r2 = 0.81 N = 408 BB 2 ]) /J (N O2 ) 12 14 70 80 Y = 2.602 X r2 = 0.57 N = 8 2 2 (c) (d) O3 ]+ k3 [H O2 ]+ k4 [R O2 5 10 Curve fit 12 Mar 16 Mar 3 ]+ k3 [H O2 ]+ k4 [R O2 4 6 8 10 NO2/NO 0 5 10 15 60 80 (k1 [O 0 22 Mar 23 Mar 26 Mar 28 Mar NO2/NO 0 2 4 6 8 10 12 14 70 80 (k 1 [O 3 0 2 4 Curve fit 23 Mar ) 80 R ) 10 80 1 R 10 1 Fig. 1. Continued.
ACPD
8, 2275–2309, 2008 Characteristics of the NO-NO2-O3 system during the MIRAGE-Mex Z.-H. Shon et al. Title Page Abstract Introduction Conclusions References Tables Figures ◭ ◮ ◭ ◮ Back CloseFull Screen / Esc
Printer-friendly Version Interactive Discussion TIC R O2 ]) /J (N O2 ) 8 10 70 80 Y = 1.322 X r2 = 0.99 N = 4 FTMA R O2 ]) /J(N O2 ) 10 15 60 80 Y = 0.885 X r2 = 0.81 N = 172 (e) (f) 1 [O 3 ]+ k3 [H O2 ]+ k4 [ 2 4 6 1 [O 3 ]+ k3 [H O2 ]+ k4 [R 5 10 Curve fit 8 Mar NO2/NO 0 2 4 6 8 10 70 80 (k 0 Curve fit 10 Mar NO2/NO 0 5 10 15 60 80 (k1 0 10 Mar 12 Mar Fig. 1. Continued.
ACPD
8, 2275–2309, 2008 Characteristics of the NO-NO2-O3 system during the MIRAGE-Mex Z.-H. Shon et al. Title Page Abstract Introduction Conclusions References Tables Figures ◭ ◮ ◭ ◮ Back CloseFull Screen / Esc
Printer-friendly Version Interactive Discussion BL 5 6 (b) All data 5 6 (a) A lti tu d e (k m ) 2 3 4 A lti tu d e (k m ) 2 3 4 φ 0 1 2 3 4 5 6 0 1 8 Mar 10 Mar 16 Mar 26 Mar 29 Mar φ 0 1 2 3 4 5 6 0 1 ) 6 φ φ ) 6 (d) ) ) 22 Mar φ φ 22 Mar e e e e φ φ
Fig. 2. Vertical profile of the PSS parameter (φ) for 5 air mass categories (all (a), BL (b), BB
(c), FTCO (d), FTMA (e), and TIC (f)).
ACPD
8, 2275–2309, 2008 Characteristics of the NO-NO2-O3 system during the MIRAGE-Mex Z.-H. Shon et al. Title Page Abstract Introduction Conclusions References Tables Figures ◭ ◮ ◭ ◮ Back CloseFull Screen / Esc
Printer-friendly Version Interactive Discussion φ φ BB ) 4 5 6 φ (c) φ FTCO ) 4 5 6 (d) A lti tu d e (k m ) 2 3 A lti tu d e (k m ) 2 3 12 Mar 16 Mar 22 Mar φ 0 1 2 3 4 5 6 0 1 23 Mar φ 0 1 2 3 4 5 6 0 1 22 Mar23 Mar 26 Mar 28 Mar 6 6 TIC e (f) FTMA e (e) e e φ φ Fig. 2. Continued. 2296
ACPD
8, 2275–2309, 2008 Characteristics of the NO-NO2-O3 system during the MIRAGE-Mex Z.-H. Shon et al. Title Page Abstract Introduction Conclusions References Tables Figures ◭ ◮ ◭ ◮ Back CloseFull Screen / Esc
Printer-friendly Version Interactive Discussion φ φ φ φ φ φ 6 6 TIC e (k m ) 4 5 (f) FTMA e (k m ) 4 5 (e) A lti tu d e 1 2 3 A lti tu d e 1 2 3 8 Mar 10 Mar φ 0 1 2 3 4 5 6 0 10 Mar φ 0 1 2 3 4 5 6 0 12 Mar Fig. 2. Continued.
ACPD
8, 2275–2309, 2008 Characteristics of the NO-NO2-O3 system during the MIRAGE-Mex Z.-H. Shon et al. Title Page Abstract Introduction Conclusions References Tables Figures ◭ ◮ ◭ ◮ Back CloseFull Screen / Esc
Printer-friendly Version Interactive Discussion 30 Y = 3 714 X 30 Y = 5 181 X BL O2 (p p b ) 15 20 25 4 Mar Y 3.714 X r2 = 0.76 N = 387 (a) BB O2 (p p b ) 15 20 25 Y = 5.181 X r2 = 0.82 N = 88 (b) 0 5 10 15 20 25 30 N O 0 5 10 8 Mar 10 Mar 16 Mar 19 Mar 22 Mar 23 Mar 26 Mar 29 Mar 0 5 10 15 20 25 30 N O 0 5 10 4 Mar 22 Mar 23 Mar FTMA 30 Y = 2.798 X FTCO 30 Y = 4.169 X NO (ppb) 0 5 10 15 20 25 30 NO (ppb) 0 5 10 15 20 25 30 1 1
Fig. 3. Correlation between NO and NO2for 5 air mass categories (BL (a), BB (b), FTCO (c),
FTMA (d), and TIC (e)).
ACPD
8, 2275–2309, 2008 Characteristics of the NO-NO2-O3 system during the MIRAGE-Mex Z.-H. Shon et al. Title Page Abstract Introduction Conclusions References Tables Figures ◭ ◮ ◭ ◮ Back CloseFull Screen / Esc
Printer-friendly Version Interactive Discussion FTMA 25 30 Y = 2.798 X r2 = 0.55 N = 631 FTCO 25 30 Y = 4.169 X r2 = 0.80 N = 1112 NO (ppb) NO (ppb) (c) (d) 6 5 N O2 (p p b ) 10 15 20 N O2 (p p b ) 10 15 20 1 2 3 4 5 4 Mar 12 Mar 16 Mar 22 Mar 1 2 3 4 8 Mar 30 NO (ppb) 0 5 10 15 20 25 30 0 5 NO (ppb) 0 5 10 15 20 25 30 0 5 0 1 2 3 4 5 6 0 1 23 Mar 26 Mar 28 Mar 0 1 2 3 4 5 0 10 Mar 12 Mar 19 Mar TIC (e) 0 5 10 15 20 25 30 0 5 10 15 20 25 30 Fig. 3. Continued.
ACPD
8, 2275–2309, 2008 Characteristics of the NO-NO2-O3 system during the MIRAGE-Mex Z.-H. Shon et al. Title Page Abstract Introduction Conclusions References Tables Figures ◭ ◮ ◭ ◮ Back CloseFull Screen / Esc
Printer-friendly Version Interactive Discussion 30 NO (p NO (ppb)
TIC
2 (p p b ) 15 20 25 Y = 2.345 X r2 = 0.88 N = 69(e)
0 5 10 15 20 25 30 N O 0 5 10 10 Mar 19 Mar 22 Mar NO (ppb) 0 5 10 15 20 25 30 Fig. 3. Continued.ACPD
8, 2275–2309, 2008 Characteristics of the NO-NO2-O3 system during the MIRAGE-Mex Z.-H. Shon et al. Title Page Abstract Introduction Conclusions References Tables Figures ◭ ◮ ◭ ◮ Back CloseFull Screen / Esc
Printer-friendly Version Interactive Discussion
(a) BL (b) BB
(a) BL (b) BB
Fig. 4. Air mass back trajectory analysis for 5 air mass categories (BL (a), BB (b), FTCO (ac,
FTMA (d), and TIC (e)), which are the most frequent air mass back trajectory for each air mass category.
ACPD
8, 2275–2309, 2008 Characteristics of the NO-NO2-O3 system during the MIRAGE-Mex Z.-H. Shon et al. Title Page Abstract Introduction Conclusions References Tables Figures ◭ ◮ ◭ ◮ Back CloseFull Screen / Esc
Printer-friendly Version Interactive Discussion (c) FTCO (c) FTCO Fig. 4. Continued. 2302
ACPD
8, 2275–2309, 2008 Characteristics of the NO-NO2-O3 system during the MIRAGE-Mex Z.-H. Shon et al. Title Page Abstract Introduction Conclusions References Tables Figures ◭ ◮ ◭ ◮ Back CloseFull Screen / Esc
Printer-friendly Version Interactive Discussion
(d) FTMA (e) TIC
(d) FTMA (e) TIC
ACPD
8, 2275–2309, 2008 Characteristics of the NO-NO2-O3 system during the MIRAGE-Mex Z.-H. Shon et al. Title Page Abstract Introduction Conclusions References Tables Figures ◭ ◮ ◭ ◮ Back CloseFull Screen / Esc
Printer-friendly Version Interactive Discussion BL 60 Y = 0.536 X 2 (a) BB 60 Y = 0.378 X 2 (b) BL N Ox (p p b ) 30 40 50 r 2 = 0.75 N = 375 4 Mar 8 Mar (a) N Ox (p p b ) 30 40 50 r 2 = 0.88 N = 86 ( ) 0 10 20 30 40 50 60 N 0 10 20 8 Mar 10 Mar 16 Mar 19 Mar 22 Mar 23 Mar 26 Mar 29 Mar 0 10 20 30 40 50 60 N 0 10 20 4 Mar 22 Mar 23 Mar FTMA 60 60 NOy (ppb) NOy (ppb) 6 0 5 10 15 20 25 6 0 403 X 0 5 10 15 20 25 0 403 X
Fig. 5. Correlation between NOxand NOy for 5 air mass categories (BL (a), BB (b), FTCO (c),
FTMA (d), and TIC (e)).
ACPD
8, 2275–2309, 2008 Characteristics of the NO-NO2-O3 system during the MIRAGE-Mex Z.-H. Shon et al. Title Page Abstract Introduction Conclusions References Tables Figures ◭ ◮ ◭ ◮ Back CloseFull Screen / Esc
Printer-friendly Version Interactive Discussion FTMA 50 60 Y = 0.176 X r2 = 0.70 N = 518 FTCO 50 60 Y = 0.168 X r2 = 0.66 N = 1046 (d) (c) 6 8 5 6 N Ox (p p b ) 20 30 40 N Ox (p p b ) 20 30 40 4 Mar 12 Mar 16 Mar 22 Mar 23 Mar 26 Mar 28 Mar 8 Mar 10 Mar 12 Mar 19 Mar 0 5 10 15 20 25 0 2 4 6 0 2 4 6 8 10 12 14 16 18 0 1 2 3 4 60 0 403 X NOy (ppb) 0 10 20 30 40 50 60 0 10 NOy (ppb) 0 10 20 30 40 50 60 0 10 0 5 10 15 20 25 TIC x 0 403 X x Fig. 5. Continued.
ACPD
8, 2275–2309, 2008 Characteristics of the NO-NO2-O3 system during the MIRAGE-Mex Z.-H. Shon et al. Title Page Abstract Introduction Conclusions References Tables Figures ◭ ◮ ◭ ◮ Back CloseFull Screen / Esc
Printer-friendly Version Interactive Discussion 60 Y 0 403 X
TIC
x (p p b ) 30 40 50 Y = 0.403 X r2 = 0.74 N = 67(e)
N Ox 0 10 20 10 Mar 19 Mar 22 Mar NOy (ppb) 0 10 20 30 40 50 60 Fig. 5. Continued.ACPD
8, 2275–2309, 2008 Characteristics of the NO-NO2-O3 system during the MIRAGE-Mex Z.-H. Shon et al. Title Page Abstract Introduction Conclusions References Tables Figures ◭ ◮ ◭ ◮ Back CloseFull Screen / Esc
Printer-friendly Version Interactive Discussion BL 180 Y = 5.323 X + 59.009 BB 180 Y = 4.612 X + 43.274 ( )BL (b) N O2 (p p b ) 80 100 120 140 160 r2 = 0.54 N = 367 100 120 140 160 180 4 Mar 8 Mar BB N O2 (p p b ) 80 100 120 140 160 r2 = 0.89 N = 86 100 120 140 160 180 (a) (b) 0 20 40 60 80 100 120 140 160 180 O3 + N 0 20 40 60 80 0 5 10 15 20 25 0 20 40 60 80 8 Mar 10 Mar 16 Mar 19 Mar 22 Mar 23 Mar 26 Mar 29 Mar 0 20 40 60 80 100 120 140 160 180 O3 + N 0 20 40 60 80 0 5 10 15 20 25 30 35 0 20 40 60 80 4 Mar 22 Mar 23 Mar FTMA ) 120 180 Y = 8.534 X + 42.989 FTCO ) 120 180 Y = 5.926 X + 44.008 NOz (ppb) 0 20 40 60 80 100 120 140 160 180 NOz (ppb) 0 20 40 60 80 100 120 140 160 180 (c) (d) ) 120 ) 120 23 Mar 20 10 Mar 23 Mar 20 10 Mar
Fig. 6. Correlation between O3+NO2and NOzfor 5 air mass categories (BL (a), BB (b), FTCO
(c), FTMA (d), and TIC (e)).
ACPD
8, 2275–2309, 2008 Characteristics of the NO-NO2-O3 system during the MIRAGE-Mex Z.-H. Shon et al. Title Page Abstract Introduction Conclusions References Tables Figures ◭ ◮ ◭ ◮ Back CloseFull Screen / Esc
Printer-friendly Version Interactive Discussion FTMA ) 120 140 160 180 Y = 8.534 X + 42.989 r2 = 0.82 N = 518 FTCO ) 120 140 160 180 Y = 5.926 X + 44.008 r2 = 0.80 N = 1044 NOz (ppb) NOz (ppb) (c) (d) 140 120 O3 + N O2 (p p b ) 40 60 80 100 120 O3 + N O2 (p p b ) 40 60 80 100 120 40 60 80 100 120 4 Mar 12 Mar 16 Mar 22 Mar 23 Mar 20 40 60 80 100 8 Mar 10 Mar 180 49 012 NOz (ppb) 0 20 40 60 80 100 120 140 160 180 0 20 NOz (ppb) 0 20 40 60 80 100 120 140 160 180 0 20 0 5 10 15 20 0 20 23 Mar 26 Mar 28 Mar 0 2 4 6 8 10 12 0 20 10 Mar 12 Mar 19 Mar TIC 49 012 Fig. 6. Continued.
ACPD
8, 2275–2309, 2008 Characteristics of the NO-NO2-O3 system during the MIRAGE-Mex Z.-H. Shon et al. Title Page Abstract Introduction Conclusions References Tables Figures ◭ ◮ ◭ ◮ Back CloseFull Screen / Esc
Printer-friendly Version Interactive Discussion 180 Y 4 526 X 49 012