Publisher’s version / Version de l'éditeur:
The Journal of Physical Chemistry C, 118, 41, pp. 23821-23834, 2014-09-24
READ THESE TERMS AND CONDITIONS CAREFULLY BEFORE USING THIS WEBSITE.
https://nrc-publications.canada.ca/eng/copyright
Vous avez des questions? Nous pouvons vous aider. Pour communiquer directement avec un auteur, consultez la
première page de la revue dans laquelle son article a été publié afin de trouver ses coordonnées. Si vous n’arrivez pas à les repérer, communiquez avec nous à PublicationsArchive-ArchivesPublications@nrc-cnrc.gc.ca.
Questions? Contact the NRC Publications Archive team at
PublicationsArchive-ArchivesPublications@nrc-cnrc.gc.ca. If you wish to email the authors directly, please see the first page of the publication for their contact information.
NRC Publications Archive
Archives des publications du CNRC
This publication could be one of several versions: author’s original, accepted manuscript or the publisher’s version. / La version de cette publication peut être l’une des suivantes : la version prépublication de l’auteur, la version acceptée du manuscrit ou la version de l’éditeur.
For the publisher’s version, please access the DOI link below./ Pour consulter la version de l’éditeur, utilisez le lien DOI ci-dessous.
https://doi.org/10.1021/jp507393u
Access and use of this website and the material on it are subject to the Terms and Conditions set forth at
Molecule-surface recognition between heterocyclic aromatic
compounds and kaolinite in toluene investigated by molecular theory of
solvation and thermodynamic and kinetic experiments
Huang, WenJuan; Dedzo, Gustave Kenne; Stoyanov, Stanislav R.;
Lyubimova, Olga; Gusarov, Sergey; Singh, Shashank; Lao, Hayes;
Kovalenko, Andriy; Detellier, Christian
https://publications-cnrc.canada.ca/fra/droits
L’accès à ce site Web et l’utilisation de son contenu sont assujettis aux conditions présentées dans le site LISEZ CES CONDITIONS ATTENTIVEMENT AVANT D’UTILISER CE SITE WEB.
NRC Publications Record / Notice d'Archives des publications de CNRC:
https://nrc-publications.canada.ca/eng/view/object/?id=7b90aae5-5f3a-4009-aa11-d27eb5d6926a https://publications-cnrc.canada.ca/fra/voir/objet/?id=7b90aae5-5f3a-4009-aa11-d27eb5d6926a
Molecule−Surface Recognition between Heterocyclic Aromatic
Compounds and Kaolinite in Toluene Investigated by Molecular
Theory of Solvation and Thermodynamic and Kinetic Experiments
WenJuan Huang,
†,‡Gustave Kenne Dedzo,
§,∥Stanislav R. Stoyanov,*
,†,‡,⊥Olga Lyubimova,
†,‡Sergey Gusarov,
†Shashank Singh,
§,∥Hayes Lao,
§,∥Andriy Kovalenko,*
,†,‡and Christian Detellier*
,§,∥†
National Institute for Nanotechnology, National Research Council of Canada, 11421 Saskatchewan Drive NW, Edmonton, Alberta T6G 2M9, Canada
‡
Department of Mechanical Engineering, University of Alberta, Edmonton, Alberta T6G 2G8, Canada
§
Department of Chemistry, University of Ottawa, 10 Marie Curie, Ottawa, Ontario K1N 6N5, Canada
∥
Centre for Catalysis Research and Innovation, University of Ottawa, 30 Marie-Curie, Ottawa, Ontario K1N 6N5, Canada
⊥
Department of Chemical and Materials Engineering, University of Alberta, Edmonton, Alberta T6G 2V4, Canada
*
S Supporting InformationABSTRACT: Molecular recognition interactions between kaolinite and a series of heterocyclic aromatic compounds (HAC) representative of the N- and S-containing moieties in petroleum asphaltene macromolecules are investigated using the three-dimensional reference interaction site model with the Kovalenko−Hirata closure approximation (3D-RISM-KH) theory of solvation and experimental techniques in toluene solvent. The statistical-mechanical 3D-RISM-KH molecular theory of solvation predicts the adsorption configuration and thermodynamics from the 3D site density distribution functions and total solvation free energy, respectively, for adsorption of HAC and toluene on kaolinite. Spectrophotometric measurements show that, among the HAC studied, only acridine and phenanthridine adsorb quantitatively on kaolinite. For these pyridinic HAC, the adsorption results fitted to the Langmuir isotherm in the monolayer
domain suggest a uniform monolayer of HAC molecules. The 3D-RISM-KH studies predict that the aluminum hydroxide surface of kaolinite is preferred for HAC adsorption due to strong hydrogen bonding with the pyridinic N atoms, while the rest of the HAC adsorb weaker. Adsorption on the silicon oxide side is weak and delocalized, as evident from the 3D solvation free energy density. Toluene sites effectively compete with non-hydrogen bonding HAC, such as fused thiophenes, for the kaolinite surface. The adsorption enthalpy and phenanthridine-acridine loading ratio are calculated and correlated with the experimentally determined Langmuir constant and adsorption loading. This combined experimental and computational modeling approach is aimed to provide insight into the specific interactions among clays, bitumen, and solvents so as to help accelerate the development of environmentally friendly and efficient desorption systems for nonaqueous extraction of bitumen from Oil Sands, an important unconventional petroleum reserve.
1. INTRODUCTION
Petroleum maintains a central role as the most important and widely used energy resource.1 In the last three decades, unconventional oil reserves have attracted attention as alternative petroleum resources capable of addressing the balance between demand and supply of oil.2 Oil sandsa mixture of sand, water, clay, and hydrocarbon-rich bitumen have recently been included in the world’s unconventional oil reserves and are estimated to make up 30% of the world’s total oil deposits. Alberta Oil Sands constitute about 1.3 to 2 trillion barrels of oil and are considered the second largest petroleum reserve in the world.1−3 Current mining operations based on the hot water flotation method for extraction of bitumen from oil sands developed by Karl Clark face challenges related to high energy cost and large carbon footprint,1,3,4and require a net intake of 2−4.5 barrels of fresh water from the Athabasca
river to produce a barrel of oil.5 Due to water resource
limitations, significant increase in the oil production is not feasible by aqueous extraction alone.6 Nonaqueous bitumen extraction is an important alternative to hot water flotation. Several approaches for extraction of bitumen using critical/ supercritical CO2,7ionic liquids at close to ambient conditions,8
organic solvents,5,9,10 as well as hybrid aqueous-nonaqueous processes11 have been tested at small scale.5,12 Although the
results are encouraging, nonaqueous extraction has not yet been used commercially for bitumen extraction mainly due to poor solvent recovery.5 A thorough understanding of the Received: July 23, 2014
Revised: September 22, 2014
Published: September 25, 2014
complex bitumen−clay interactions is the key to sustainable development of this unconventional natural resource.
Oil Sands bitumen contains large amounts of impurities, including S, N, O, Ni, and V.13These contaminants are mainly
present as part of heterocyclic aromatic compounds (HAC) and metalloporphyrin moieties incorporated into large asphaltene molecules in bitumen. Weak interactions among asphaltenes, recently described as underlying forces for the supramolecular assembly of asphaltenes, include acid−base, hydrogen bonding, π−π stacking, and metal coordination as well as formation of hydrophobic pockets, porous networks and host−guest complexes.13These aggregation interactions cause very serious technological problems, such as pipeline fouling, coke formation, and catalyst poisoning.13We have explored the molecular recognition between HAC and metalloporphyrins relevant to bitumen spectroscopic characterization,14,15 the
effect of the presence of trace amounts of water on asphaltene aggregation and other aspects of supramolecular interactions in heavy oils.16,17
Kaolinite, a predominant Oil Sands clay mineral, is a 1:1 phyllosilicate made up of one tetrahedral silicon oxide sheet linked to an octahedral aluminum hydroxide sheet.18−20 Numerous hydrogen bonds between the silicon dioxide and aluminum hydroxide surfaces from adjacent kaolinite layers hold kaolinite layers stacked together.19,21 These strong interactions are the reason why only few molecules or salts can access in one step the interlayer of kaolinite.22,23However, by a melt intercalation approach, using a preintercalate as the starting material, we have prepared numerous intercalated22,24 and grafted kaolinite nanocomposites.22,25 This type of interaction explains the tendency of kaolinite to form book-like aggregates.26 These aggregates are pseudo hexagonal
platelets of few micrometers defined by a siloxane and aluminum hydroxide basis, reminiscent of the elementary layer of kaolinite. It has been noted that interactions between kaolinite layers are strong enough to avoid some alkaline compounds from attacking interlayer surfaces of kaolinite.26
Molecular recognition−the mutual interaction between molecules or between a molecule and a surface−depends on precisely defined atomic arrangements in complementary structures interacting by short-range forces.27,28Intermolecular interactions of asphaltenes as well as asphaltene adsorption on
nanostructured surfaces are underlined by highly effective molecule−surface recognition forces. González et al. employed spectrophotometric measurements to study the adsorption kinetics of asphaltene model compounds on kaolinite and found that adsorption uptake is mainly dependent on molecular specificities, such as structure and heteroatom content but not on molecular size, suggesting highly specific molecular-surface interactions.29 Geochemical studies have revealed that the strong adsorption affinity of pyrrolic and pyridinic HAC toward kaolinite is largely determined by the steric availability of the N−H group and basic N atom, respectively.30 Recently, we reported the preparation, characterization, and computational investigation of indole−kaolinite organoclays formed by hydrogen bonding recognition interactions in the presence of toluene and heptane solvents.31
The two major computational modeling approaches employed to study molecule−kaolinite interactions are molecular simulations and electronic structure calculations. Molecule−kaolinite interactions, such as water adsorption,32,33 and intercalation of small organic molecules, including dimethyl sulfoxide, formamide, and methanol,34have been studied using molecular simulations. Multilayer thin films of water adsorb on kaolinite, preferentially to layers of pyridine and heptane, according to the molecular dynamics study of Ni and Choi,35in
agreement with microcalorimetry measurements.36 Molecular dynamics and Monte Carlo simulations show competitive binding between water and organic molecules on the two kaolinite surfaces.35,37 All these simulations predict that stronger hydrogen bonding interactions occur between polar groups in molecules and the aluminum hydroxide surface of kaolinite.35,37,38 Ab initio methods have been employed to calculate hydroxyl group vibrational frequencies, adsorption energies, catalytic activity and other properties, as presented in the review of Boulet et al.39Johnson et al. have reported that the adsorption of benzene, n-hexane, pyridine, 2-propanol, and water is stronger on the aluminum hydroxide surface of kaolinite than on the silicon oxide surface, using density functional theory with the exchange hole dipole moment dispersion model40in periodic boundary conditions.38We have employed quantum mechanics/molecular mechanics and density functional theory with periodic boundary conditions Scheme 1. Atom numbering for Toluene and the Heterocyclic Aromatic Hydrocarbon (HAC) Molecules Included in This Study
to study the adsorption of HAC on chabazite and highlighted the insights obtained using these surface modeling methods.41
Solvation modeling is crucial for the fundamental under-standing of bitumen−surface interactions in the presence of solvents, as in the case of solvent extraction of bitumen from Oil Sands. A very important method uniquely capable of predicting full solvation thermodynamics as well as accurate 3D solvation structure is the three-dimensional reference inter-action site model with the Kovalenko-Hirata closure approx-imation (3D-RISM-KH).42−47 The statistical-mechanical,
3D-RISM-KH molecular theory of solvation reproduces structural and phase transitions in simple and complex liquids and solutions in a wide range of thermodynamic conditions, including ambient and supercritical states, and nanoporous confinement,48and properly accounts for both nonpolar and electrostatic interactions, such as hydrogen bonding, solvopho-bicity, salt bridges, structural solvent molecules, and other steric and associative effects.43 The 3D-RISM-KH theory has been
employed to predict gelation activity,49 self-assembly and conformational transitions of supramolecular rosette nano-tubes,50 and molecular recognition in biomolecular nano-systems46,49 as well as to calculate the nanoscale forces that
control plant cell wall strength and contribute to biomass recalcitrance.51 An overview of the applications of the
3D-RISM-KH theory of solvation to chemical and biological nanosystems and in nanoporous materials is available in ref 43. In bitumen and Oil Sands research, the 3D-RISM-KH theory of solvation has been employed to study the molecular recognition of thiophenic bitumen fragments toward transition metal ion-exchanged chabazite nanoparticle surfaces in the presence of benzene solvent52 and adsorption of indole on kaolinite in toluene and heptane solvents31as well as the role of
water in the stabilization of supramolecular asphaltene aggregates.16
In this Article, we employ several experimental adsorption methods as well as the 3D-RISM-KH molecular theory of solvation to study the molecule−surface recognition between a series of HAC (Scheme 1) and kaolinite in toluene solvent. With this collaborative computational and experimental approach, we investigate the affinity, capacity, preferred molecular configurations and thermodynamics of adsorption between HAC and kaolinite surfaces. Moreover, we further refine and validate the computational modeling methodology for understanding and prediction of clay-bitumen interactions in solution.
2. EXPERIMENTAL AND COMPUTATIONAL MODELS AND METHODS
Materials and Chemicals. Acridine (97%), carbazole (95%), and toluene (97%) were purchased from Fluka, Fisher, and Sigma, respectively. Phenanthridine (98%), dibenzothio-phene (98%) and benzothiodibenzothio-phene (98%) were purchased from Aldrich. Well-crystallized kaolinite (KGa-1b, Georgia) was obtained from the Source Clays Repository of the Clay Minerals Society (Purdue University, West Lafayette, Indiana, USA). The clay fraction of less than 2 μm was collected by sedimentation and used without any pretreatment.
Adsorption and Desorption Experiments. During adsorption experiments, a mass of kaolinite (10 g L−1) was
dispersed in a solution of one of the above HACs in toluene. After shaking/stirring for a specified contact time, the mixture was centrifuged, and the supernatant was removed and analyzed by UV−vis spectrophotometry. The wavelengths used for
quantification were 358 nm for acridine, 345 nm for phenanthridine, 335 nm for carbazole, 298 nm for benzothio-phene and 325 nm for dibenzothiobenzothio-phene. Calibration curves obtained at these wavelengths from standard solutions were used to convert absorbance of solutions to concentration. The amount of adsorbed compound per unit mass of adsorbent q (μmol g−1) was determined using the following equation:
= − ·
q C C V
m
( i e)
k (1)
where Ci (μmol L−1) is the initial concentration of adsorbate,
Ce (μmol L−1) is the equilibrium concentration of adsorbate
after adsorption, V (L) is the volume of the solution, and mk
(g) is the mass of kaolinite.
For desorption experiments, a 10 mg sample of freshly prepared dry kaolinite-adsorbate composite was dispersed in toluene. After 5 h of stirring, the mixture was centrifuged, and the concentration of the supernatant was determined by the method described above. Desorption percentages (%D) were then calculated from the following equation:
= · ×
D C V
m
% s 100
(2) where Cs (μmol L−1) is the equilibrium concentration of
adsorbate in solution after desorption, V (L) is the volume of the desorption solution, and m (g) is the mass of adsorbate in the kaolinite−adsorbate composite.
Characterization. Powder X-ray diffraction (XRD) pat-terns were recorded using a Philips PW 3710 diffractometer operating with Cu−Kα radiation (λ = 1.54056 Å) and a generator with a voltage of 45 kV and a current of 40 mA. Thermal gravimetric analyses (TGA) were recorded using an SDT 2960 instrument under nitrogen flow (10 mL/min) at a heating rate of 10 °C/min.
Computational Models and Methods. In our model systems, the kaolinite platelet is the solute, and each of the five solvents contains two species: toluene and an HAC (Scheme 1). Geometry optimization of toluene and the HAC molecules acridine, benzothiophene, carbazole, dibenzothiophene, and phenanthridine, all in toluene solvent, were performed using the semiempirical PM7 method53 and the integral equation
formalism variant of the polarizable continuum model (IEF-PCM) of solvation with dielectric constant of 2.38 (toluene), as implemented in the MOPAC2012 computational chemistry software suite.54For the solvent DRISM-KH calculations, the HAC optimized structures and atomic charges were calculated using the PM7 method, and nonbonding atomic parameters were taken from the optimized intermolecular potential functions−all atom (OPLS-aa) force field.55 The toluene structure and charges were also taken from PM7 geometry optimization, but the force field was the optimized intermolecular potential functions−united atom (OPLS-ua) built for substituted benzenes.56 The OPLS parameters were developed and optimized to describe intermolecular inter-actions in fluids and employed to calculate friction forces and slip lengths for laminar flow of molecular liquids on metal surfaces, in agreement with experimental measurements.57The mole ratio HAC:toluene of 1:999 and temperature 298.15 K were also input in the solvent DRISM-KH calculations. The density and dielectric constant of the HAC−toluene solutions were assumed to be the same as that of pure toluene.
The kaolinite platelet was modeled as a continuous surface containing a single sheet without edge termination. The geometry of the kaolinite platelet containing A3 × B2 unit cells of Al4Si4O10(OH)8taken from the crystal structure58was
fully optimized in gas phase in a periodic boundary conditions box with dimensions fixed at 15.447 × 17.868 × 128.0 Å3using
the PM7 method (Supporting Information Figure S1) as implemented in the solid state module of MOPAC2012.54This
model allows for a ∼120 Å vacuum slab between the kaolinite layers along the z-axis that is filled with solvent in the 3D-RISM-KH calculations. The optimized structure of the kaolinite platelet and CLAYFF charges and atomic parameters were used as input for the 3D-RISM-KH calculations.19The structure of kaolinite was not allowed to relax in the solution as part of the 3D-RISM-KH calculations. The PM7 method is parametrized using high-level experimental and ab initio reference data and tested extensively for solids, including clay minerals. This semiempirical method features improved description of non-covalent interactions and neglect of diatomic differential overlap (NDDO) treatment compared to the PM6 method. In PM7, the limitations of NDDO with respect to prediction of hydrogen bonding and π-stacking are addressed by introducing core−core Gaussian functions on N, C, O, and H atoms to mimic van der Waals effects.53
3D-RISM-KH Theory Overview. In the 3D-RISM-KH molecular theory of solvation,42,43the solvation structure of the
solute is represented in terms of 3D spatial maps that give the probability density of finding solvent site γ at 3D space position r around the solute molecule, ργgγ(r). The average number
density in the solution bulk is ργ, and the 3D distribution
function (normalized density distribution) of solvent site γ is
gγ(r). A gγ(r) value of 1.0 corresponds to bulk solvent
distribution far from the solute. When gγ(r) >1.0, the solvent
site density is enhanced relative to bulk solvent. When gγ(r)
<1.0, the solvent density is depleted relative to bulk solvent. In advance to the 3D-RISM-KH calculation, hαγ(r) are
obtained from the dielectrically consistent RISM theory (DRISM)59,60 coupled with the KH closure
(DRISM-KH),42,43which is applied to the solutions of HAC in toluene. The susceptibility of the bulk solution is calculated according to eq 3:
χαγ( )r =ωαγ( )r +ραhαγ( )r (3)
where the intramolecular correlation function ωαγ(r) = δαγδ(r)
+ (1 − δαγ)δ(r − lαγ)/(4πlαγ2) represents the geometry of
solvent molecules with site−site separations lαγspecified by the
molecular force field, and hαγ(r) is the radial total correlation
function between sites α and γ enumerating all sites on all sorts of molecules in bulk solvent. The bulk solution susceptibility χαγ(r) is then input into the 3D-RISM integral equation
∫
∑
χ = ′ − ′ ′ γ α α αγ h( )r d cr (r r) ( )r (4) coupled with the Kovalenko−Hirata (KH) closure= − + − ≤ − + − > γ γ γ γ γ γ γ γ γ ⎧ ⎨ ⎪ ⎪ ⎪ ⎩ ⎪ ⎪ ⎪ ⎛ ⎝ ⎜ ⎞ ⎠ ⎟ g u k T h c g u k T h c g r r r r r r r r r ( ) exp ( ) ( ) ( ) for ( ) 1 1 ( ) ( ) ( ) for ( ) 1 B B (5)
where hγ(r) is the 3D site total correlation function related to
the density distribution function gγ(r) = hγ(r) +1, cγ(r) is the
3D site direct correlation function reflecting “direct inter-actions” in solution and having the asymptotics of the interaction potential uγ(r), χαγ(r) is the susceptibility of pure
solvent and kBT is the Boltzmann constant times the solution
temperature. Equations 4 and 5 are converged to a relative root-mean-square accuracy of 10−4by using the modified direct
inversion in the iterative subspace (MDIIS) accelerated numerical solver of integral equations of liquid state theory.42,43
The KH closure 5 combines in a nontrivial way the so-called mean spherical approximation (MSA) and hypernetted chain (HNC) approximation, the former being applied to the spatial regions of solvent density enrichment (gγ(r) >1) such as
association peaks, and the latter to those of solvent density depletion (gγ(r) <1) including the repulsive core.
The solvation free energy (SFE) ΔμsolvKH of the kaolinite
platelet in a multicomponent solvent following from the 3D-RISM-KH integral eqs 4 and 5 is given in terms of the 3D site total and direct correlation functions hγ(r) and cγ(r) by the
closed analytical expression42,43
∫
∑
μ Δ = Φ γ γ r r d ( ) solv KH (6a) ρ Φγ = γ γ Θ − γ − γ − γ γ ⎡ ⎣⎢ ⎤ ⎦⎥ k T h h c h c r r r r r r ( ) 1 2 ( ) ( ( )) ( ) 1 2 ( ) ( ) B 2 (6b) where Θ(x) is the Heaviside step function. The integrand Φγ(r)in 6a is interpreted as the solvation free energy density (3D-SFED) coming from interaction site γ of solvent molecules around the solute. The SFE of the solute ΔμsolvKH is obtained by
summation and spatial integration of the 3D-SFED partial contributions from all solvent species over the solvation shells in the whole space. In this way, 3D-SFED characterizes the intensity of the solute−solvent effective interactions in different 3D spatial regions and indicates where these contribute the most/least to the entire SFE.51
At constant density (isochoric conditions), the SFE is decomposed into excess partial molecular entropy and excess partial solvation enthalpy as follows:
μ ε μ Δ = − ∂ ∂ = + Δ ρ ⎛ ⎝ ⎜ ⎞ ⎠ ⎟ s T and T S u,V u u u u,V V (7)
The potential of mean force (PMF) acting on solvent site γ near the crystal layer is defined in terms of the 3D site distribution function as follows:
= −
γ r k T gγ r
PMF ( ) B ln ( ) (8)
The average amount of adsorbate site gγaver(r) in a slice with a
volume of ΔV = xyΔz is calculated by integration of gγ(r) and
gives the adsorption and depletion layers of HAC sites on both sides of the kaolinite platelet,31as follows:
∫
= Δ = Δ γ Δ γ g ( )r drg ( );r V xy z V z aver ( ) (9)where x and y are the dimensions of the unit cell parallel to the kaolinite plane and the slab thickness along the direction perpendicular to the kaolinite platelet surface is set to Δz = 0.5 Å. The integrated gγ(r) for a slab with thickness z gγinteger(r)
yields the capacity of each solvent site on kaolinite Si−O and Al−OH surfaces,31calculated as follows:
∫
=
γ γ
gintegr( )r drg( )r
(10) More detailed formulations of the DRISM-KH and 3D-RISM-KH solvation theories are available in refs 42, 43, 46, 51.
3. RESULTS AND DISCUSSION
Experimental Adsorption and Desorption Studies. A series of experiments was performed to identify the HAC (Scheme 1) that adsorb quantitatively onto kaolinite in the experimental conditions used. Kaolinite was dispersed in 2 × 10⁻⁴mol L−1solutions of each HAC prepared in toluene, and
stirred for 24 h. The UV−vis spectra of the solutions recorded before and after reaction with kaolinite (Supporting Informa-tion, Figure S2) show that only phenanthridine and acridine were adsorbed quantitatively on kaolinite. For the other HAC, adsorption did not occur or was very weak to be quantified accurately. For this reason, in the experimental part of this work, we focused only on the phenanthridine and acridine adsorption.
As a prelude to the adsorption studies, we conducted some investigations on the nature of the active sites. The most important area of layered materials is located in the interlayer. A compound would be adsorbed more quantitatively if it can access these surfaces. In the case of effective insertion of a compound, there would be certain changes in the XRD pattern of the layered material. For kaolinite, the d001 would increase
(with the relation to the size and the conformation of the compound in the interlayer), corresponding to expansion of the layers of the clay.23,25,61In our investigations, no changes were observed in the diffraction patterns of kaolinite before and after the adsorption of acridine or phenanthridine (Supporting Information, Figure S3). This means that adsorption took place exclusively on the external surface of the kaolinite platelets. Such behavior is very common in the literature when kaolinite is used as adsorbent.62 The explanation is in the strong interactions between adjacent layers of kaolinite through a
dense network of hydrogen bonds between the siloxane and aluminum hydroxide surfaces.
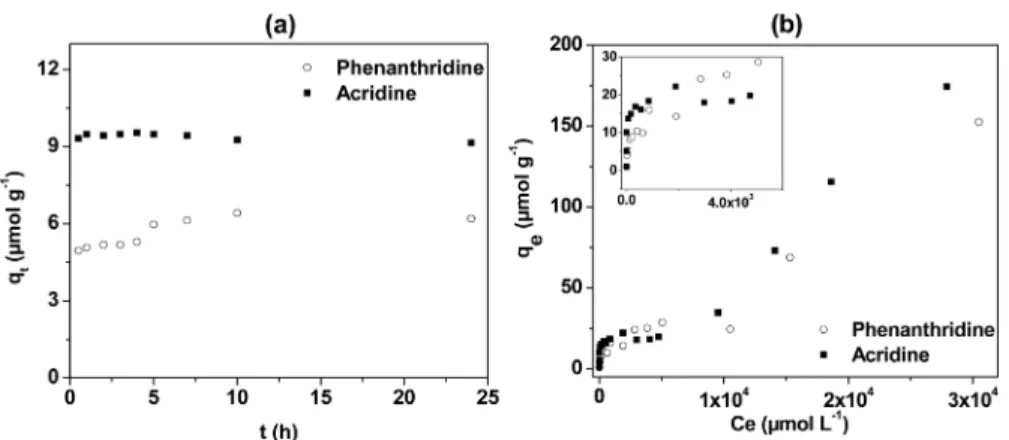
Adsorption Kinetics.The time needed for the adsorption of the pyridinic HAC to reach the equilibrium was first investigated. Figure 1a shows the results obtained when varying the contact time during the adsorption of acridine or phenanthridine. For these two systems at a given concentration, the largest amount of adsorption occurred during the first moment in both processes. Almost no change was observed in the adsorption result for acridine after 30 min of contact time. For phenanthridine, a slight increase was obtained in the adsorption with time, and the equilibrium was reached after 5 h. The experimental adsorption capacities at equilibrium were 9.32 μmol g−1 for acridine and 6.19 μmol g−1 for
phenanthridine in these experiments. Such a fast kinetics can be explained by the high affinity between the clay platelets and the adsorbate.
The pseudo-second-order kinetic model of Ho and Mckay widely used in adsorption studies was employed for the analysis of experimental data.63Unlike other models, the model of Ho and Mckay can predict the process over the entire adsorption range.64The equation for this model and the initial adsorption rate h (μmol g−1 min−1) derived from this relation are
presented below:65 = + t q k q q t 1 1 t 2 e 2 e (11) = h k q2 e2 (12)
where k2 (g μmol−1min−1) is the rate constant of
pseudo-second-order reaction process, qt(μmol g−1) is the amount of
adsorbate adsorbed at time t (min), and qe(μmol g−1) is the
amount adsorbed at equilibrium.
The constants obtained when applying this model are listed in Table 1. The correlation coefficients and the values of the adsorption capacities at equilibrium close to experimental values confirm the good prediction of the model to these systems.
Figure 1.(a) Kinetics of adsorption of phenanthridine and acridine on kaolinite. Experimental conditions: 10 g L−1of kaolinite and 10−4mol L−1of acridine or phenanthridine at room temperature. (b) Adsorption isotherms of acridine and phenanthridine on kaolinite. Experimental conditions: 10 g L−1of kaolinite and contact time of 5 h at room temperature.
Table 1. Pseudo-Second-Order Kinetic Model Constants for the Adsorption of Acridine and Phenanthridine
qexp(μmol g−1) qe(μmol g−1) 102k2(g μmol−1min−1) h (μmol g−1min−1) R2
acridine 9.32 9.54 18.28 16.64 1
Higher values of k2 and h for acridine relative to
phenanthridine confirmed that this compound has a higher affinity for kaolinite. If we also consider the time needed for the achievement of the equilibrium and the adsorption capacity at equilibrium under these experimental conditions, acridine appears to interact more strongly with kaolinite. This strong interaction compared to phenanthridine can be related to the difference in basicity between these two compounds: acridine (pKa 5.6) is more basic than phenanthridine (pKa 4.52).
Assuming that these compounds are adsorbed preferentially on the kaolinite aluminum hydroxide surface through hydrogen bond interactions, the most active compound would possess naturally the more basic N atom. This hypothesis was verified when considering preliminary results obtained for carbazole, benzothiophene and dibenzotiophene adsorption. These compounds are less active toward the formation of hydrogen bonds and none of these three compounds quantitatively adsorbed onto kaolinite. This confirms that the aluminum hydroxide surfaces of kaolinite are the most active sites for adsorption through the formation of hydrogen bonds.
Adsorption Isotherms. By varying the concentrations of both adsorbates, the results presented in Figure 1b were obtained. The adsorption profiles of the two compounds can be divided into three parts: (i) a fast increase in adsorption capacity at low concentration, reflecting a strong activity of the adsorption sites; (ii) a plateau for a wide range of concentration, indicating saturation of the sites involved in the first step; and (iii) at higher concentrations, a gradual increase in the adsorption capacity. Generally, an increase in the adsorption capacity after the formation of the plateau is associated with a multilayer adsorption. In this case, the contribution of the siloxane surfaces of kaolinite platelets may also be associated with this increase. For high concentrations, these sites could become active for adsorption.
Considering particularly the first section of the isotherms (inset of Figure 1b), we found that compared to phenan-thridine, acridine adsorb more easily on kaolinite at low concentration, which is in agreement with the adsorption isotherm results (see above). However, for equilibrium
concentration ranging from 4.0 × 10³to 6.0 × 10³μmol L−1,
phenanthridine shows larger adsorption than acridine. The Langmuir and Freundlich models with linearized forms presented in eq 13 and 14, respectively, were employed to fit the experimental data of the monolayer domain of the isotherms:66,67 = + C q q C K q 1 1 e e m e L m (13) = + q K n C ln e ln F 1 ln e (14) where qm (μmol g−1) is the maximum adsorption capacity
(monolayer capacity), KL(L μmol−1) is the Langmuir constant
related to the heat (enthalpy) of adsorption, KF is the
Freundlich constant related to adsorption capacity, and 1/n is a constant related to the heterogeneity and intensity of the adsorption process.
The Langmuir equation, which was initially proposed to describe the dependence of the surface coverage of gas adsorption on the pressure of the gas above the surface at fixed temperature, also shows good predictions for solid−liquid adsorption systems.68 The Langmuir model is particularly useful for describing monolayer adsorption on homogeneous surfaces.69 The Freundlich equation is applied for adsorption on heterogeneous surfaces.69
Considering the correlation coefficients listed in Table 2, the Langmuir isotherm yields a better correlation between predictions and the experimental data. The larger value of the Langmuir constant for acridine adsorption (44.26 × 10⁻³ L
μmol−1) than phenanthridine adsorption (3.58 × 10⁻³ L
μmol−1) confirms once again the higher affinity between
kaolinite platelets and the more basic N atom of acridine.68 This also indicates a more negative overall heat (enthalpy) of adsorption for acridine. It is important to note that for phenanthridine, the correlation coefficients for the Langmuir (R2= 0.98) and the Freundlich (R2= 0.96) isotherms are very
close. This shows that the adsorption of phenanthridine was Table 2. Langmuir and Freundlich Isotherm Constants for the Adsorption of Acridine and Phenanthridine on Kaolinite
Langmuir Freundlich
Adsorbate qm(μmol g−1) 103KL(L μmol−1) R2 KF 1/n R2
acridine 19.25 44.26 0.99 8.00 0.11 0.93
phenanthridine 26.11 3.58 0.98 1.22 0.36 0.96
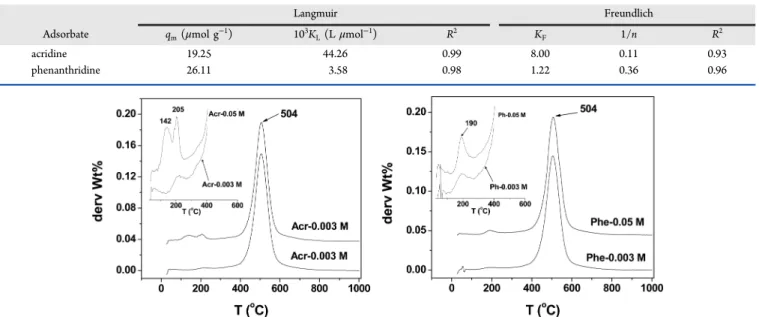
Figure 2.DTGA curves of acridine−kaolinite (left) and phenanthridine−kaolinite composites (right) for the monolayer and the multilayer coverage. Experimental condition: nitrogen flow rate, 10 mL min−1and heating rate 10 °C min−1.
not homogeneous like that of acridine. This behavior could be due to the geometry of phenanthridine not favorable for the formation of a well-ordered molecular layer on the surface of kaolinite. This could also explain why the adsorbed amount for the monolayer coverage was larger for phenanthridine (26.11 μmol g−1) compared to acridine (19.25 μmol g−1). Indeed,
since the adsorption of phenanthridine was not homogeneous, the monolayer would appear not well delimited. The Freundlich model confirms that the adsorption of these two pyridinic HAC is favorable (values of 1/n < 1) as well as the stronger affinity of acridine (1/n = 0.11) for the kaolinite surface compared to phenanthridine (1/n = 0.36).68
The multilayer formation was confirmed by recording the kaolinite-adsorbate TGA graphs. For each adsorbate, two samples were prepared: one in the experimental conditions of the formation of the monolayer (0.003 mol L−1of adsorbate),
and the other in the multilayer domain (0.05 mol L−1 of
adsorbate). The results obtained are presented in Figure 2, where differential thermal gravimetric analysis (DTGA) results were plotted to highlight the mass losses temperatures.
Under the conditions of the monolayer, one observes broad peaks centered at 205 and 190 °C for acridine and phenanthridine, respectively. These temperatures are all above the melting temperatures of the compounds (about 107 °C) and correspond to the vaporization of the compound adsorbed as a monolayer on kaolinite. The higher temperature for acridine indicates stronger interactions with kaolinite compared to phenanthridine. These mass losses are not related to the solvent since a blank recorded with a kaolinite sample previously suspended in toluene and dried under similar conditions did not show similar behavior. Under the conditions of the multilayer, the peaks of acridine became well-defined and more intense due to the large amount of adsorbed compound or probably because the molecules were organized in a more homogeneous phase. In the particular case of acridine, we observed a second peak at 142 °C, which may indicate the presence of a multilayer adsorption. The presence of this peak could be due to the large difference in the binding energy of the monolayer compared to those of the upper layers. Although our hypothesis implies that interactions between acridine and kaolinite are strong compared to those of phenanthridine, the upper layers would not benefit from this type of interaction and will therefore be less stable. In the case of phenanthridine, the hydrogen bonds would be weaker. Therefore, the cohesive energy of the upper layers appears to be similar to that of the first layer, resulting in desorption of phenanthridine in one step. The less homogeneous adsorption of phenanthridine compared to acridine implies no clear separation between the monolayer and the upper layers and helps explain why the distinction between these two layers was not possible by DTGA.
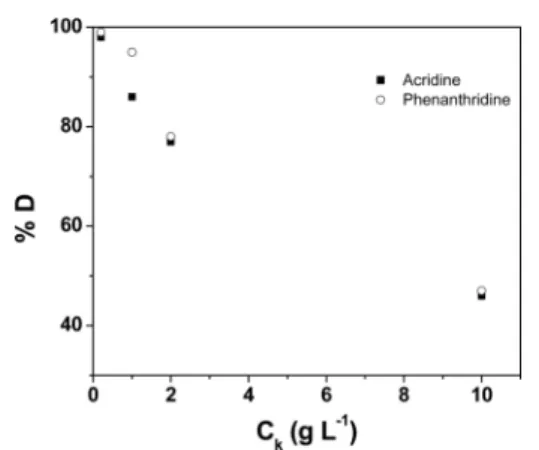
Desorption Studies in Toluene. Desorption experiments were performed in toluene to evaluate the effects of the solvent. The kaolinite−adsorbate composites were prepared in experimental condition of the monolayer formation (initial HAC concentration of 0.003 mol L−1). These conditions were
chosen to ensure the reproducibility of the results and also because only the monolayer behavior could well explain what happens at the interface between the adsorbate and kaolinite.
Figure 3 shows the variation of the desorption percentage with respect to the concentration of the kaolinite−adsorbate composite. We found that it is possible to completely remove the adsorbed compounds by decreasing the composite concentration. At a composite concentration of 0.2 g L−1, a
complete removal was obtained for the two pyridinic compounds. As the concentration of the composite is increased, the desorption percentage decreases rapidly. These results highlight that when the solvent is largely in excess, the equilibrium gets shifted to favor desorption. We found that the desorption percentage trends with respect to dilution were similar for both acridine and phenanthridine.
3D-RISM-KH Adsorption Structure and Thermody-namics. The 3D density distribution functions gγ(r) of
individual solvent sites as well as the ΔμsolvKH and 3D-SFED of
entire HAC and toluene molecules are calculated using the 3D-RISM-KH molecular theory of solvation. The gγ(r) density
distribution isosurfaces yield predictions of the preferred adsorption configurations, as shown for indole.31 The
isosur-faces of gγ(r) calculated using the 3D-RISM-KH theory suggest
a set of statistically probable solvent arrangements and orientations that are more realistic for solvent in liquid phase at room temperature than, for example, an optimized geometry.52Moreover, based on gγ(r), we evaluate the binding
capacity and affinity of HAC based on the strongest-bonded sites of HAC molecules on kaolinite. The SFE yields the adsorption free energy, entropy and enthalpy of the molecular species included in the solvent, such as HAC and toluene. The SFE gives the total adsorption free energy summed over all kaolinite sites and solvent (HAC or toluene) sites integrated over the entire solvent box. The 3D-SFED isosurfaces show the regions that contribute the most to the adsorption of HAC on kaolinite.
Adsorption Configuration of HAC on Kaolinite Surfaces. Based on the 3D spatial maps of the 3D site density distribution functions gγ(r) statistically mechanically weighed over the
ensemble of solvent arrangements at the surface, we estimate the adsorption and preferred orientation of HAC on the kaolinite surfaces. Our analysis yields that among all solvent system sites, the highest gγ(r) maxima are for heteroatoms and
the carbazole acidic H atom sites. Among these, the pyridinic N atom sites of acridine and phenanthridine have the two highest
gγ(r) maxima. All heteroatom and acidic H atom site maxima
are localized near the kaolinite aluminum hydroxide surface, suggesting strong hydrogen bonding and electrostatic inter-actions, in qualitative agreement with previous computa-tional34,36,37 and experimental studies on heterocycles and
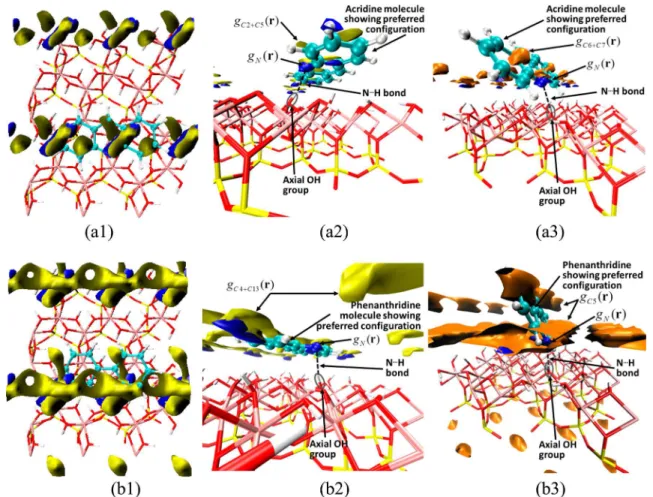
polar molecules. In Figure 4, we show acridine and phenanthridine atomic site density isosurfaces that indicate two major adsorption configurations, parallel and at an acute angle (nonparallel) with respect to the kaolinite aluminum Figure 3. Effect of composite concentration on the desorption percentage of acridine and phenanthridine in toluene.
hydroxide surface. The nonparallel configuration (Figure 4 (a3 and b3)) favors hydrogen bonding between the N atoms of the pyridinic HAC and the H atoms of axial hydroxyl groups of the kaolinite platelet. The parallel configuration (Figure 4 (a1, a2, b1 and b2)) favors multiple weak dispersion and electrostatic interactions of the aromatic hydrocarbon moieties of the HAC in addition to hydrogen bonding. These interactions controlled by short-range forces yield complementary atomic
arrange-ments indicative of molecule−surface recognition. The adsorption configurations of HAC and toluene on the silicon oxide surface are mainly parallel, similar to those of indole in toluene presented in ref 31. Toluene atom sites generally have similar density distribution on both sides of kaolinite and show no specific toluene-kaolinite interactions.31
3D-RISM-KH Site Distribution, PMF, and Adsorption Energy.The PMFs are calculated from gγ(r) according to eq
Figure 4.Isosurfaces of the 3D site density distribution function gγ(r) showing localization of HAC on the kaolinite Al−OH surface. Acridine and phenanthridine molecules are placed to show the preferred configurations deduced based on the isosurfaces. (a1 and a2) acridine parallel to kaolinite (g(C2) = 3.0; g(C5) = 2.5; g(N) = 5.0); (a3) acridine nonparallel configuration (g(C6) = 3.3; g(C7) = 2.2); g(N) = 5.0); (b1 and b2) phenanthridine parallel configuration (g(C4) = 2.4; g(C13) = 2.9; g(N) = 5.0); (b3) phenanthridine nonparallel configuration (g(C5) = 1.4; g(N) = 5.0). Atom numbering according to Scheme 1. gγ(r) isosurface colors: N - blue, C∥- yellow, Cnon‑∥- orange. Kaolinite atom colors: O - red, H - white, Al - pink, Si - yellow. HAC isosurface colors: C - green, N - blue.
Figure 5.Plots of the 1D gγ(r) and PMF (eq 8) for the sites of HAC−toluene solvent systems with the highest gγ(r) maxima calculated using the 3D-RISM-KH theory. The Si and Al atom planes are set as zero on the left and right-hand sides, respectively, of the kaolinite platelet. NA: N site in acridine; SB: S site in benzothiophene; NC: N site in carbazole; H(N)C: the acidic H site bonded to the N site in carbazole; SD: S site in dibenzothiophene; NP: N site in phenanthridine; C4T: C1 site on toluene in toluene-acridine solvent system; MeT: CH3site on toluene in toluene-acridine solvent system.
8 for 1D projections of the 3D site distribution functions gγ(r).
The 1D projections are made on vectors perpendicular to the kaolinite surface going through the maxima of pyridinic gN(r)
(γ is the N atom site), which are the highest maxima among all solvent sites.
In Figure 5a,b, we show the 1D projection of gγ(r) and the
PMF plots. In the PMF plot, the absolute minimum gives the adsorption energy. The desorption barrier calculated as the energy difference between the absolute maximum and absolute minimum is relevant to the desorption kinetics. The highest
gγ(r) maxima, the deepest PMF minima, and the largest
desorption barriers are for polar atoms, indicating that these are the hardest to desorb solvent sites.
On the aluminum hydroxide surface, the gγ(r) and PMF plots
(Figure 5a,b) show clearly that the strongest adsorption involves the N atom sites of pyridinic HAC, with adsorption energies (PMF minima) of −1.02 kcal mol−1and −1.07 kcal
mol−1 for the N atom sites of acridine and phenanthridine,
respectively. The N site adsorption energy is determined by the basicity and steric accessibility of the pyridinic N atom. While the N atom of acridine is more basic with a Mulliken charge of −0.435 |e| compared to the N atom of phenanthridine with a charge of −0.407 |e|, the acridine N atom is less accessible sterically than that of phenanthridine due to the orientation of the H atoms at adjacent C atoms. The corresponding maximum
gN(r) values of acridine and phenanthridine N sites are 5.62 and
6.08, respectively, indicating that the possibility of finding these sites localized at the surface is almost 6 times as high as in bulk solvent. It is worthy to note that the values of the 1D projection of gN(r) are higher for acridine than for phenanthridine at
distances 3−5 Å to OAl (Figure 5a), suggesting higher
distribution of the parallel configuration for acridine than for phenanthridine. Next in the order of decreasing adsorption strength is the acidic H site bonded to the N atom of carbazole, followed by the S atoms of the thiophenic HAC, the latter being comparable to the toluene C4 and methyl group sites (Figure 5b). Thus, toluene sites would compete with SBand SD
and even with H(N)C sites and could replace S-containing
HAC and carbazole on the kaolinite aluminum hydroxide surface, whereas the adsorption of pyridinic HAC N sites is substantially stronger than that of toluene and the latter HAC would remain adsorbed, in qualitative agreement with the UV− vis spectrophotometric adsorption studies.
It is important to note that in the 3D-RISM-KH theory, the density distributions gγ(r) of solvent interaction sites γ around
the kaolinite platelet, which are represented individually with 3D maps or isosurfaces, are correlated through the 3D-RISM
integral eq 4 and thus reflect the solvent molecular structure. For example, for carbazole, the 3D density distribution function of the acidic H atom site gH(N)(r) is correlated with the 3D
density distribution function of the N atom site gN(r) so that
the acidic H atom bonded to the N atom is found near the N atom, thus reproducing the structure of carbazole. Moreover, the position of the gN(r) maximum for carbazole at the same
distance as that of the pyridinic gN(r) maxima suggests some
hydrogen bonding of the carbazole N atom as well. The maximum of the gH(N)(r) of the H atom site at the N of
carbazole is closer to the aluminum hydroxide surface of kaolinite than the heteroatoms as the H atom is involved in hydrogen bonding with the hydroxyl O atoms of kaolinite that are closer to the Al atom plane than the hydroxyl H atoms.
On the silicon oxide surface of kaolinite, the methyl group of toluene has the highest gγ(r) maximum of 3.90 that yields a
methyl site adsorption energy value of −0.81 kcal mol−1,
indicating that this surface would be fully solvated by toluene. Next in adsorption strength are the S atom sites of benzo- and dibenzothiophene, with substantially lower site adsorption energy of −0.63 kcal mol−1. The g
H(N)(r) maximum is
comparable to that of an aromatic C atom site of toluene solvent. Near the silicon oxide surface, the gN(r) of acridine and
phenanthridine are lower than 1, indicating N atom site depletion and positive adsorption energies. The maxima of
gγ(r) for all atom sites are listed in Supporting Information
Table S1.
Binding Capacity and Multilayer Adsorption Analysis.In Figure 6, we show the average and integrated 3D distribution function gγ(r) in slices stacked along the vector perpendicular
to the kaolinite surface. The average values per slice (Figure 6a) indicate the adsorption capacity of solvent sites on kaolinite and allows prediction of multilayer adsorption. In Figure 6a, the peaks of NA and NP near the aluminum hydroxide surface
correspond to the monolayer adsorption capacity of these two HAC sites. The NP maximum is higher than that of NA,
indicating higher monolayer adsorption capacity of phenan-thridine relative to acridine, in agreement with the adsorption isotherm (Figure 1b) and adsorbed amount qmresults (Table
2).
On the aluminum hydroxide surface, we note broad peaks at 2−8 Å with shoulders indicative of multiple adsorption configurations, such as parallel and nonparallel to the kaolinite surface. The minima at 8.5 and 9.0 Å for acridine and phenanthridine, respectively (marked with vertical dashed lines), denote the depletion layer. The phenanthridine layer is thicker due to the larger effective size of this molecule Figure 6.Average (a) and integral gγ(r) (b) over slices with thickness 0.5 Å stacked parallel to the kaolinite surface calculated according to eqs 9 and 10, respectively. The Si and Al atom planes are set as zero on the left and right-hand sides, respectively, of the kaolinite platelet. NA: N atom site of acridine; NP: N atom site of phenanthridine.
compared to acridine. Additional adsorption occurs, as evidenced from the peaks at longer distances. These adsorption interactions, driven by strong N···H hydrogen bonding and weaker dispersion and electrostatic interactions of HAC with kaolinite as well as intermolecular interactions of HAC docked at the kaolinite surface, are representative of molecule−surface recognition. On the silicon oxide surface, the N atom sites would not adsorb, as the gγaver(r) near the surface is lower than
in bulk. In Figure 6b, the steeper slope at 2−8 Å indicates stronger adsorption on aluminum hydroxide surface in the monolayer. On the silicon oxide surface, the steeper slope is at longer distances and corresponds to bulk solvent.
In Figure 6a, we also show the monolayers of acridine and phenanthridine adsorbed on the aluminum hydroxide surface of kaolinite delimited by the monolayer boundary denoted as vertical dashed lines. The lower minimum for NAindicates that
the acridine monolayer is better delimited than the phenanthrene layer. Integration of gγaver(r) in the shaded areas
yields the monolayer loading. The monolayer loading ratio NP/
NAof 1.16 calculated by gγaver(r) integration compares favorably
to the ratio qm(phenanthridine)/qm(acridine) of 1.36 (qmvalues
from Table 2) obtained using the Langmuir isotherm analysis. Hydrogen Bonding Interactions.We determine the hydro-gen bonding sites and distances between N atoms of pyridinic HAC and H atoms of the aluminum hydroxide surface of kaolinite based on the maxima of the projections of the site distribution function gN(r) (Figure 5a). The most preferred
N···HO−Al hydrogen bond length is 1.8 Å, measured between the plane of the H atoms and the gN(r) maximum.
In Figure 7a,b, we present color maps of slices of the gN(r) of
acridine and phenanthridine at planes perpendicular to the kaolinite platelet passing through two H atoms of the aluminum hydroxide surface. On these maps, the colors range from red to green and blue as the gN(r) values range from
maxima to intermediate and minima, respectively. The gN(r)
maxima, shown as red areas at the aluminum hydroxide surface (∼1.8−2.0 Å), correspond to the most preferred positions of the pyridinic N atom sites and the intense green color corresponds to the first adsorption layer. The most preferred positions of the N atom sites are near the aluminum hydroxide H atoms, indicating hydrogen bonding as denoted by dashed white lines. Depletion layers are shown in blue color at ∼4 Å and ∼7 Å on both sides of kaolinite. We note here as well that in the case of acridine (Figure 7a), if compared to phenanthridine (Figure 7b), there is a clearer separation between the first layer and upper layers, as the acridine depletion layer on the aluminum hydroxide side at ∼7 Å is better defined than that of phenanthridine. This confirms the
results of DTGA (see Figure 2), which clearly indicate that in the case of multilayer adsorption of acridine, the mass loss occurs in two stages, showing a differentiation between the first and the upper layers. On the silicon oxide surface of kaolinite, the first adsorption layer is not defined, in accordance with the depletion observed in the gN(r) and gγaver(r) plots (Figures 5a
and 6a).
Adsorption Thermodynamics Analysis. In the 3D-RISM-KH molecular theory of solvation, the SFE ΔμsolvKH (eq 6a) is
calculated based on full statistical-mechanical sampling of all solvent configurations, including HAC and toluene. The entropy and enthalpy are calculated from the SFE at constant solvent density according to eqs 7.
In Table 3, we list the adsorption thermodynamics results for all HAC and toluene as well as N atom site contributions. The
SFE is calculated as a sum of all solvent−solute site−site interactions, including both the silicon oxide and aluminum hydroxide surfaces of the solute and all HAC sites for the solvent, unlike the site PMF shown in Figure 5b and site adsorption energies obtained based on it. Lower SFE values indicate stronger adsorption of the solvent molecule on the kaolinite platelet. All SFE are positive due to the interaction of hydrophilic kaolinite solute and hydrophobic solvents. The SFE of solvent components increases in the order phenanthridine < acridine < benzothiophene < dibenzothiophene ∼ carbazole < toluene, which is also the order of decreasing adsorption strength. This order differs from the one presented in the discussion of Figure 5 as according to eq 6a,6b the SFE is a sum over all solvent sites and all space. The two orders agree in clearly showing that pyridinic HAC adsorb the strongest. The enthalpy at 298 °C and the entropy are negative, indicating strong entropic control of HAC adsorption. The adsorption enthalpy increases in the order acridine < phenanthridine < Figure 7.Hydrogen bonds (denoted as white dashed lines) between kaolinite surface H atoms and gN(r) maxima (shown as red areas) and multiple adsorption and depletion layers of the N atom site of acridine (a) and phenanthridine on kaolinite (b). NA: N atom site of acridine. NP: N atom site of phenanthridine. The gN(r) isovalues are given in the inset. The Si and Al atom planes are set as zero on the left and right-hand sides, respectively, of the kaolinite platelet.
Table 3. Thermodynamic Analysis Results for the Kaolinite in Toluene−HAC Systemsa
solvent component Δμsolv
KH298
(kcal mol−1)
Δs (cal
mol−1K−1) (kcal molε −1)
phenanthridine 0.0205 −0.739 −0.1997 acridine 0.0236 −0.752 −0.2004 benzothiophene 0.0263 −0.518 −0.1282 dibenzothiophene 0.0292 −0.673 −0.1713 carbazole 0.0298 −0.675 −0.1714 toluene 0.0317 −0.435 −0.0981 aThe Δμ solv
KH298, Δs, and ε are the solvation free energy at 298 K and entropy and enthalpy of adsorption of HAC and toluene on kaolinite calculated using the 3D-RISM-KH theory of solvation.
dibenzothiophene ∼ carbazole < benzothiophene < toluene, which for the pyridinic HAC is in agreement with the Langmuir constant (Table 2) in showing stronger adsorption of acridine than phenanthridine. It is due to the entropic effect that the adsorption free energy of phenanthridine becomes lower at 298 K.
The 3D-SFED is calculated according to eq 6b from the 3D site total and direct correlation functions that represent the solvation structure and solute−solvent molecular repulsive cores, respectively, and characterizes the intensity of effective solvation forces in different 3D spatial regions of the solvation shells. In addition to the density distribution functions gγ(r)
that provide solvation structure (Figure 4) but present convolved information on interaction forces, the 3D-SFED explicitly characterize ensemble-averaged effective molecular recognition interactions between HAC and kaolinite. The 3D-SFED has been shown to unravel weaker and delocalized hydrophobic interactions, while gγ(r) show mainly highly
localized hydrogen bonding of hemicellulose on cellulose microfibril surfaces in plant cell walls.51
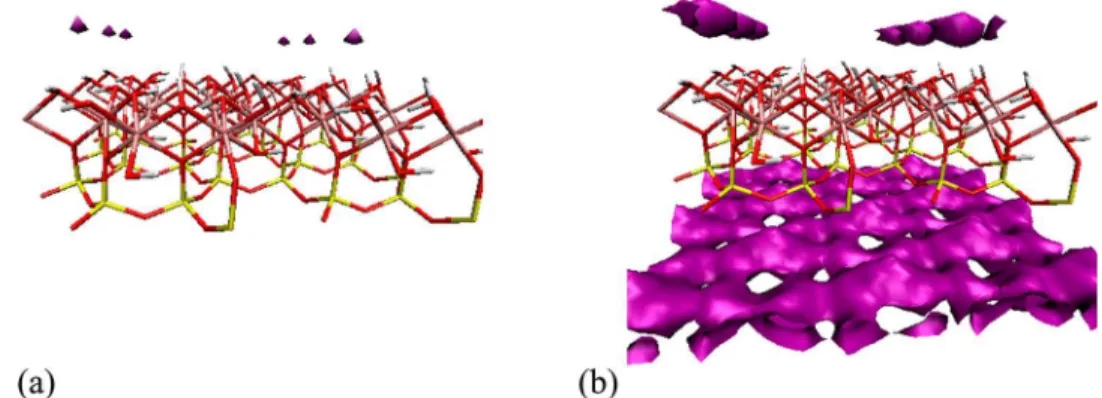
In Figure 8, we show the 3D-SFED isosurfaces with a low negative isovalue (a) and higher negative isovalue (b) for all sites of acridine around kaolinite in acridine-toluene solvent system. At low SFE isovalue, which corresponds to the strongest adsorption, the interaction is predominantly hydro-gen bonding to the aluminum hydroxide surface of kaolinite and the distributions resemble the N sites gγ(r) in Figure 4. At
higher isovalue, which corresponds to weaker adsorption, the interaction is delocalized on the silicon oxide surface of kaolinite and resembles the hydrophobic interactions shown in ref 51. The 3D-SFED maps of all HAC and toluene are qualitatively similar to that of acridine. These results indicate that HAC and toluene adsorb strongly on the aluminum hydroxide and weakly on the silicon oxide surfaces of kaolinite. This is due to the presence of positive (H atoms) and negative (O atoms) sites accessible on the aluminum hydroxide surface that favor strong molecular recognition interactions with HAC, in contrast with the rather uniform silicon oxide surface with only negatively charged O atom sites that favor weaker hydrophobic interactions with HAC.
4. CONCLUSION
We studied the adsorption of five HAC on kaolinite in toluene solvent using XRD, UV−vis absorption spectrophotometry, desorption, and TGA methods as well as the statistical-mechanical 3D-RISM-KH molecular theory of solvation. The
XRD studies indicate that HAC do not intercalate between kaolinite platelets but adsorb on the external surface of kaolinite. The spectrophotometry results show that only pyridinic HAC adsorb quantitatively on kaolinite. The adsorption kinetics and isotherm analysis highlight the stronger interaction of acridine with kaolinite compared to phenan-thridine. The isotherm analysis (Langmuir and Freundlich models) also shows that the adsorption capacity of phenan-thridine is larger than that of acridine and the phenanphenan-thridine monolayer is not homogeneous. At high concentration of pyridinic HAC, multilayer adsorption of acridine and phenanthridine on kaolinite is observed. Adsorbed pyridinic HAC can be completely desorbed using large amounts of toluene solvent.
The computational studies using the 3D-RISM-KH molec-ular theory of solvation predict the adsorption configuration and thermodynamics and provide insights into the molecular recognition between HAC and the kaolinite surface. The preferred adsorption configurations of the pyridinic HAC are parallel and at an acute angle to the kaolinite surface, the latter favoring hydrogen bonding between the aluminum hydroxide surface and pyridinic N atoms, based on 3D density distribution function gγ(r). The site effective interaction plots (PMF,
calculated from gγ(r)) show stronger adsorption of N of
pyridinic HAC followed by H of carbazole and S of thiophenic HAC. The toluene sites can effectively compete with non-hydrogen bonding sites, such as S of fused thiophenes for the kaolinite surface. Despite the more negative charge (higher basicity) of the acridine N atom, based on gγ(r) it is predicted
to adsorb slightly weaker than the phenanthridine N atom due to the lower steric accessibility of the N atom in acridine. A higher adsorption capacity of phenanthridine compared to acridine is predicted, in agreement with the TGA results, using the averaged gγ(r) function defined in our recent work.
The adsorption thermodynamics calculations based on effective solvation forces yield the adsorption SFE, enthalpy, and entropy, and show that the adsorption of HAC on kaolinite is entropy-controlled. The calculated adsorption enthalpy of acridine is slightly lower than that of phenanthridine, in agreement with the Langmuir isotherm analysis. The 3D-SFED plots predict that HAC adsorb stronger on the aluminum hydroxide surface than on the silicon oxide surface of kaolinite. The results show that HAC containing heteroatoms capable of forming hydrogen bonds with kaolinite play a major role in the adsorption of asphaltenes on kaolinite and pose challenges to bitumen extraction from oil sands.
Figure 8.3D-SFED isosurfaces of acridine showing strong and localized adsorption on the aluminum hydroxide surface with an isovalue of −0.09 (a) and weaker delocalized adsorption on the silicon oxide surface with an isovalue of −0.05 (b), calculated using the 3D-RISM-KH theory of solvation for kaolinite in acridine−toluene solvent system. Kaolinite atom colors: O - red, H - white, Al - pink, Si - yellow; acridine isosurface color: purple.
The approach presented here allows investigation of the kinetics and thermodynamics of molecular recognition between asphaltene model compounds containing several heteroatoms in different functional groups and various clays minerals relevant to bitumen extraction. Fully accounting for external conditions of solvation, temperature and density, this approach is instrumental in providing fundamental insights to help accelerate the development of nonaqueous bitumen extraction technologies.
■
ASSOCIATED CONTENT*
S Supporting InformationAdditional experimental and computational results. This material is available free of charge via the Internet at http:// pubs.acs.org
■
AUTHOR INFORMATION Corresponding Authors *E-mail: Stoyanov@ualberta.ca. *E-mail: Andriy.Kovalenko@nrc-cnrc.gc.ca. *E-mail: Christian.Detellier@uottawa.ca. NotesThe authors declare no competing financial interest.
■
ACKNOWLEDGMENTSThe authors acknowledge the financial support of the Imperial Oil − Alberta Innovates Energy and Environment Solutions Centre for Oil Sands Innovation (COSI) at the University of Alberta. In part, this work was supported by the National Institute for Nanotechnology. We thank the support staff and facility managers of the Centre for Catalysis Research and Innovation (CCRI) at the University of Ottawa for their time and support of this project. C. Detellier acknowledges the support of the Canada Foundation for Innovation (CFI) and Ontario Research Fund − Research Infrastructure (ORF-RI). S. R. Stoyanov thanks Dr. John M. Villegas for the fruitful discussions. The calculations were performed on the high performance computing facilities of WestGrid − Compute/ Calcul Canada.
■
REFERENCES(1) IEA, World Energy Outlook 2010; OECD Publishing: Paris, 2010. (2) Alboudwarej, H.; Felix, J.; Taylor, S.; Badry, R.; Bremner, C.; Brough, B.; Sheates, C.; Baker, A.; Palmer, D.; Pattison, K.; et al. Highlighting Heavy Oil. Oilfield Rev., Summer 2006, 18, 34−53.
(3) Mossop, G. D. Geology of the Athabasca Oil Sands. Science 1980,
207, 145−152.
(4) Masliyah, L.; Zhou, Z.; Xu, Z.; Czarnecki, J.; Hamza, H. Understanding Water-Based Bitumen Extraction from Athabasca Oil Sands. Can. J. Chem. Eng. 2004, 82, 628−654.
(5) Hooshiar, A.; Uhlik, P.; Ivey, D. G.; Liu, Q.; Etsell, T. H. Clay Minerals in Nonaqueous Extraction of Bitumen from Alberta Oil Sands. Part 2. Characterization of Clay Minerals. Fuel Process. Technol. 2012, 96, 183−194.
(6) Hooshiar, A.; Uhlik, P.; Liu, Q.; Etsell, T. H.; Ivey, D. G. Clay Minerals in Nonaqueous Extraction of Bitumen from Alberta Oil Sands: Part 1. Nonqueous Extraction Procedure. Fuel Process. Technol. 2012, 94, 80−85.
(7) Brough, S. A.; Riley, S. H.; McGrady, G. S.; Tanhawiriyakul, S.; Romero-Zerón, L.; Willson, C. D. Low Temperature Extraction and Upgrading of Oil Sands and Bitumen in Supercritical Fluid Mixtures.
Chem. Commun. 2010, 46, 4923−4925.
(8) Painter, P.; Williams, P.; Mannebach, E. The Recovery of Bitumen from Oil or Tar Sands Using Ionic Liquids. Energy Fuels 2010, 24, 1094−1098.
(9) Wu, J.; Dabros, T. Process for Solvent Extraction of Bitumen from Oil Sand. Energy Fuels 2012, 26, 1002−1008.
(10) Long, Y.; Dabros, T.; Hamza, H. Selective Solvent Deasphalting for Heavy Oil Emulsion Treatment. In Asphaltenes, Heavy Oils, and
Petroleomics, Mullins, O. C.; Sheu, E. Y.; Hammami, A.; Marshall, A.
G., Eds.; Springer Science and Business Media: New York, 2007; pp 511−547.
(11) Harjai, S. K.; Flury, C.; Masliyah, J.; Drelich, J.; Xu, Z. Robust Aqueous−Nonaqueous Hybrid Process for Bitumen Extraction from Mineable Athabasca Oil Sands. Energy Fuels 2012, 26, 2920−2927.
(12) Yang, Z.; Li, Q.; Hua, R.; Gray, M. R.; Chou, K. C. Competitive Adsorption of Toluene and N-Alkanes at Binary Solution/Silica Interfaces. J. Phys, Chem. C 2009, 113, 20355−20359.
(13) Gray, M. R.; Tykwinski, R. R.; Stryker, J. M.; Tan, X. Supramolecular Assembly Model for Aggregation of Petroleum Asphaltenes. Energy Fuels 2011, 25, 3125−3134.
(14) Stoyanov, S. R.; Yin, C.-X.; Gray, M. R.; Stryker, J. M.; Gusarov, S.; Kovalenko, A. Computational and Experimental Study of the Spectroscopy of Nickel(II) and Vanadyl Porphyrins in Crude Oils. J.
Phys. Chem. B 2010, 114, 2180−2188.
(15) Stoyanov, S. R.; Yin, C.-X.; Gray, M. R.; Stryker, J. M.; Gusarov, S.; Kovalenko, A. Density Functional Theory Investigation of the Effect of Axial Coordination and Annelation on the Absorption Spectroscopy of Nickel(II) and Vanadyl Porphyrins Relevant to Bitumen and Crude Oils. Can. J. Chem. 2013, 91, 872−878.
(16) Costa, L. M.; Hayaki, S.; Stoyanov, S. R.; Gusarov, S.; Tan, X.; Gray, M. R.; Stryker, J. M.; Tykwinski, R.; Carneiro, J. W. M.; Sato, H.; et al. 3D-RISM-KH Molecular Theory of Solvation and Density Functional Theory Investigation of the Role of Water in the Aggregation of Model Asphaltenes. Phys. Chem. Chem. Phys. 2012,
14, 3922−3934.
(17) Costa, L. M.; Stoyanov, S. R.; Gusarov, S.; Tan, X.; Gray, M. R.; Stryker, J. M.; Tykwinski, R.; Carneiro, J. W. M.; Seidl, P. R.; Kovalenko, A. Density Functional Theory Investigation of the Contributions of π−π Stacking and Hydrogen-Bonding Interactions to the Aggregation of Model Asphaltene Compounds. Energy Fuels 2012, 26, 2727−2735.
(18) Bish, D. L.; Johnston, C. Rietveld Refinement and Fourier-Transform Infrared Spectroscopic Study of the Dickite Structure at Low Temperature. Clays Clay Miner. 1993, 41, 297−304.
(19) Cygan, R. T.; Liang, J.-J.; Kalinichev, A. G. Molecular Models of Hydroxide, Oxyhydroxide, and Clay Phases and the Development of a General Force Field. J. Phys. Chem. B 2004, 108, 1255−1266.
(20) Mercier, P. H. J.; Patarachao, B.; Kung, J.; Kingston, D. M.; Woods, J. R.; Sparks, B. D.; Kotlyar, L. S.; Ng, S.; Moran, K.; McCracken, T. X-ray Diffraction (XRD)-Derived Processability Markers for Oil Sands Based on Clay Mineralogy and Crystallite Thickness Distributions. Energy Fuels 2008, 22, 3174−3193.
(21) Allen, B. L.; Hajek, B. F. Mineral Occurrence in Soil Environments. In Minerals in Soil Environments; Dixon, J. B., Weed, S. B., Eds.; Soil Science Society of America: Madison, WI, 1989; pp 233−236.
(22) Letaief, S.; Detellier, C. Interlayer Grafting of Glycidol (2,3-Epoxy-1-Propanol) on Kaolinite. J. Mater. Chem. 2007, 17, 1476− 1484.
(23) Lagaly, G.; Ogawa, M.; Dékany, I. Clay Mineral Organic Interactions. In Handbook of Clay Science; Bergaya, F., Theng, B. K. G., Lagaly, G., Eds.; Elsevier Ltd.: Amsterdam, 2006; pp 309−377.
(24) Tunney, J. J.; Detellier, C. Aluminosilicate Nanocomposite Materials. Poly(ethylene glycol)−Kaolinite Intercalates. Chem. Mater. 1996, 8, 927−935.
(25) Tunney, J. J.; Detellier, C. Interlamellar Covalent Grafting of Organic Units on Kaolinite. Chem. Mater. 1993, 5, 747−748.
(26) Theng, B. K. G. Formation and Properties of Clay−Polymer