DOE/ET/34022-1
MITNE-234 MIT-EL-80-032
ANALYSIS OF STRATEGIES FOR IMPROVING URANIUM UTILIZATION IN PRESSURIZED WATER REACTORS
by
Joseph A. Sefcik Michael J. Driscoll
David D. Lanning
DOE Contract No. DE-ACO2-79ET34022 ( Nuclear Engin-eering Department Report No. MITNE-234, Energy Laboratory Report MIT-EL-80-032). January, 1981.
DOE/ET/340: - i
ANALYSIS OF STRATEGIES FOR IMPROVING URANIUM UTILIZATION IN PRESSURIZED WATER REACTORS
by
Joseph A. Sefcik Michael J. Driscoll
David D. Lanning
Annual Technical Progress Report/Principal Topical Report For FY 1980
Department of Nuclear Engineering and
Energy Laboratory
MASSACHUSETTS INSTITUTE OF TECHNOLOGY Cambridge, Massachusetts 02139
Sponsored by
U.S. Department of Energy Division of Energy Technology
NOTICE
This report was prepared as an account of work sponsored by the United States Government. Neither the United States Department of Energy, nor any of their employees, nor any of their contractors, subcontractors, or their employees, makes any warranty, express or implied, or assumes any legLa liability or responsibility for the accuracy, completeness or usefulness of any information, apparatus, product or prr cess disclosed, or represents that its use would not in-fringe privately owned rights.
Printed in the United States of America Available from
National Technical Information Service U.S. Department of Commerce
5285 Port Royal Road Springfield, VA 22151
USDOE LWR TECHNOLOGY PROGRAI IMPROVED URANIuN U UILIZAull N SPECIALIZEU UISTRIUTI1UN4 LIST
Mr. John R. Jensen
Mechanical Engi neeri ng Divi si on
American Electric Power Service Corp. 2 Broadway
New York, NY 1uOU4 Mr. Benjamin L. Dow, Jr.
Arkansas Power and Light Company P. 0. Box 551
Little Rock, AR
72203-Mr. J. Tulenko
BaDcocK & Wilcox Company Nuclear Power beneration Uiv. P. O. Box 1260
.Lynchburg, VA 24505 Mr. Thomas A. Coleman
Babcock & Wilcox Coimpany Nuclear Power beneration Div. P.O. Box 126u
Lynchburg, VA 24505 Mr. M. S. Freshley
Battelle-Paci ii c Nortnwest LaDoratory Battelle Boulevara
P.O. Box 999
Richland, WA 99352 Mr. C. L. Monr, Manager Nuclear Fuels
Battelle-Pacific Northwest Laboratory P.O. Box 999
Richland, WA 99352 Dr. W. A. Weinreich
Bettis Atomic Power Laboratory (W) Box 79
;West Mifflin, PA 15122 -lr. R. N. Duncan
Comoustion Engineering, Inc. 1000 Prospect Hill Road Windsor, CT 06U95 Mr. W. M. Kiefer
Coimmonwealth Edison Company P. 0. Box 767
Chicago, IL U0690
Mr. D. O'Boyle
Coanonwealth Edison Co. P. 0. Box 767
Chicago, IL 60690 Dr. Min L. Lee
Chief Nuclear Engineer
Consolidated Eoison Company of New York, Inc.
4 Irving Place New York, NY 1U003 Mr. F. W. Buckman
Consumers Power Company 212 W. Michigan Avenue Jackson, MI 49201 Mr.
D.
B. Wehmeyer Detroit Edison Co. 2000 Second Avenue Detroit, MI 48226 Mr. J. D. Kortheuer Duke Power Company P. 0. Box 33189 Charlotte, NC 28242 Mr. T. SneadDuke Power Company P. 0. Box 33189 Charlotte, NC 28242 Mr. R. G. Snipes Duke Power Company P.O. Box 33189
Charlotte, NC 2b242 Mr. Floyd E. Gelhaus
Electric Power Research Inst. P. . Box 10412
Palo Alto, CA 94303 Dr. J. T. A. Roberts
Electric Power Research Inst. P. 0. Box 10412
Palo Alto, CA 94303 Mr. C. E. Crouthamel
Exxon Nuclear Company, Inc.
2595 George Washington Way Richland, WA 993bZ
Dr. G. A. Sofer
Nuclear Fuels Engineering Exxon Nuclear Company,. Inc. 2101 Horn Rapids Road
Richland, WA 99352 Dr. K. N. Woods
2595 George Washington Way Exxon Nuclear Company, Inc. Richland, WA 99352
Mr. J. R. Tomonto
Florida Power & Light Company P. 0. Box 3100
Miami, FL 331Q1 Dr. S. Armijo
General Electric Company Nuclear Energy Divisi.on 175 Curtner Avenue San Jose, CA 95125
Dr. H. W. Schadler, Manager Metallurgy Laboratory
General Electric Company
Research and Development Center P. 0. Box 8
Schenectady, NY 12301' Mr. Gordon Bond
GPU Service Corp. 260 Cherry Hill Road Parsippany, NJ 07054 Mr. D. J. Groetch
Manager, Advanced Development Activity Knolls Atomic Power Laboratory
Box 1072, F3, 12
Schenectady, NY 12301 Mr. William J. Tunney
Long Island Lighting Company 175 E. Old Country Road .Hicksville, NY 11801
Mr. S. W. Wilczek, Jr. Niagara Mohawk Power Corp.
300 Erie Boulevard West
Syracuse, NY 13202 Mr. John Hallam
Manager, Computer Engineering Quadrex Corporation
1700 Dell Avenue -Campbell, CA 95008
Mr.-I. Spiewak
Oak Ridge National Laboratory P. 0. Box X, Building 9201-3 Oak Ridge, TN 37830
Mr. G. F. Daebeler
Philadelphia Electric Company 2301 Market Street
P. 0. Box 8699
Philadelphia, PA 19101 Mr. 8. H. Koske
Energy Conversion Engineer .Public Service Company of
New Mexico P.O. Box 2267
Albuquerque, NM 87103 Mr. Kashmiri L. Mahna Public Service Electric
.and Gas Company
P.O. Box 570, Room 3347 Newark, NJ 07101
Mr. Richard R. O'Laughlin Nuclear Fuel Manager
Public Service Company of Indiana 1000 East Main Street
Dr. William V. Johnston
Chief, Fuel Behavior Research Branch Division of Reactor Safety Research U.S. Nuclear Regulatory Commission Washington, D.C. 20555
Mr. D. L. Larkin
Washington Public Power Supply System
P. O. Box 968
Richland, WA 99352 Mr. R. S. Miller
Westinghouse Electric Corp. Nuclear Fuel Division
Box 355
Pittsburgh, PA 15230 Dr. Joseph K. Gasper
Manager, Reactor and Computer Technical Services
Omaha Public Power District 1623 Harney
Omaha, NE 68102 Dr. U. Decher
Combustion Engineering 1000 Prospect Hill Road P.O. Box 500
Windsor, CT 06095 Mr. Martin L. Bowling
Virginia Electric and Power Company Seventh and Franklin Streets
P.O. Box 1194 Richmond, VA 23209 Professor A. Sesonske School of Engineering Purdue University West Lafayette, IN 47907 Mr. Philip D. Brown
Nuclear Engineer, Fuel -Cycle Services 409 Krystal Building Chattanooga, TN 37401 Mr. Daniel D. Whitney
Sacramento Municipal Utility District 6201 S. Street
Box 15830
Sacramento, CA 95813 Mr. Michael Driscoll
Massachusetts Institute of Technology 138 Albany Street
Cambridge, MA 02139 Dr. J. C. Turnage
Yankee Atomic Electric Company 20 Turnpike Road
Westborough, MA 01581 Mr. Peter A. Aucoin
Nuclear Assurance Corporation 24 Executive Park West
Atlanta, GA 30329
-Mr. Howard L. Sobel
Section Head, Nuclear Materials and Fuel Management Section American Electric Power Service
Corporation 2 Broadway
V. Uotinen
Mr. T. D. Chikalla, Manager Project Manageren
Ceramics and Graphite The Babcock & Wilcox Co
Battelle-Pacific Northwest Laboratory The Babcock ilox Co.
P.O. Box 999 P.O. ynchBox 1260 24505
Richland, WA 99352 ynchburg, VA 24505
Mr. R. L. Horowitz
General Electric - Research and Development Corporate
P.O. Box 8
Schenectady, NY 12345 Dr. Elwyn Roberts
Manager, Irradiation Testing
Westinghouse Electric Corporation P.O. Box 355
Pittsburgh, PA 15230
R. Crowther
Project Manager.
General Electric Company .
175 Curtner Company
San Jose, California 95125
Dr. Peter M.- Lang, Chief LWR Branch
Division bf Nuclear Power Development
U.S. .Dept. of Energy, Mail Stop B-107
Washington, D.C. 20545 (5 copies)
N.L. Shapiro
M4anager, Advanced Design Projects Combustion. Engineering, Inc.
1000 Prospect' Hill Road
Windsor, CT... 06095 W.L. Orr
Manager of Product Development Support
Nuclear Fuel. Division
Westinghouse Electric Corp.
P.O. Box 355
Pittsburgh, PA 15230
Dr. Richard B" Stout
Nuclear Fuels Engineering Dept. Exxon Nuclear
2101 Horn Rapids Road Richland, WA 99352
ABSTRACT
Systematic procedures have been devised and applied to evaluate core design and fuel management strategies for improving uranium util-ization in Pressurized Water Reactors operated on a once-through fuel cycle. A principal objective has been the evaluation of suggested im-provements on a self-consistent basis, allowing for concurrent changes in dependent variables such as core leakage and batch power histories, which might otherwise obscure the sometimes subtle effects of interest. Two levels of evaluation have been devised: a simple but accurate anal-ytic model based on the observed linear variations in assembly reactiv-ity as a function of burnup; and a numerical approach, embodied in a computer program, which relaxes this assumption and combines it with empirical prescriptions for assembly (or batch) power as a function of reactivity, and core leakage as a function of peripheral assembly power. State-of-the-art physics methods, such as PDQ-7, were used to verify and supplement these techniques.
These methods have been applied to evaluate several suggested im-provements: (1) axial blankets of low-enriched or depleted uranium,
and of beryllium metal, (2) radial natural uranium blankets, (3) low-leakage radial fuel management, (4) high burnup fuels, (5) optimized H/U atom ratio, (6) annular fuel, and (7) mechanical spectral shift
(i.e. variable fuel-to-moderator ratio) concepts such as those involv-ing pin pullinvolv-ing and bundle reconstitution.
The potential savings in uranium requirements compared to current practice were found to be as follows: (1) O0-3%, (2) negative, (3) 2-3%; possibly 5%, (4) "15%, (5) 0-2.5%, (6) no inherent advantage,
(7) 10%. Total savings should not be assumed to be additive; and thermal/hydraulic or mechanical design restrictions may preclude full realization of some of the potential improvements.
ACKNOWLEDGEMENTS
The work presented in this report has been performed primarily by the principal author, Joseph A. Sefcik, who has submitted substantially the same report in partial
ful-fillment of the requirements for the Ph.D degree in Nuclea Engineering at M.I.T.
The present work was supported by a Department of Energy (DOE) contract administered through the M.I.T.
Energy Laboratory. Computer calculations were carried out at the M.I.T. Information Processing Center and the Labor-atory for Nuclear Science.
The authors would like to acknowledge the cooperation of Dr. Edward Pilat and employees of the Yankee Atomic El-ectric Company in facilitating the acquisition of descrip-tive data from publicly available documentation on the Maine Yankee Reactor. The information in this report cit-ed as deriving from "Maine Yankee", however, should not be considered as representing that actual system in its cur-rent or projected operating configuration, but as an ideal-ization thereof. In particular, the results so identified in this report have not been either reviewed or approved by the Yankee organization.
The majorityiof the typing was ably handled by Ms. Maureen Walsh, with the assistence of Ms. Carolyn Rose and Ms. Christal Whelan.
TABLE OF CONTENTS Page ABSTRACT 2 DEDICATION ACKNOWLEDGEMENTS TABLE OF CONTENTS LIST OF FIGURES 10 LIST OF TABLES 14
CHAPTER 1 BACKGROUND AND PREVIOUS RESEARCH
1.1 Introduction 17
1.2 Background 18
1.3 Research Objectives 26
1.4 Organization of Report 27
CHAPTER 2 COMPUTER METHODS
2.1 Introduction 30
2.2 The LEOPARD Code 33
2.3 The CHIMP Code 36
2.4 The HAMMER System 36
2.5 PDQ-7, HARMONY 40
2.6 Chapter Summary 41
CHAPTER 3 A POWER WEIGHTING ALGORITHM FOR ESTIMATION OF SYSTEM REACTIVITY
3.1 Introduction 42
3.2 The Linear Reactivity Model 43
3.3 Power Weighting 49
3.4 Accounting for Leakage 56
3.5 An Application of the Advanced Linear
Reac-tivity Model: Low-Leakage Fuel Management 64
3.6 Chapter Summary 68
CHAPTER 4 A POWER SHARING ALGORITHM FOR PWR FUEL BUNDLES
4.1 Introduction 70
4.2 "Group-and-One-Half" Model 71 4.3 Results of Two-Bundle Calculations 72
4.4 Whole Core Results 78
4.5 The ALARM (A-Linear Advanced Reactivity Model) 88
Table of Contents - Cont.
Pacp, CHAPTER 5 AXIAL FUEL MANAGEMENT
5.1 Introduction 9
5.2 Analytical Considerations 94
5.3 Axial Blanket Results 99
5.4 Uranium Utilization for Assemblies with Axial
Blankets 10'
5.5 Chapter Summary 11
CHAPTER 6 RADIAL FUEL MANAGEMENT
6.1 Introduction 1
6.2 Extended Cycle Length/Burnup 116 6.3 Low-Leakage Extended Cycle Fuel Management 124
6.4 Natural Uranium Blankets 124
6.5 Chapter Summary 127
CHAPTER 7 FUEL-TO-MODERATOR RATIO EFFECTS
7.1 Introduction 137
7.2 Optimization of V /Vm for Fixed Lattice
Designs 13:
7.3 Annular Fuel 146
7.4 Variable Hydrogen/Uranium Atom Ratio 154 7.5 H/U Atom Ratio Changes During Refueling 161
7.6 Chapter Summary 176
CHAPTER 8 SUMMARY, CONCLUSIONS AND RECOMMENDATIONS
8.1 Introduction 180
8.2 Background and Research Objectives 181
8.3 Methodology Development 181
8.4 Axial Blankets 189
8.5 Radial Blankets 189
8.6 Low-Leakage Fuel Management 190
8.7 Higher Burnups 190
8.8 Optimization of the H/U Atom Ratio 190
8.9 Annular Fuel 191
8.10 Mechanical Spectral Shift 191
Table of Contents - Cont.
Page
APPENDICES
A - DESIGN PARAMETERS FOR MAINE YANKEE REACTOR 198 B - SPECIAL USES AND MODIFICATIONS OF THE LEOPARD
PROGRAM 204
C - OPTIMIZATION OF CYCLE SCHEDULE INDEX 207
D - DEVELOPMENT OF THE 6 FORMULATION 210
E - ALARM CODE INPUT SPECIFICATIONS, LISTING, AND
SAMPLE PROBLEM 213
F - CYCLE SCHEDULE INDICES FOR NON-INTEGER BATCH
NUMBERS 230
G - MATHEMATICAL EQUIVALENCE OF COOLANT VOID SPEC-TRAL SHIFT WITH SPECSPEC-TRAL SHIFT BY PIN-PULLING
AND BUNDLE RECONSTITUTION 234
LIST OF FIGURES
Figure Number Title Page
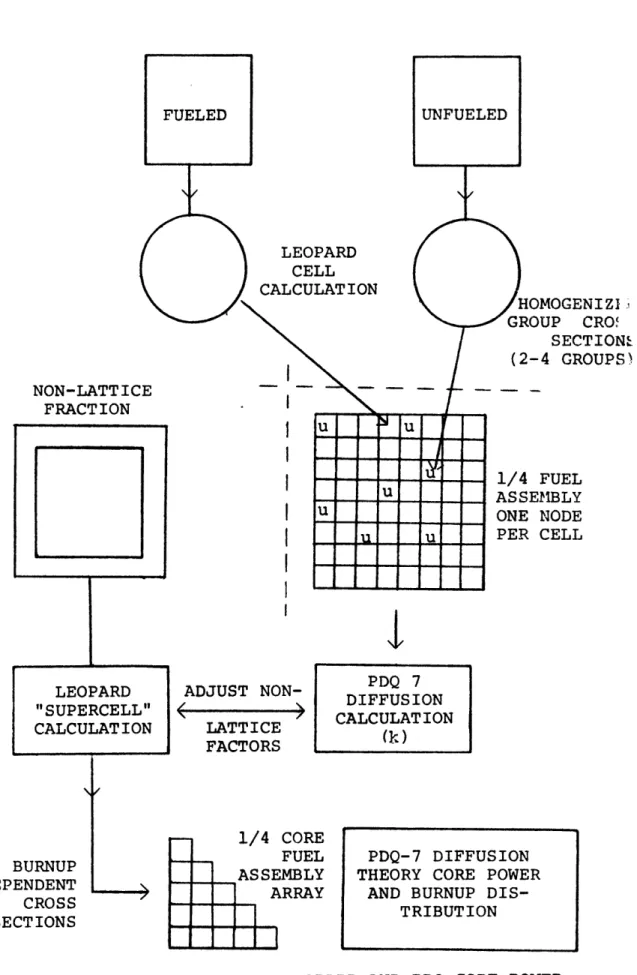
2.1 Flow Chart for LEOPARD and PDQ 32 Core Power Calculations
2.2 LEOPARD Unit Cell Geometry 35 2.3 HAMMER Unit Cell Geometry 39 3.1 k and p. as a Function of Burn- 45
up For a 3.0 W/O U-235 Maine Yankee Supercell
3.2 Reactivity vs. Burnup Curves For 47 Five Batch Fuel Management Scheme
With 60000 MWD/MT Target Burnup
3.3 Average Energy Release Per Fission 51 Neutron (K/v) As a Function of Fuel Burnup
3.4 Geometry For Two-Bundle PDQ-7 Power 53 Split Problem
3.5 Axial Leakage Reactivity vs. Power 59 Fraction in Outermost 6 Inches of
the Fueled Region in a Maine Yankee Reactor Assembly
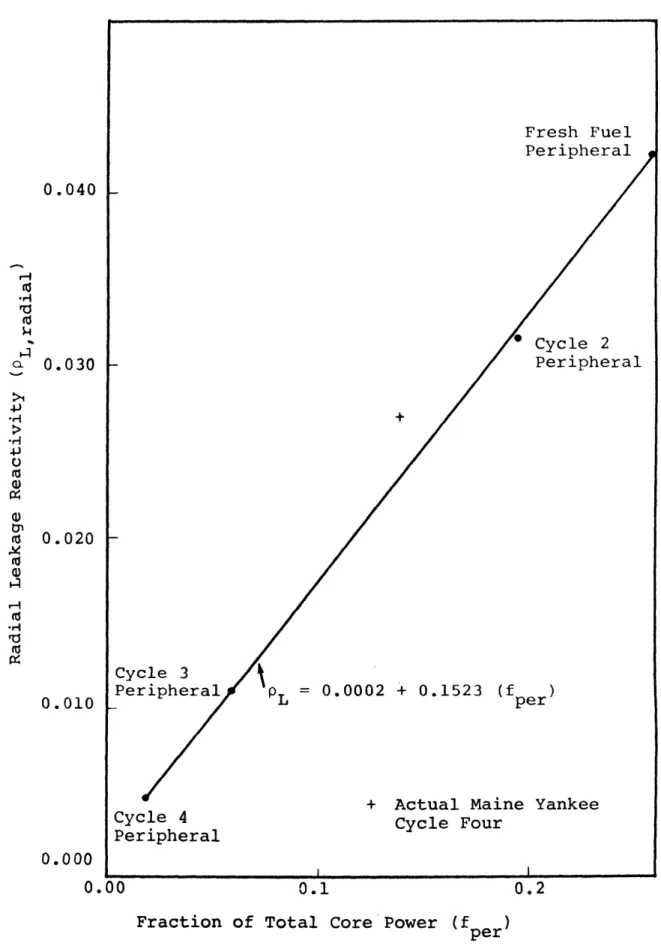
3.6 Radial Leakaqe Reactivity For M.Y. 61 Reactor vs. Fraction of Core Power Generated in Peripheral Assemblies 3.7 C-E System 80T M Core Design (241 63
Fuel Assemblies)
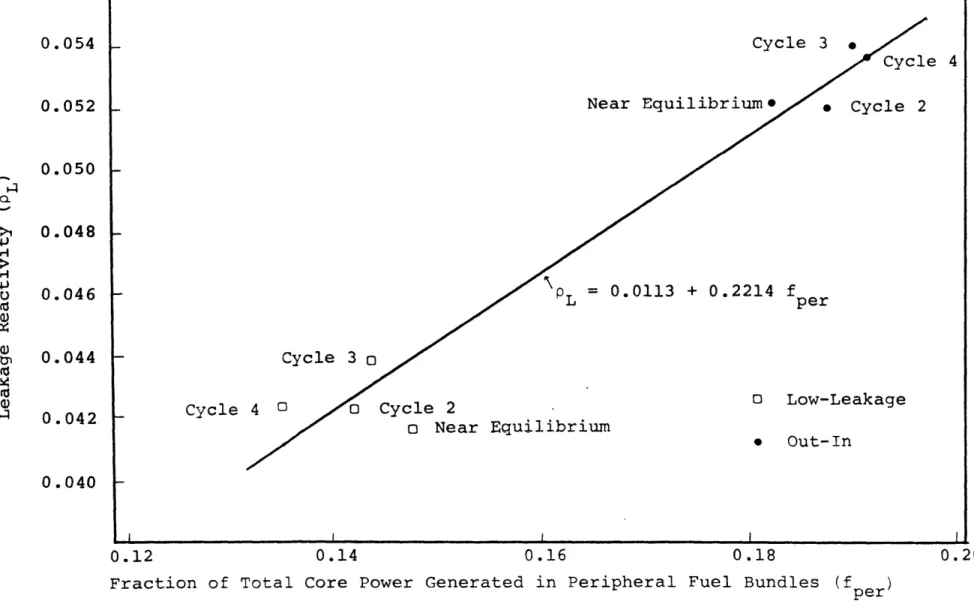
3.8 Lea ge Reactivity For C-E System 65 -80 Reactor vs. Fraction of Pow-er GenPow-erated in PPow-eriphPow-eral Assem-blies (Five Batch Fuel Management, High Burnup)
4.1 Assembly Configuration For Deter- 75 mination of
e
For PWR CoreInter-ior Conditions
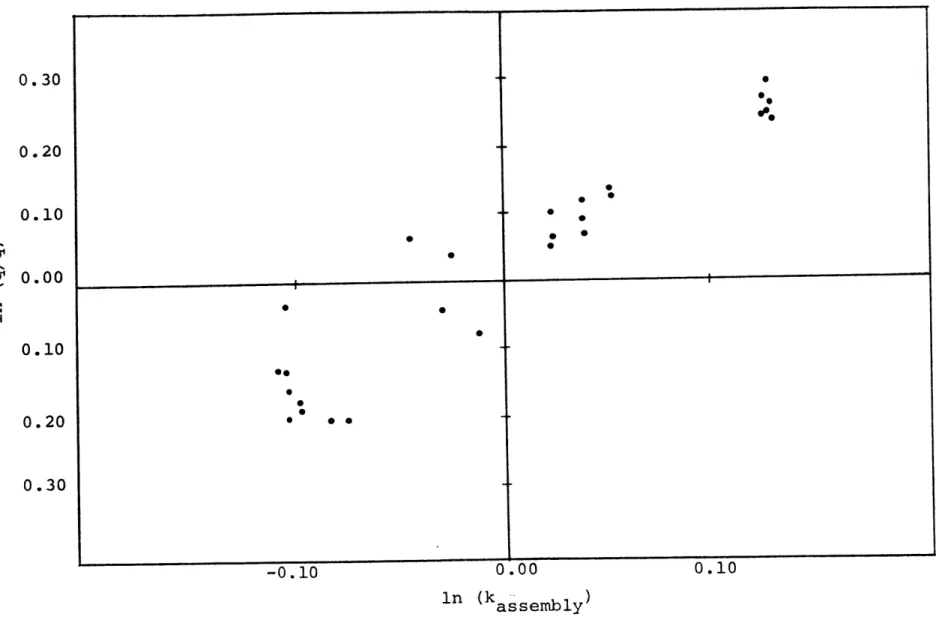
4.2 Nine-Bundle Power - k, Correlation 77 4.3 Assembly Power vs. k Plot For In- 79
LIST OF FIGURES
Figure Number Title Page
4.4 Assembly Power vs. k Plot For In- 80 terior Assemblies in the Maine
Yankee Cycle 4 Reload Design
4.5 Power-Multiplication Factor Reg- 82 ression Line for Maine Yankee Fuel Batches
4.6 Power-Multiplication Factor Reg- 83 ression Line for C-E System-8 0TM
Batches
4.7 Core Map for Maine Yankee Cycle 84 4 Redesign
4.8 Core Map for Combustion Engineer- 85 ing System-80TM Core
4.9 Flowchart for Alarm Code Methodol- 90 ogy
5.1 Cases Considered for Improving Ur- 100 anium Utilization Via Axial Fuel
Management
5.2 Axial Leakage Reactivity (p , ax- 109 ial) vs. Time at Effective
Pull
Power For Reference and Blanket Cases
6.1 Reactivity of Maine Yankee Reactor 119 Assemblies For Various Enrichments 6.2 Slope of Reactivity vs. Burnup 120
Curve For Maine Yankee Reactor Assemblies For Various Enrichments 6.3 Uranium Utilization vs. Enrichment 123
For the Maine Yankee Reactor
6.4 Relative Whole Core Uranium Re- 131 quirement For Natural Uranium
Blanket Case Relative to Spent Fuel Blanket Case
7.1 Initial Extrapolated Reactivity 138 For Maine Yankee Assemblies As
LIST OF FIGURES
Figure Number Title Page
7.2 Slope of Reactivity vs. Burnup 139 Curve For Maine Yankee
Assem-blies as Pitch is Varied (£=3.0 w/o) 7.3 Uranium Utilization vs. H/U Atom 141
Ratio For Maine Yankee Assemblies as Pitch is Varied (e=3.0 w/o)
7.4 Initial Extrapolated Reactivity 142 For Maine Yankee Assemblies as
Lattice Pitch is Varied (c=4.34 w/o) 7.5 Slope of Reactivity vs. Burnup 143
Curve For Maine Yankee Assemblies as Pitch is Varied (e=4.34 w/o)
7.6 Uranium Utilization For Maine Yan 144 kee Assemblies as Pitch is Varied
(e=4.34 w/o)
7.7 Uranium Utilization vs. H/U Atom 147 Ratio For Lattices with
Equiva-lent Resonance Integrals
7.8 Change in Resonance Integral as a 149 Function of Reduction in Heavy
Metal Content (B-l)
7.9 Relative U-238 Resonance Integral 153 For Various Changes in Pin
Dia-meter and Fuel Density
7.10 Lattice Spectral Shift Scheme Using 162 Pin-Pulling and Bundle Reconstitu-tion
7.11 Lattice Spectral Shift Scheme Us- 163 ing "Void" Inclusion in Cycle One
Assemblies
7.12 Reactivity vs. Burnup For Conven- 166 tional Three Batch Fuel Management
7.13 Reactivity vs. Burnup For Concept 167 1 Mechanical Spectral Shift
7.14 Reactivity vs. Burnup For Concept 168 2 Mechanical Spectral Shift
LIST OF FIGURES
Figure Number Title Page
8.1 km and po As a Function of Burn- 182 up For a 3.0 W/O U-235 Maine
Yankee Supercell
8.2 Radial Leakage Reactivity For M.Y 185 Reactor vs. Fraction of Core
Pow-er GenPow-erated in PPow-eriphPow-eral Assem-blies
C.1 Behavior of CSI Relative to the 209 Constraint Equation (fl + f2=1. 0 )
14 LIST OF TABLES
Table Number Title Page
1.1 Nuclear Power Plants (Operable, 19 under construction, or on order
(>30 MWe) as of 6/30/80)
1.2 Representative List of Some Strat- 20 egies For Fuel Conservation in a
PWR
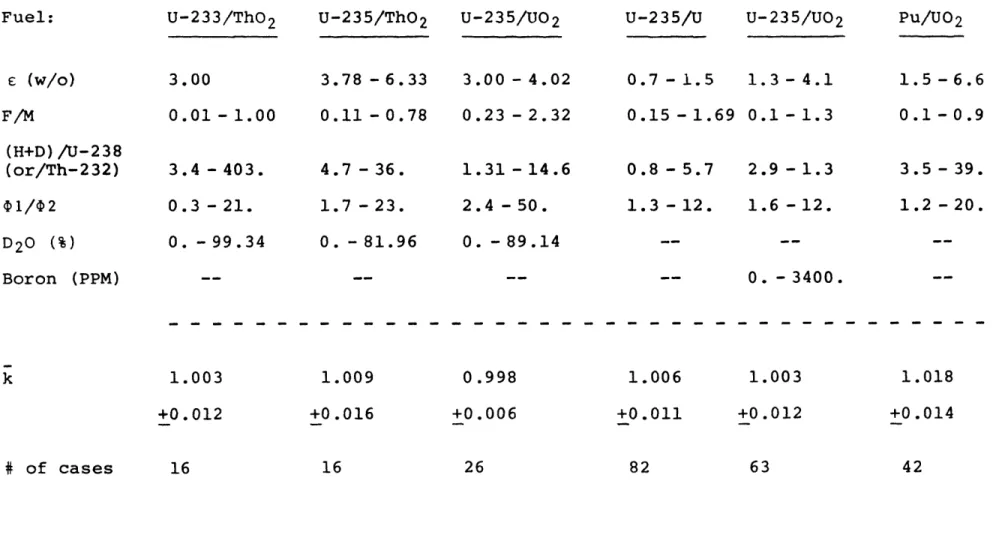
2.1 Summary of Benchmark Comparisons 37 3.1 Comparison of Computed (PDQ-7) 52
and Power-Weighted Values of k
For a Two-Bundle Problem (Fig. 3.4) 3.2 Effects of Source Shape on Leakage 58
Reactivity
3.3 Equilibrium Cycle Power Fractions 67 For 5 Batch Out-In and
Low-Leak-age Fuel Managment Schemes
4.1 Actual and Estimated Power Frac- 73 tions For Two Bundle, Zero
Cur-rent Boundary Condition Problems
4.2 Cases Analyzed to Determine Power 76 Sharing Among PWR Bundles
4.3 Features of the Alarm Code 89 5.1 Reference Case Burnup Results 102 5.2 Natural Uranium Blanketed Assembly 103
Burnup Results, 3.0 W/O Core Re-gion
5.3 Natural Uranium Blanketed Assembly 104 Burnup Results 3.218 W/O Core
Re-gion
5.4 Depleted Uranium Blanketed Assem- 106 bly Burnup Results 3.218 W/O Core
Region
5.5 Beryllium Metal Blanketed Assem- 107 bly Burnup Results, 3.218 W/O Core Region
15
LIST OF TABLES
Table Number Title Page
5.6 Feed-To-Product Ratios and Rela- 110 tive Natural Uranium Usage For
Axial Fuel Management
Case-5.7 Relative Uranium Requirements For 111 Normalized Power Output For
Var-ious Blanket Strategies
5.8 Maximum/Average Power At BOL For 113 Blanketed Cases Compared to the
Reference Case
6.1 Comparison of Extended Cycle and 125 Low-Leakage Extended Cycle Fuel
Management with Current, Three-Batch, Out-In Fuel Management
6.2 Relative Uranium Requirements For 126 Extended Cycle, Low-Leakage
Ex-tended Cycle, and Reference Case
7.1 Evaluation of Annular Fuel 150 7.2 Effects of Fuel Density Chanqes 151
On Uranium Utilization For High Burnup Fuel (E=4.34 w/o U-235)
7.3 Estimated Theoretical Benefits 158 of Optimized Spectral Shift
Con-trol As a Function of the Number of Batches
7.4 Relative Uranium Feed Requirements 176 For Various Concept 1 Strategies
(Btran = 8500 MWD/MTP)
7.5 Relative Uranium Feed Requirements 177 For Various Concept 2 Strategies
(Btran = 8500 MWD/MTP)
8.1 Potential Uranium Savings From De- 193 sign and Fuel Management Changes
in Current PWR Cores
Input Instructions 215
16
LIST OF TABLES
Table Number Title Page
E.2 Alarm Code Listing 217
E.3 Sample Problem Input Cards 223
17
CHAPTER 1
BACKGROUND AND PREVIOUS RESEARCH
1.1 INTRODUCTION
The efficient use of fuel resources is an important goal for any energy technology. This objective has been assigned higher priority in the past several years with respect to natural uranium consumption by light water re-actors (LWR's). Several reasons have motivated this at-tention: the rising price of uranium on the domestic and world market; the deceleration of the breeder development/ deployment program; and the deferral of plans to recycle plutonium in LWR's. The deferral of recycle is largely due to concerns over linkage to weapons proliferation.
The work described in this report was undertaken un-der the LWR Technology Program for Improved Uranium Util-ization sponsored by the United States Department of Ener-gy. It continues earlier MIT efforts along the same gen-eral lines undertaken as part of the Nonproliferation Al-ternative Systems Assessment Program (NASAP) (N-1) which in turn, provided input to the International Nuclear Fuel Cycle Evaluation (INFCE) (I-1). The general goal of the present work has been to develop, test, and apply self-consistent methods for the evaluation of improvements in core design and fuel management strategy in pressurized
water reactors as they apply to increasing the energy generated per unit mass of natural uranium mined.
The MIT effort has focused on pressurized water re-actors (PWRs) because they comprise nearly 2/3 of the
nuc-lear power plant capacity operable, under construction, or on order in the U.S. and over 1/2 of the worldwide nuc-lear capacity (see Table 1.1). However, it is expected that much of the work can be readily extended to the boil-ing water reactors (BWRs), which account for most of the remaining capacity. Similarly, the emphasis has been on concepts which can be retro-fit into current system designs, operating on the once-thru fuel cycle, since only
items in this category have credible prospects for making a substantial impact through rapid and widespread deploy-ment.
1.2 BACKGROUND
Several major studies have been completed over the past few years which delineate the potential uranium sav-ings which can be achieved in pressurized water reactors. Table 1.2 summarizes some of the uranium saving techni-ques which have been identified, the potential savings, and the time interval needed for their introduction. The uranium-conserving strategies range from very simple to very complicated, and even though large savings are avail-able in some cases (e.g. through reprocessing), the econ-omics and politics of the situation may dictate against their use. It should also be noted that the various
sav-TABLE 1.1 NUCLEAR POWER PLANTS
(Operable, under construction, or on order (>30 MWe) as of 6/30/80)
TYPE (COOL/MOD.) U.S. WORLD
PWR ' 113 (63.5%) 280 (53.2%) BWR LWR (H20) 61 (34.3%) 119 (22.6%) LWBR PHWR (CANDU) 36 LWCHWR (DO) 2 HWBLWR 2 (8.0%) GCHWR 2 GCR 36 AGR 15 LGR 1 23 (14.4%) GRAPHITE HTGR 1 1 THTR 1 LMFBR (Na) 1 8 TOTAL UNITS 178 526 TOTAL GWE 171 400 TOTAL OPERABLE 74 229 GWE OPERABLE 54 125
KEY: PWR = Pressurized Water Reactor BWR = Boiling Water Reactor
PHWR = Pressurized Heavy Water Moderated and Cooled Reactor
LWBR = Light Water Breeder Reactor
LWCHWR = Light Water Cooled, Heavy Water Moderated Reactor
HWBLWR = Heavy Water Moderated Boiling Light Water Cooled Reactor
GCHWR = Gas Cooled Heavy Water Moderated Reactor GCR = Gas Cooled Reactor
AGR = Advanced Gas-Cooled Reactor
LGR = Light Water Cooled, Graphite Moderated Reactor HTGR = High Temperature Gas Cooled Reactor
THTR = Thorium High Temperature Reactor
LMFBR = Liquid Metal Cooled Fast Breeder Reactor Source: Reference (N-2)
TABLE 1.2 REPRESENTATIVE IN A PWR Percent Saving Tactic (approx.) Reprocessing Increased Number of Batches Increased Discharge Burnup Reduced Radial Leakage Axial Blankets Reduced Axial Leakage Routine Coastdown 20-30
LIST OF SOME STRATEGIES FOR FUEL CONSERVATION
Time to Introduce 10 years References G-2 5 years F-1,D-1, S-2 10 5-15 years 5-7 1-3 1-2 5-15 3-5 years 3-5 years 5-10 years 1-2 years F-l,D-l, S-2 ,M-2 D-1,S-2, S-3 K-1,D-1, S-2 K- 1 F-1,D-1, M-1,S-2, M-2,D-2 L-1 Comments Economic uncertainties
Politically undesirable under current conditions
Constant discharge burnup would require more frequent refueling and would decrease capacity factor
Must assess materials problems
Commonly known as low-leakage fuel management7 adverse power peaking is created
Leads to power peaking problems Requires use of zirconium core support structures
High savings if coastdown is done to economic breakeven
Variable Fuel to Moderator Ratio
5-15 10 years R-1 Ore savings depend on strategy
used (e.g. pin pulling); may lead to thermal-hydraulic prob-lems- F& reassemblv recui-d
TABLE 1.2 (Cont.) Percent Saving Tactic (approx.) D20 Spectral Shift Optimized Fixed Fuel/Moderator ratio (e.g. change lattice pitch, pin diameter or use annular fuel)
10-15 -2-3 Time to Introduce 10 years References C-1,G-1 5 years R-1,B-1 Comments
Poison control is reduced; D20 is expensive and losses are significant
Applicability depends on spe-cific reactor design
ings may not be additive when combined into a single de-sign.
Current pressurized water reactors operate on a cycle which is one year in length, following which they are shut down for about six weeks for refueling. The mean dis-charge burnup is about 33000 MWD/MT. Every year one third
of the core is replaced with fresh fuel which has an en-richment of about 3 w/o U-235. The fuel design
character-istics and operating conditions of a reference PWR (Maine Yankee) are listed in Appendix A.
Increasing the number of staggered in-core batches results in a decrease in the cycle reactivity swing, which decreases the uranium enrichment required to meet the same energy output. The increased number of batches
necessi-tates an increase in the number of refuelings in a given calendar period. An increased refueling frequency de-creases plant capacity factor and thereby adversely
af-fects the cost of electricity.
If the number of batches were held constant and the reload enrichment raised, the discharge burnup would be increased and the time between refuelings would be in-creased. The higher reactivity of the fresher batches permits the older batches to be driven deeper along the reactivity vs. burnup curve. Current pressurized water reactor owners are seriously considering switching to 18 month cycles with discharge burnups in the vicinity
23
of 36000 MWD/MT. The attendant increase in capacity fac-tor helps reduce the cost of the generated electricity.
Employing both higher discharge burnup and an in-creased number of batches (e.g. 60000 MWD/MT, five batches) would reduce yellowcake consumption by 20%. There are potential difficulties, however, in
implement-ing extended burnup, which are primarily related to the structural components of the fuel. The cladding faces increased corrosion on the water side during the long residence times and an increased internal pressure from
fission product gas buildup. In-reactor experiments are under way at this time to assess the consequences of driv-ing fuel to higher burnup.
Axial and radial leakage can account for neutron losses as high as four or five percent of total neutron production. Various schemes have been proposed for min-imizing the losses. "Low-leakage" fuel management is a strategy whereby the fresh fuel is not loaded on the core periphery (as has been customary), but is instead scatter-ed among older fuel in the core interior, while once or twice burned fuel is loaded on the periphery. The re-duced peripheral power results in lower neutron losses, but higher radial power peaking factors throughout the reactor's burnup cycle.
The use of axial blankets of natural uranium or en-richment zoning in the axial direction can reduce axial leakage but, once again, power peaking factors are
in-creased. Neutron losses can be reduced without adversely affecting radial and axial peaking factors if stainless steel core support structures and/or core shrouds and bar-rels are replaced with zirconium structures.
Coastdown is a technique which relies on a reduction of moderator and fuel temperatures of the reactor, by re-ducing the coolant temperature and/or reactor power level
to insert positive reactivity and thereby extend the length of the operating cycle. The electrical power output of the reactor is decreased in a ramp or stepwise fashion
until the coastdown is terminated. The length of the coast-down period can be optimized to maximize the overall econ-omics of the utility's electrical grid. Coastdown always reduces U3 08 consumption. Under economically optimum con-ditions the reduction typically ranges from 5 to 8 percent. Coastdown to economic breakeven generates larger savings, around 12 percent.
The D20 spectral shift concept uses a mixture of
light and heavy water to change the neutron spectrum during the reactor's operating cycle, substantially reducing boron control requirements. At the beginning of the cycle, a 50% H 20, 50% D 20 mixture is introduced into the reactor and the harder (more epithermal) spectrum increases absorption in U-238 which decreases reactivity in the short term but in-creases Pu-239 production. H20 is added during the cycle to provide the reactivity needed to compensate for burnup.
In-25
decreased plutonium production and decreased losses to boron control poisons account for the improved neutron economy and increased fuel efficiency. D20 is expensive, however,
and losses can be quite costly. The separation of the H20 and the D20 may be more difficult than a utility would de-sire. Increased tritium production would complicate plant operation and maintenance. Hence, overall economics may preclude the use of this scheme.
Variable fuel-to-moderator ratio schemes seek to ac-complish the same spectral shift as the D20-H2 0 method
but by mechanical means. The fuel begins in a tight pitch configuration with a lower reactivity than normal and an increased conversion ratio. At end-of-cycle, the rods are moved in some fashion to create a "wetter" configuration and in this manner, reactivity is inserted. Several of these schemes call for mechanical movement of the fuel, or fuel bundle disassembly and reassembly. The uranium savings are dependent upon whether the mechanical manip-ulation is done before or after the refueling (as will be discussed in a later chapter of this report). The ther-mal-hydraulic problems of both the fresh and reconstituted
lattices involved in these schemes for producing a mechanical spectral shift may be severe.
The lattices of current generation pressurized water reactors were optimized under different constraints than those which apply at present: ore was cheaper and recycle
was assumed. As a result, the lattices may be slightly "dry" relative to the optimum fuel to moderator ratio for a high-burnup once-through cycle. A slight wettening of the lattice (through the use of annular fuel, reduced fuel density, etc.) may permit better fuel utilization on the once-thru cycle without violating safety criteria such as the need for a negative moderator temperature coefficient. 1.3 RESEARCH OBJECTIVES
To progress beyond the obvious gains obtained from in-creasing burnup and the number of fuel batches, it is gen-erally believed that a large number of small, incremental improvements must be accumulated. This puts a severe strain on computational methodology: simple methods are too crude to discern the often subtle effects at issue and the use of full-fledged state-of-the-art computer capabil-ities involves far too much detail to be economically just-ified and, more importantly, admits so much increased flex-ibility that one can never be sure that comparisons are be-ing made on an "all-else-bebe-ing-equal" basis. Apparently innocuous simplifications or constraints can often perturb the comparison to the point where the effect of interest can be obscured.
This fundamental dilemma became clear early in the course of the present work, and led to the identification
of the first major subtask -- the development of a simple
27
in core design and fuel management on a consistent basis and in a transparent manner. As developed, the model re-lies heavily on an analytically improved version of the linear reactivity model of core behavior, and on heuristic models benchmarked against more detailed computer results.
The second major focus of the present work has been on the evaluation of a number of contemporary candidate changes which have been suggested as ways to improve
ur-anium utilization: the use of annular fuel pellets, axial and radial blankets, low leakage fuel management, and
var-iable fuel-to-moderator-ratio concepts in several guises, such as pin-pulling and bundle reconstitution.
1.4 ORGANIZATION OF REPORT
The work reported here is organized as follows. Chapter two provides an outline of the computer meth-ods used in this research. The calculational models used in these programs are also be discussed along with their applicability and limitations.
Chapter three contains an introduction to the linear reactivity model of core behavior. The model is extended to include the effects of leakage and power sharing as they occur in actual LWR fuel management schemes. An optimization process is developed and used to demonstrate that spatial and temporal criteria exist which can improve uranium ore use.
In chapter four, the use of simplified "group-and-one-half" methods and some heuristic observations of com-puter-calculated reactor core maps leads to the develop-ment of simplified power sharing and core leakage algor-ithms for inclusion in the methodology developed in the previous chapter.
Chapter five reports on the application of the sub-ject methods to axial fuel management. The basic analytic relationships and static bundle results are examined to determine the best approach for more sophisticated com-puter calculations. Several of the most promising candi-dates are examined in detail.
In chapter six the methodology is applied to discern the relative advantages of low-leakage fuel management and natural uranium radial blankets. Several core con-figurations are examined.
Chapter seven deals with variable fuel-to-moderator ratio concepts. The analytical additions and extensions of the advanced linear reactivity model necessary to cal-culate uranium savings for a wide range of options are developed. In addition, some modifications to the LEO-PARD computer program are required to adequately model the spectral shift concepts. Optimization criteria are presented and a final design proposed, one that is con-sistent with current perceptions of the thermal-hydraulic limitations.
Chapter eight summarizes the present work: the
methods development effort and the several applications. The potential for the application of the same approach to other uranium saving strategies not analyzed here is dis-cussed.
Several appendices are included to provide detail and supporting evidence and to document the computer pro-gram used to implement the screening of the various fuel design options.
CHAPTER 2 COMPUTER METHODS
2.1 INTRODUCTION
A central problem of nuclear reactor fuel management ic the accurate determination of reaction rates and isotopic d tributions at all points in space and time. The developmer-of large and complex computer programs has simplified this task greatly. It is possible, in principle, to calculate the flux and isotopic concentrations in a nuclear reactor by using hundreds of energy groups, thousands of spatial points, and a multitude of time increments. However, practical con-siderations such as the size of today's computer memories and the costs associated with running long programs inter-vene to impose various constraints.
The evolution of computer programs in the nuclear fuel management sector reflects a continuing reduction of conser-vatigms imposed by safety requirements by a trade-off betwee cost and accuracy. Fortunately, acceptably accurate answers can be obtained without the necessity of complete pointwise modeling of the core. Thus, available "state-of-the-art" programs could be used to provide a sound foundation for the recent work.
The computer codes used in this research (primarily LEOPARD and PDQ-7) are employed either individually or in combination to make comparisons between various fuel
manage-31
ment strategies.. The codes have been benchmarked against experimental data, and for certain regions of interest can be considered quite accurate.
Since there are several references which describe the methods associated with LWR fuel management (A-1,D-3,H-l,D-3) we can be brief in regard to generalities and concentrate on specifics in the exposition which follows. Even more germane, previous workers at MIT: namely, Garel (G-2), Fujita (F-1), and Correa (C-2) have used these same codes and documented both the general features of the programs and their experience with their use for applications similar to those of present
concern.
The methodology of LWR fuel management can be thought of as two coupled, yet distinct, phases: the neutron spec-trum calculation and the neutron diffusion calculation as depicted in Figure 2.1. In the pressurized water reactor, the broad features of the ambient neutron spectrum (e.g. fast, epithermal, thermal regimes) within the confines of a given
fuel assembly depend primarily on burnup status. Thus, for a given fuel design at a specific burnup, the few-group cross-sections and the concentrations of the isotopes, along with their attendant neutron spectrum, may be considered to be "state or state vector functions" of the burnup.
In non-fuel regions the cross-sections will not vary appreciably over the life of the fuel. In common practice, the cross-sections for both types of regions are generally "collapsed" into only two groups (fast and thermal) from the
LEOPARD CELL CALCULATION HOMOGENIZI GROUP CRO SECTIONS (2-4 GROUPS) NON-LATTICE FRACTION
u
u
Il
1/4 FUELLu
ASSEMBLY ONE NODE u PER CELLLEOPARD ADJUST NON- PDQ 7
DIFFUSION "SUPERCELL" CALCULATIONF CALCULATION LATTICE FACTORS 1/4 CORE FUEL PDQ-7 DIFFUSION
EBURNUP ASSEMBLY THEORY CORE POWER
DEPENDENT ARRAY AND BURNUP
DIS-CTOS TRIBUTION
SECTIONS
FIG. 2.1 FLOW CHART FOR LEOPARD AND PDQ CORE POWER CALCULATIONS
several hundred energy groups used in the unit cell spec-trum calculation.
The burnup achieved at each point in the reactor de-pends on the local neutron flux level, and hence on local and near-neighborhood power levels. The flux level is determined by solving the spatial finite-difference equa-tions (using the two-group spectrum) over a given time
per-iod. At each burnup time step the fine group spectrum cal-culation of the unit fuel cell is used to provide the
col-lapsed two-group cross-sections used by the spatial calcu-lation and the spatial flux shape is solved for again. The new flux levels are then applied once again to deplete the isotopes appropriately at each point. The process is con-tinued in a successive fashion until the target energy pro-duction is achieved.
2.2 The LEOPARD Code (B-2)
The LEOPARD code calculates the spectrum for a "unit fuel cell" consisting of fuel, gap, cladding, moderator, and, in some cases, an "extra" region representing fuel assembly structure. In addition, neutron cross-sections can be calculated for unfueled regions. The cross-sections for the EPRI-LEOPARD version used in the present work are obtained from ENDF/B-IV data sets.
Material compositions, number densities, geometry, tem-peratures and pressures are input parameters to the code. A "zero-dimensional" (homogenized) calculation is performed to
determine the spectrum. An input buckling can be included to account for global leakage effects. In the thermal re-gime (En <0.625 eV) 172 energy groups are calculated over a
Wigner-Wilkins spectrum using a SOFOCATE-type treatment (A-2), and disadvantage factors are calculated by a modifi-cation of the ABH method (A-3).
The fast spectrum calculation (in 54 groups) uses the self-consistent B-1 approximation in the MUFT treatment (B-The resonance parameters are calculated using the procedures described by Strawbridge and Barry (S-4).
The few group cross-sections (2-4 groups) generated by LEOPARD apply to a properly "homogenized" cell and hence can be input directly into coarse spatial mesh calculations.
The cross-section sets used in this research are either fast and thermal, or fast and thermal mixed number density
(MND) (B-4). The MND model uses neutron activation contin-uity as a boundary condition rather than flux contincontin-uity. The thermal (En < 0.625 eV) values of Ea and Ef are averaged over a Wigner-Wilkins spectrum,whereas the thermal value of the diffusion coefficient, D, is averaged over Maxwellian spectrum.
The LEOPARD unit cell geometry is shown in Fig. 2.2. At the beginning of each time step, the neutron spectrum is recomputed and isotopic depletion during a time step is based on this spectrum. Boron concentration can be varied as a function of time, as can the D20/H20 ratio to model spectral
35 Moderator Extra Region Region Clad \ Region Pellet Region
shift effects. A fission product scale factor can be adjusted to allow for the effects of variation in uranium or plutonium isotopic content. A discussion of some of the characteristics of the LEOPARD results (and some salient operational points) is included in Appendix B.
Correa (C-2) has benchmarked EPRI-LEOPARD (with its ENDF/B-IV based cross sections) at MIT. Whereas the primai
emphasis of the calculations was tight pitch U-233/ThO2 and Pu/ThO2 cores, twenty-six U-235/UO2 lattices were exam-ined. The average k value for the critical experiments and the range of parameters investigated is shown in Table 2.1.
2.3 The CHIMP Code
The large number of flux-weighted microscopic cross-sections produced by LEOPARD at each time step are processed by the CHIMP code, which was developed by the Yankee Atomic Electric Company (C-2). The LEOPARD output at each time step can be routed directly to cards, tape, or disk and this data can be directly manipulated by the CHIMP code to prepare cross
section sets usable by PDQ-7, the spatial depletion code used in this research and described later in this chapter.
2.4 The HAMMER System (S-5)
The HAMMER system is a set of linked reactor physics programs for the calculation of infinite lattice parameters using multigroup transport theory, and composite reactor
TABLE 2.1 SUMMARY OF BENCHMARK Fuel: U-233/ThO 2 E (w/o) 3.00 F/M (H+D)/U-238 (or/Th-232) c1/¢2 D20 (%) 0.01 - 1.00 3.4 - 403. 0.3 -21. 0. - 99.34 U-235/ThO 2 3.78 -6.33 0.11 -0.78 4.7 - 36. 1.7 -23. 0. - 81.96 U-235/U0 2 3.00 - 4.02 0.23 - 2.32 1.31 -14.6 2.4 -50. 0. - 89.14 U-235/U 0.7 - 1.5 0.15 -1.69 0.8 -5.7 1.3 -12. U-235/U02 1.3-4.1 0.1-1.3 2.9 -1.3 1.6 -12. Pu/U02 1.5-6.6 0.1 -0.9 3.5 - 39. 1.2 -20. Boron (PPM) 1.003 +0.012 # of cases 1.009 +0.016 16 0.998 +0.006 26 1.006 +0.011 82 0. - 3400. 1.003 +0.012 63 *Reference C-2 1.018 +0.014 42 COMPARISONS
parameters by few group diffusion theory. In this research, only the infinite lattice calculations were utilized. The relevant unit cell geometry is shown in Figure 2.3. The difference between this method of calculation and the LEOPAe methodology is the inclusion of spatial transport calcula-tions to treat the unit cell geometry. In addition, in the HAMMER system most heavy metal isotopes are self-shielded whereas LEOPARD only self-shields the most abundant heavy
isotope. This is quite important, for example, in the analy-sis of mixed thorium-uranium unit cell configurations.
Two components of the HAMMER program library are of particular interest. The THERMOS program (H-2) performs a multigroup calculation of the thermal flux distribution
(En<.625 eV)by using integral transport theory. Unlike LEOPARD, the assumption of space-energy separability is not made. THERMOS uses an integral form of the transport equa-tion to calculate the spatially dependent thermal neutron
spectrum in a cell characterized by one-dimensional symmetry (D-3).
The HAMLET program performs a multigroup spatial calcu-lation of the flux in the energy range from 0.625 eV to
10 MeV. Collision probabilities are calculated under the assumption of cosine currents crossing region boundaries and the energy spectrum during moderation is calculated as
Moderator
Regions
Pellet Regions
2.5 PDQ-7, HARMONY
The PDQ-7 code (C-3, H-3) is designed to perform the spatial diffusion calculation in one, two, or three dimen-sions. It has been used widely by the nuclear industry for the licensing of reload cores (A-4, A-1). In this research, two energy groups are used, whereas, as many as five energy groups can be handled by the program. Solutions to the eigenvalue equation can be obtained in rectangular, cylin-drical, spherical, or hexagonal geometry. Zero flux or zero current boundary conditions are admissible.
The multigroup diffusion equation is solved by discret-izing the energy variable and finite-differencing the spa-tial variable over a variable or constant mesh size.
The one dimensional group equations are solved by Gauss elimination, and the two dimensional equations are solved by using a single-line cyclic Chebyshev semi-iterative tech-nique. A block Gauss-Seidel procedure is used in three
dimensions. In the present work, however, three dimensional PDQ-7 analyses were not performed.
The actual depletion chain manipulation and cross-section data management is performed by the HARMONY system
(B-5). The depletion chains are user inputs and the cross-section tables are obtained from the LEOPARD code after appropriate massaging by the CHIMP code.
The fluxes are normalized based on the power level in-put by the user. The cross-sections are fitted to the
concentrations of the isotopes with time via a high order polynomial. At the end of each depletion time step, the PDQ-7 code solves for the spatial flux shape and these values of the flux levels are used in the following time step. The depletion can be done on a "point" or "block" basis. Various options available in the code and used in this research will be discussed as the need arises.
2.6 Chapter Summary
In this chapter the computer methods used in the pre-sent research have been outlined. An accurate determination of the neutron spectrum and the spatial flux shape is essen-tial for the determination of uranium consumption. The sug-gested improvements in core design and fuel management which have to be evaluated involve perturbations of the neutron spectrum, and the arrangement of fuel in patterns which gen-erate flux shapes quite different from those encountered in current designs. Hence we will routinely fall back upon
state-of-the art,well-benchmarked methods to provide a solid base upon which to build further analyses.
CHAPTER 3
A POWER WEIGHTING ALGORITHM FOR ESTIMATION OF SYSTEM REACTIVITY
3.1 Introduction
First approximations to nuclear fuel management problems are often made using models in which either
reactivity, p, (or multiplication factor, k) vary linearl (or quadratically) with burnup [G-3, N-3, S-6, S-71.
In this chapter a pragmatic case will be made for the use of p versus burnup as opposed to k. versus burnup. An analysis will be carried out to demonstrate that the reactivity of fuel bundles in nuclear reactors should be weighted not merely by their mass or volume fractions, but rather by their power fractions. The linear reactivity model is extended to include these effects, and computer-generated results are analyzed to verify the analytical models.
Further extension of the linear reactivity model is made to account for core leakage. This extension is also checked and found to be consistent with more detailed computer studies. Finally, an illustrative example is presented, showing the application of the model to dis-cern the differences between uranium utilization in the
43
3.2 The Linear Reactivity Model
The time-dependent evolution of the reactor or re-gion-wise eigenvalue is an extremely useful integral mea-sure of the neutronic status of the reactor fuel. Many researchers in the field of PWR fuel management have made good use of the empirical observation that the plot of eigenvalue versus burnup is approximately linear [G-3, N-3].
It is not widely recognized, however, that reactiv-ity is a considerably more linear function of burnup than the eigenvalue (or k), that is:
k- 1
P= = p -AB (3.1)
The Maine Yankee supercell reference lattice (see Appendix A) was analyzed using LEOPARD, for enrichment variations ranging from 1.5 w/o U-235 to 4.34 w/o U-235. Linear least squares curve-fits of k. versus burnup over the range 150-50,000 MWD/MT gave an average coefficient of determination (R2) of 0.9898, whereas linear fits of
p. versus burnup gave an average R2 value of 0.995 (i.e., in the latter case only 0.5% of the variance is not
accounted for by the correlation!)
In a one-batch PWR core the excess reactivity at the beginning of the cycle is balanced by the presence
of the soluble boron control absorber in the moderator. As the excess reactivity of the core decreases due to
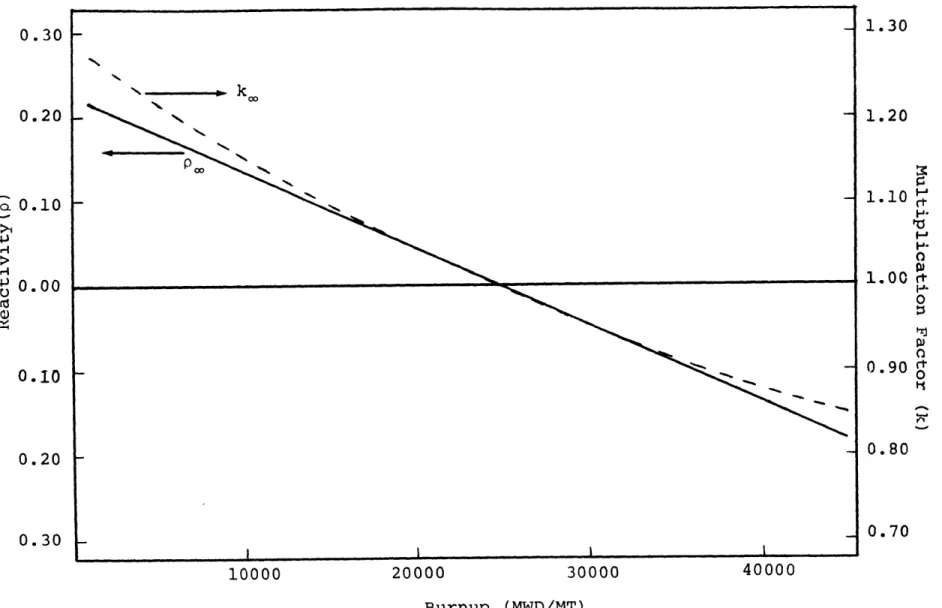
fuel depletion and fission product buildup, the boron is slowly withdrawn, until at end-of-cycle the excess reactivity of the core medium is equal to the fraction of neutrons that are lost to leakage. Plots of k, and 0~ vs. burnup for a 3.0 w/o U-235 lattice (Maine Yankee
supercell) are shown in Fig. 3.1.
In the simplest version of the linear reactivity model (leakage effects not included) the reactivity, p, decreases linearly with burnup, and for one-batch
irrad-iation the EOC burnup is given by:
B1 -- (3.2)
Typical values for a 3.0 w/o U-235 enriched PWR lattice are:
po = 0.20
A = 0.91 x10 5 (MD/MT)
B1 = 22,000 MWD/MT
In an N-batch steady-state core, at the end of the
reactor cycle the freshest batch is burned to Bdischarge/N , the next oldest batch to 2 Bdischarge /N, etc. The mean
reactivity of the mixture is typically estimated by simple arithmetic averaging of the EOC reactivity of each batch:
0.30 1.30 0.20 - k 1.20 -; 0.10 110 1 od 0.00 1.00 as O -090~ 0.10 * o 0.20 0.80 0.30 0.70 10000 20000 30000 40000 Burnup (MWD/MT)
FIG. 3.1 k AND oo AS A FUNCTION OF BURNUP FOR A 3.0 W/O U-235 MAINE YANKEE SUPERCELL
P= P,N P2 Po,N 1 AB SAB dis 2 AB dis N PN o,N - ABdis 1 N 1 NP N (N+1) N i oNo N 2N ABdis i=l (3.3)
Thus, the reload reactivity needed to achieve a dis-charge burnup of B1 is:
N+1 N+1
Po,l = 2N-AB1 IN o, n (3.4)
If, instead, the reload reactivity is kept the same, then a higher burnup can be achieved:
2N
B = ( ) B (3.5)
N N+1 1
When the oldest batch is replaced by fresh fuel we can repeat the averaging process to find the BOC reac-tivity:
0.30 0.20 0.10 >1 4J 7.25 w/( -v. 0.00 4-3 0.10 -4.34 w/i 0.20 -4.34 w/i batches boron) 10000 20000 30000 40000 50000 60000 Burnup (MWD/MT)
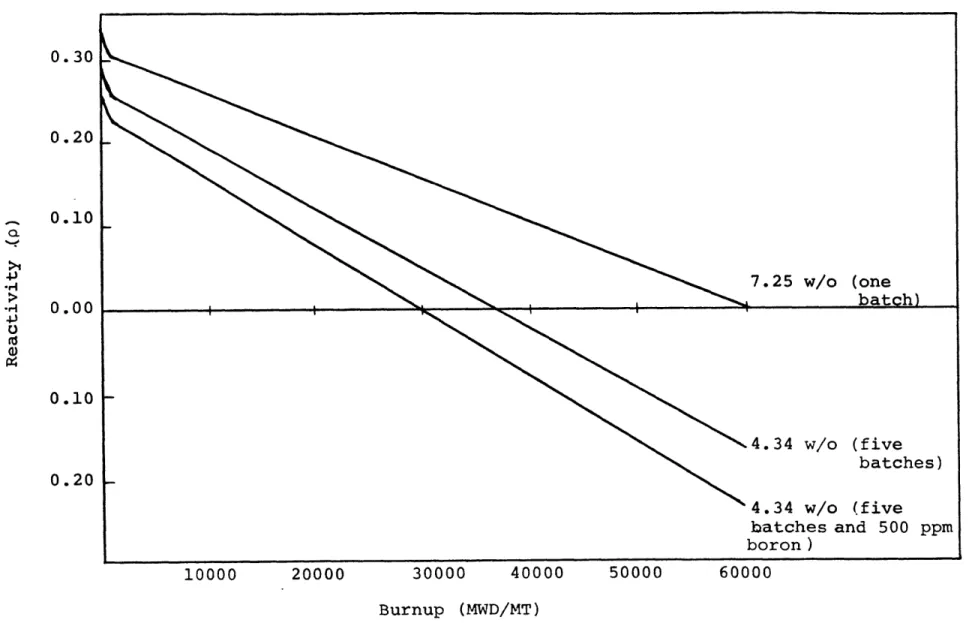
FIG. 3.2 REACTIVITY VS. BURNUP CURVES FOR FIVE BATCH FUEL MANAGEMENT SCHEME WITH 60000 MWD/MT TARGET BURNUP
48 1 o= ,N ABABdi s P2 = Po,N N PN o,N - ABdis P p NP AB di- - 1) (3.6) Ni=l N P o N dis 2N
Hence the cycle reactivity swing (PBOC - PEOC) is given by:
1 2
P 2 (3.7)
c,N N o,1 = Nl Po,N
Figure 3.2 illustrates an application of the linear reac-tivity model (LRM) methodology. A 7.0 w/o U-235 enriched PWR lattice is depleted until p = 0 at 60000 MWD/MT, the target burnup for one-batch fuel management. The reload reactivity is then determined using Eq. 3.4 such that the new reload reactivity corresponds to the anticipated
use of five fuel batches. If the slopes of both curves were the same, the required enrichment would be easily calculated; however, the lower enrichment cores have a steeper p versus B slope, so that a higher than might be anticipated enrichment (here 4.34 w/o U-235) is re-quired to reach criticality at EOC with the fifth and final batch at a discharge burnup of 60000 MWD/MT.
In the third curve, a fixed amount of boron is added to the lattice such that f Bd i s p(B) dB = 0, i.e, the net excess of neutrons above the p = 0 line is balanced by the net deficit of neutrons below the p = 0 line. The fixed amount of boron is the reactor cycle-average bor-on cbor-oncentratibor-on. Note in the figure that except for the
sudden drop of reactivity during the first 150 MWD/MT (on account of the buildup of xenon and samarium fission product poisons to their equilibrium levels) the curves are very linear over the full range of burnup.
Several implicit assumptions are present in the lin-ear reactivity model, as usually applied, which restricts its usefulness for the purpose of this research; namely, fixed batch size, equal power sharing among batches, fail-ure to account for leakage from the core, and treating the burnup slope as a constant over the entire range of burn-up. A relaxation of these conditions is clearly desirable. 3.3 Power Weighting
In a large reactor with negligible leakage and N fuel regions, the eigenvalue equation can be written as:
kE (1) (1) + V (2) (2) (N) (N)
S+ E +...+ (N)(N)
Ea( 1) (1)+ Ea (2) (2)+...+ E (N) (N) (3.'0)
(i) (1)
where ) and a are the neutron production and
f a
th
neutron destruction cross-sections in the i region, respectively. This equation can be rewritten:
k = (3.9)
(y ) (2) (2) (N) (N)
+ + +
k ( ) k (N)
Rearranging the terms gives:
1 _ q(1) (N)
S-
+ + (3.10)
k () k 00(N)
sys k k
where k (i) is the infinite medium multiplication factor of the it h region and q(i) is the fission neutron
produc-tion fracproduc-tion in region i:
q ) N (3.11)
i=1
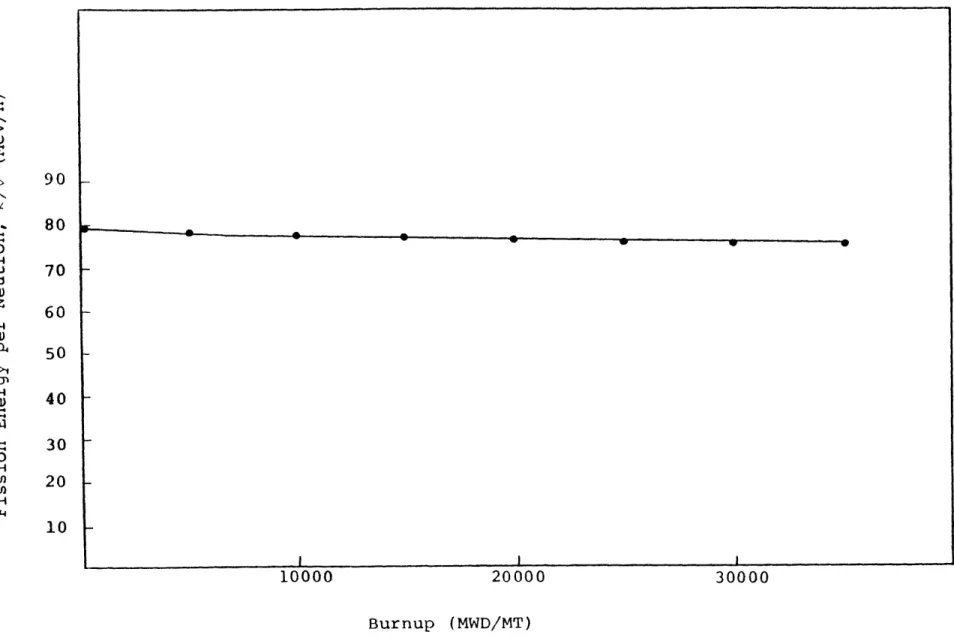
In a pressurized water reactor, the value of K/V (the
ratio of the average energy released per fission to the average number of neutrons released per fission) varies slightly with burnup, as shown in Fig. 3.3. Nevertheless
> 90 80 0 4J 70 60 n 0 50 S40 -30 O .r-4 Em 20 10 10000 20000 30000 Burnup (MWD/MT)
FIG. 3.3 AVERAGE ENERGY RELEASE PER FISSION NEUTRON (K/) AS A FUNCTION
TABLE 3.1 COMPARISON OF COMPUTED (PDQ-7) AND POWER-WEIGHTED VALUES OF k FOR A TWO-BUNDLE PROBLEM (FIG. 3.4)
k 1 1.128962 1.128962 1.128962 1.128962 1.073943 1.073943 0.900117 0.900117 k2 1.073943 1.000420 0.900117 0.805563 0.805563 1.000420 1.000420 0.805563 2 fi p i=1 1.103352 1.075070 1.046842 1.028687 0.985596 1.040755 0.957598 0.860263 k (PDQ-7) 1.103167 1.074255 1.044636 1.024873 0.983145 1.040527 0.957212 0.859973 Ak 0.00018r 0.00081 0.00220 0.003814 0.002451 0.000228 0.000386 0.000290
20.8 cms
/ /1/ / / / / / / / / / / / / / /
/ / /
/kZ k2
Zero-Current Boundary Condition
FIG. 3.4 GEOMETRY FOR TWO-BUNDLE PDQ-7 POWER SPLIT PROBLEM
if we approximate q(i)by the thermal power fraction, f., reasonable accuracy results. Equation 3.11 then becomes:
N
k - f(3.12)
sys i=1 k. 1
Table 3.1 shows the results of a two-bundle, zero-current boundary condition, PDQ-7 problem where the km values of the bundles have been varied over a wide range. The dif-ferences between the eigenvalues calculated using Eq 3.12 and the eigenvalues computed by PDQ-7 are very small. The worst case occurs when the difference between k, and k2 is the largest, and even in this case, the error is less than 0.4%. Thus, the errors associated with using an aver-age value of K/V do not appear prohibitive.
Since p = 1 -1/k, Eq 3.12 can be rewritten as:
N
sys =
j
fiPi (3.13)i=l
This formula indicates that the correct algorithm for react-ivity combination in a PWR core is a power-weighting scheme.
The implications of power weighting become more ap-parent when the reactivity balance is calculated. For an N-batch steady-state core, assuming that the power frac-tions remain constant over a given cycle:
1 o - ABdis fl 2 = Po - ABdis (fl + f2 ) N o - ABdis (f + f2 + " + fN) (3.14) At end of cycle N p = 0 = fi i (3.15) i=l from which N N S= 0 = - ABdij= fi f (3.16) or B = (3.17) dis AN N A fi f
The double summation in the denominator, which we will designate as the "cycle schedule index", accounts for
the effect of burnup schedule (the sequence of fi), or alternatively, the effect of a non-uniform core power distribution (since the fi apply to one batch over its N in-core cycles, or all batches in-core during
a representative cycle). Note that this effect is
not included in the simplest version of the linear react-ivity model. As will be shown, the lower burnup associated with uniform fi degrades uranium utilization by a
3.4 Accounting for Leakage
In any finite reactor the neutron leakage is an impor-tant factor in the determination of system reactivity,
hence sustainable burnup and uranium utilization. In a normal PWR operated with an out-in fuel shuffling strategy, roughly 3% to 4% of the neutrons are lost via leakage to, and absorption in, the regions surrounding the core (grids, core barrel, thermal shields, etc.).
An approximate treatment of leakage effects can be developed by considering the fast group leakage as a
func-tion of source shape. The plane geometry (or large radius cylinder) flux kernel (flux at x due to a source at x') is given by:
M (x-x)
(X(-x')= 2D exp M (3.18)
and the neutron current can be written as:
J = -D d- exp (3.19)
Consider a fuel region of total length 2H with a symmetric source shape about the origin. The fraction of neutrons which leak out the end of the region (the leakage reactivity loss) is:
H H S (H-x) S(x) dx J(x,x') S(x) dx
f
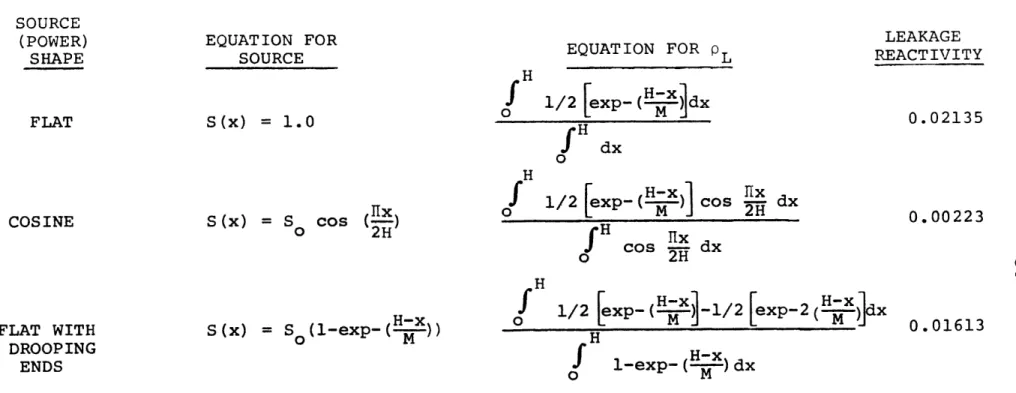
exp M o0 fH H S(x) dx S(x) dx (3.20)There are three source shapes which are of immediate
interest with respect to the behavior of pL as a function of source shape; namely, flat (S(x) = So), cosine (S(x) = So cos -), and flat interior with drooping ends
(S(x) = S (1-exo (H-x)) The correspondina solutions
o M
of the leakage reactivity equations are shown in Table 3.2. In a PWR the source shape is cosine in the axial
direction at beginning of life and flat with drooping ends at end of life. Examination of the kernel equations in-dicates that the leakage effect is most prominent in
the last few diffusion lengths of the fuel material, that is, most of the neutron loss originates in fuel regions within two or three migration lengths of the core
peri-phery. Since this is the case, axial and radial leakage should be correlated with the power (source) in the peri-pheral core regions. Figure 3.5 shows the axial leakage reactivity loss plotted as a function of the power in the outermost 6 inches of a Maine Yankee fuel assembly in which the last six inches of the fuel have been replaced with various enrichments from 0.2 w/o U-235 to 1.0 w/o U-235, and with depleted and natural uranium fuel blankets, at various stages of assembly burnup. The calculations were made in two groups using PDQ-7 and PDQ-7-HARMONY. The
correlation is linear, with an R2 value of 0.98445. The non-zero intercept can be interpreted as a relative indica-tion of leakage due to neutrons born in the interior.
TABLE 3.2 EFFECTS OF SOURCE SHAPE ON LEAKAGE REACTIVITY EQUATION FOR SOURCE S(x) = 1.0 EQUATION FOR pL
f
1/2 [exp- (H-dx o M I H 0 LEAKAGE REACTIVITY 0.02135 dx fix S(x) = S cos (E) o 2H H f 1/2[exp- H(
cos
dx 0 M S 2H SH 0 x cos -f dx 2H FLAT WITH DROOPING ENDS S (x) = S (1-exp- ( H-)) Hf
1/2 [exp- (Hx -1/2[exp-2 (H-) dx 0 M I x Z 0.01613 H-x 1-exp-( ) dx o MFor representative parameter values, M=7.5 cms, H=175.2 cms.
SOURCE (POWER)
SHAPE
FLAT
0.012 0 0.011 - ** 0 0.010 o o S0.009 -x C 0.008 -S0 0.007 0 4 I 0* 0.005 6o O * S 0.004 o0 0 • a Blanket Enrichment:
0.003 0.2 w/o U-235 - 1.0 w/o U-23.
0.003
0
0.002 Natural Uranium Blanket
0.002 0 0
0.001 e Depleted Uranium Blanket
0.000 I I
0.00 0.01 0.02 0.03 0.04
Power Fraction in Last 6 Inches (fper)
FIG. 3.5 AXIAL LEAKAGE REACTIVITY VS. POWER FRACTION IN OUTERMOST 6 INCHES