Publisher’s version / Version de l'éditeur:
Vous avez des questions? Nous pouvons vous aider. Pour communiquer directement avec un auteur, consultez la
première page de la revue dans laquelle son article a été publié afin de trouver ses coordonnées. Si vous n’arrivez pas à les repérer, communiquez avec nous à [email protected].
Questions? Contact the NRC Publications Archive team at
[email protected]. If you wish to email the authors directly, please see the first page of the publication for their contact information.
https://publications-cnrc.canada.ca/fra/droits
L’accès à ce site Web et l’utilisation de son contenu sont assujettis aux conditions présentées dans le site LISEZ CES CONDITIONS ATTENTIVEMENT AVANT D’UTILISER CE SITE WEB.
10th International Conference on Indoor Air Quality and Climate [Proceedings], pp. 3327-3332, 2005-09-01
READ THESE TERMS AND CONDITIONS CAREFULLY BEFORE USING THIS WEBSITE.
https://nrc-publications.canada.ca/eng/copyright
NRC Publications Archive Record / Notice des Archives des publications du CNRC :
https://nrc-publications.canada.ca/eng/view/object/?id=d08d07f4-14b0-4497-bfec-cc2e2e94fe66 https://publications-cnrc.canada.ca/fra/voir/objet/?id=d08d07f4-14b0-4497-bfec-cc2e2e94fe66
NRC Publications Archive
Archives des publications du CNRC
This publication could be one of several versions: author’s original, accepted manuscript or the publisher’s version. / La version de cette publication peut être l’une des suivantes : la version prépublication de l’auteur, la version acceptée du manuscrit ou la version de l’éditeur.
Access and use of this website and the material on it are subject to the Terms and Conditions set forth at
Making the case for reducing ventilation requirements through selection of low-emission materials
http://irc.nrc-cnrc.gc.ca
M a k ing t he c a se for re duc ing ve nt ilat ion
re quire m e nt s t hrough se le c t ion of low
-e m ission m at -e ria ls
N R C C - 4 7 7 3 4
O u a z i a , B . K . ; R e a r d o n , J . T . ; S a n d e r , D . M .
A v e r s i o n o f t h i s d o c u m e n t i s p u b l i s h e d i n
/ U n e v e r s i o n d e c e d o c u m e n t s e t r o u v e
d a n s : 1 0
t hI n t e r n a t i o n a l C o n f e r e n c e o n
I n d o o r A i r Q u a l i t y a n d C l i m a t e , B e i j i n g ,
C h i n a , S e p t . 4 , 2 0 0 5 , p p . 3 3 2 7 - 3 3 3 2
Making the Case for Reducing Ventilation Requirements
Through Selection of Low-Emission Materials
B. K. Ouazia, J. T. Reardon, D. M. Sander
Institute for Research in Construction, National Research Council Canada 1200 Montreal Road, Ottawa, Ontario K1A 0R6 Canada
ABSTRACT
Most ventilation rates have not been based on pollutants emitted from building materials and furnishings. An approach using the existing Material Emission Database and Indoor Air Quality computer model is presented. The approach examines by how much ventilation rates can be reduced through control of indoor sources of air pollutants while still maintaining acceptable IAQ for residential settings and the consequences on indoor air contaminant concentrations of reductions in ventilation rates below current design requirements.
Key words: contaminant; ventilation rate; materials; low-emission; IAQ; model.
INTRODUCTION
Concentrations of certain air pollutants, especially volatile organic compounds (VOCs), can be greater indoors than outdoors (De Bortoli et al 1986, Wallace et al 1987). This recognition that indoor air quality (IAQ) can be worse than that outdoors has motivated research into the sources of VOCs, and methods for reducing their concentrations indoors.
Outdoor air can bring contaminants into a building. The occupants generate contaminants by breathing and perspiring (e.g., CO2, water vapour, odours), and by their activities (e.g., at
home: cooking, cleaning, bathing, laundering, hobbies). The materials of the building fabric, its finishes and furnishings may off-gas contaminants such as VOCs. Some of these contaminant sources are localized and some are dispersed throughout the interior.
Local exhaust ventilation (from kitchens, bathrooms, and laundry rooms) can remove some localized pollutants. Air filtration and air cleaners can remove contaminants from ventilation supply air and recirculated air, but cannot address air leakage. Ventilation (dilution) is the only approach that can be applied effectively to remove contaminants that have already dispersed within the indoor air. The most effective strategy to reduce contamination that is generated indoors is to control its sources. For VOCs, one source control strategy is to select low-emission products and materials for the building construction and furnishing.
This paper investigates the feasibility of reducing the outdoor air ventilation requirements by selecting low-emission materials, while still maintaining acceptable IAQ, for a residential building. The method used was to apply tools such as a computerized database of material emissions and its accompanying IAQ simulation model (MEDB-IAQ).
MEDB-IAQ SIMULATION SOFTWARE
The MEDB-IAQ simulation program uses a database of VOC emission properties for a variety of commonly used building materials (Magee et al 2002, Zhang et al 1999). In the simulation mode, the program allows users to: (1) select building materials from a material emission database and specify their indoor emitting surface areas (loading factor) and installation schedules, (2) input the interior volume of the space, (3) set the ventilation rates and schedules and, then (4) calculate the concentration time histories of all the VOCs emitted by those materials in the space. The program also allows users to browse the measured emission properties of individual materials, and to query the database to identify which materials are characterized to emit specific VOCs.
APPROACH TO THE IAQ SIMULATIONS AND FEASIBILITY STUDY
A reference case was selected to serve as the basis for comparisons with alternative material selections. The IAQ for this reference case was simulated using the MEDB-IAQ computer program. Simulations were repeated for various substitutions of low-emission materials in place of the more typical materials used in the reference case, for the same ventilation rate scenario, to evaluate the beneficial impacts on the IAQ of those material substitutions. Then, simulations with those alternative material selection sets were repeated, using successively reduced ventilation rates, until the simulated IAQ contaminant concentrations began to reach or exceed those from the reference case scenario. For this feasibility study’s simulations, all materials in each case were introduced to the space at the same time.
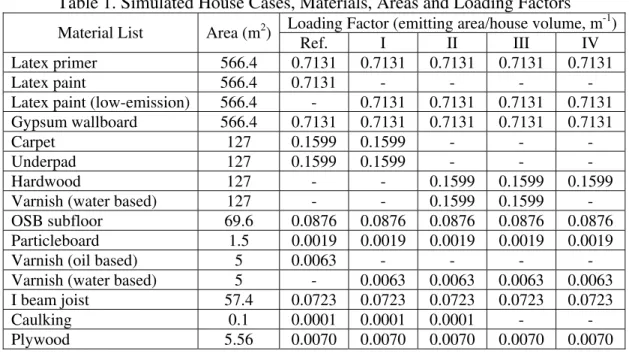
A real, two-storey R-2000 house was chosen as the simulation reference case. The materials used in its construction and its IAQ and ventilation rates were tested and measured as part of a field validation of the MEDB-IAQ simulation model (Bodalal et al 2001). Its internal volume is 794.3 m3. During its first winter following construction, with its heat recovery ventilator operating continuously, its average measured outdoor air exchange rate was 0.23 ac/h. The main selection of materials used in its construction and interior finish, and their loading factors are listed in Table 1.
Table 1. Simulated House Cases, Materials, Areas and Loading Factors
Loading Factor (emitting area/house volume, m-1)
Material List Area (m2)
Ref. I II III IV
Latex primer 566.4 0.7131 0.7131 0.7131 0.7131 0.7131
Latex paint 566.4 0.7131 - - - -
Latex paint (low-emission) 566.4 - 0.7131 0.7131 0.7131 0.7131
Gypsum wallboard 566.4 0.7131 0.7131 0.7131 0.7131 0.7131
Carpet 127 0.1599 0.1599 - - -
Underpad 127 0.1599 0.1599 - - -
Hardwood 127 - - 0.1599 0.1599 0.1599
Varnish (water based) 127 - - 0.1599 0.1599 -
OSB subfloor 69.6 0.0876 0.0876 0.0876 0.0876 0.0876
Particleboard 1.5 0.0019 0.0019 0.0019 0.0019 0.0019
Varnish (oil based) 5 0.0063 - - - -
Varnish (water based) 5 - 0.0063 0.0063 0.0063 0.0063
I beam joist 57.4 0.0723 0.0723 0.0723 0.0723 0.0723
Caulking 0.1 0.0001 0.0001 0.0001 - -
Plywood 5.56 0.0070 0.0070 0.0070 0.0070 0.0070
SIMULATED CASES
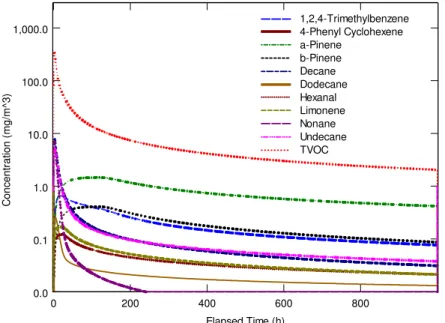
The simulation of the reference case was made for its first 1000 hours. The calculated concentrations for TVOC and for 10 of the 38 VOCs characterized in the database as emitted by its materials are plotted in Figure 1. The range of concentrations of the individual VOCs, and their comparison with the TVOC concentrations raised the question of which materials were the major contributors of each VOC. Possible choices for substitutions of materials were limited to those that were characterized and available in the database. Table 1 lists all the materials and their loading factors, for each simulation case. The material substitutions, from Case I to Case IV, sought to progressively reduce the concentrations of VOCs.
The first obvious target material for substitution due to its large emitting surfaces was the wall and ceiling paint. Those surfaces in the reference case were gypsum wallboard finished with standard water-based latex primer and paint. A special low-emission latex paint used on the walls in an identical real house, was characterized in the database. This change of paint on
the walls and ceilings was the first material substitution made as part of Case I. Despite the relatively small emitting surface of the varnished woodwork in the house, its oil-based varnish is a strong VOC emission source. The other material substitution for Case I was to substitute the water-based varnish used in the identical house for the oil-based varnish in the simulation.
0 200 400 600 800 Elapsed Time (h) 0.0 0.1 1.0 10.0 100.0 1,000.0 C o nc e nt rat io n ( m g/m ^ 3 ) 1,2,4-Trimethylbenzene 4-Phenyl Cyclohexene a-Pinene b-Pinene Decane Dodecane Hexanal Limonene Nonane Undecane TVOC
Figure 1. MEDB-IAQ Simulation Results for Reference Case Scenario (Only 11 of 38 characterized compounds are plotted)
The floors are the second largest emitting surface, so the next material substitution examined, as Case II, was to replace all the carpeting with hardwood flooring finished in place with a water-based varnish. The caulking material was identified as a very strong emission source for 1,2,4-trimethylbenzene and for the aliphatic hydrocarbons nonane, decane, undecane and dodecane. Despite the very small amount of caulking exposed in the test house, this material was eliminated in simulation Case III. For simulation Case IV, the water-based varnish on the hardwood flooring was eliminated. This might be regarded as notionally representing part of an approach to build a “clean” house with unfinished hardwood floors. It might also represent prefinished hardwood flooring that has been allowed to cure and off-gas completely before installation in the house.
OVERVIEW OF IAQ IMPACT OF MATERIAL SUBSTITUTIONS
The reference case provided some indication of the IAQ in a high-quality house. The test cases: I, II, III and IV attempted to make better and better material selections to reduce emission sources and improve the IAQ.
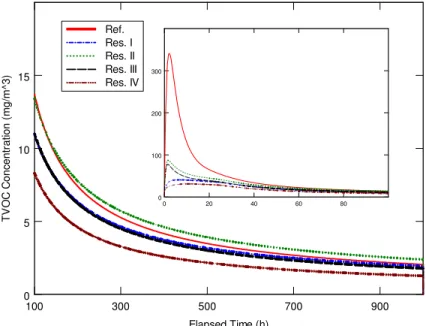
The simulated TVOC concentrations for all these cases are plotted in Figure 2, for times 0 to 100 hours (inset, short-term) and 100 to 1000 hours (medium-term). In the short term, the successive material substitutions from Case I to Case IV, did not successively reduce TVOC concentrations as intended. Substitution of the low-emission latex paint for the original paint in Case I reduced short-term emissions dramatically and longer term emissions somewhat. The elimination of the carpet and underpad did remove their specific contaminants, and their contributions to the TVOC load for Case II. However, the water-based varnish applied to the hardwood floor that replaced the carpet more than made up for that with its own characteristic contaminant emissions, and sometime after 100 hours resulted in higher TVOC levels than the
Reference case. The elimination of the very small amount of caulking exposed in the house resulted in almost as significant a drop in TVOC for Case III as did the subsequent elimination of the very large exposed area of water-based floor varnish for Case IV (illustrated most clearly in Figure 2 for longer times).
100 300 500 700 900 Elapsed Time (h) 0 5 10 15 T V O C C onc entr ati o n ( m g/m^ 3) Ref. Res. I Res. II Res. III Res. IV 0 20 40 60 80 0 100 200 300
Figure 2. TVOC concentration for each simulation case at 0.23 ACH (100 to 1000 hors), with inset for the short-term period (0 to 100 hours)
While these observations of TVOC results are useful, it is important to recognize that TVOC is not a dependable indicator of healthy IAQ. Some VOCs may be relatively harmless in even substantial concentrations, while other VOCs may harm health even at trace concentrations.
IMPACTS OF VARIOUS VENTILATION RATES ON SIMULATED IAQ
As recently as 2001, ASHRAE has recommended 0.35 ac/h total air change rate for a house and the Canadian residential ventilation standard (CSA 1991) recommends 0.3 ac/h. However, the average air change rate of 0.23 ac/h measured in the Reference House and used in the MEDB-IAQ simulations reported above, served as the basis for comparisons below. There are only a few VOCs that appear in all these simulation cases with multiple materials, and their concentrations vary substantially across the simulations. They are the aliphatic hydrocarbons: decane, undecane and dodecane. Decane and TVOC were used to compare the impacts on IAQ of varying the ventilation rate for the various simulation cases.
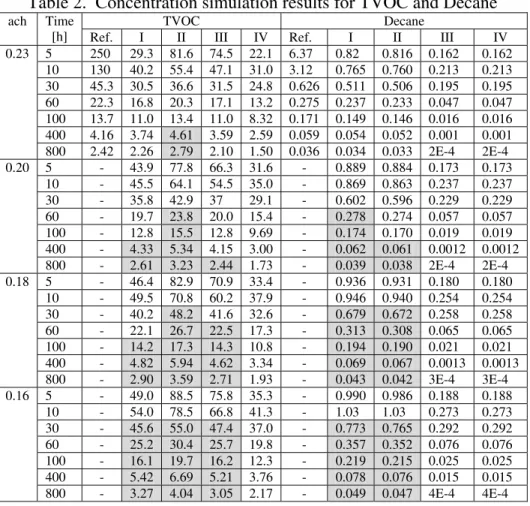
The same Cases I thru IV were simulated for a series of reduced constant ventilation rates of 0.2, 0.18 and 0.16 ac/h, for comparison with the simulated results of the Reference case at 0.23 ac/h. The simulated short and medium-term concentrations of TVOC and decane are listed in Table 2, where concentrations greater than the Reference case are lightly shaded. As expected, at successively lower air change rates the TVOC concentration decay curves increased in value. Recall from Figure 2 that the TVOC for Case II exceeded the Reference case beyond 150 hours at 0.23 ac/h. At 0.20 ac/h, the TVOC concentrations for Cases I and III became greater than those for the reference case beyond 200 hours in the simulations, while for Case II this occurred as early as 40 hours.
Table 2. Concentration simulation results for TVOC and Decane
TVOC Decane ach Time
[h] Ref. I II III IV Ref. I II III IV 5 250 29.3 81.6 74.5 22.1 6.37 0.82 0.816 0.162 0.162 10 130 40.2 55.4 47.1 31.0 3.12 0.765 0.760 0.213 0.213 30 45.3 30.5 36.6 31.5 24.8 0.626 0.511 0.506 0.195 0.195 60 22.3 16.8 20.3 17.1 13.2 0.275 0.237 0.233 0.047 0.047 100 13.7 11.0 13.4 11.0 8.32 0.171 0.149 0.146 0.016 0.016 400 4.16 3.74 4.61 3.59 2.59 0.059 0.054 0.052 0.001 0.001 0.23 800 2.42 2.26 2.79 2.10 1.50 0.036 0.034 0.033 2E-4 2E-4 5 - 43.9 77.8 66.3 31.6 - 0.889 0.884 0.173 0.173 10 - 45.5 64.1 54.5 35.0 - 0.869 0.863 0.237 0.237 30 - 35.8 42.9 37 29.1 - 0.602 0.596 0.229 0.229 60 - 19.7 23.8 20.0 15.4 - 0.278 0.274 0.057 0.057 100 - 12.8 15.5 12.8 9.69 - 0.174 0.170 0.019 0.019 400 - 4.33 5.34 4.15 3.00 - 0.062 0.061 0.0012 0.0012 0.20 800 - 2.61 3.23 2.44 1.73 - 0.039 0.038 2E-4 2E-4 5 - 46.4 82.9 70.9 33.4 - 0.936 0.931 0.180 0.180 10 - 49.5 70.8 60.2 37.9 - 0.946 0.940 0.254 0.254 30 - 40.2 48.2 41.6 32.6 - 0.679 0.672 0.258 0.258 60 - 22.1 26.7 22.5 17.3 - 0.313 0.308 0.065 0.065 100 - 14.2 17.3 14.3 10.8 - 0.194 0.190 0.021 0.021 400 - 4.82 5.94 4.62 3.34 - 0.069 0.067 0.0013 0.0013 0.18 800 - 2.90 3.59 2.71 1.93 - 0.043 0.042 3E-4 3E-4 5 - 49.0 88.5 75.8 35.3 - 0.990 0.986 0.188 0.188 10 - 54.0 78.5 66.8 41.3 - 1.03 1.03 0.273 0.273 30 - 45.6 55.0 47.4 37.0 - 0.773 0.765 0.292 0.292 60 - 25.2 30.4 25.7 19.8 - 0.357 0.352 0.076 0.076 100 - 16.1 19.7 16.2 12.3 - 0.219 0.215 0.025 0.025 400 - 5.42 6.69 5.21 3.76 - 0.078 0.076 0.015 0.015 0.16 800 - 3.27 4.04 3.05 2.17 - 0.049 0.047 4E-4 4E-4
The short- and medium-term simulated concentrations of decane for 0.20 ac/h are plotted in Figure 3. The plots of simulation Cases I and II are virtually identical to each other, as are those for simulation Cases III and IV, since decane is characterized in MEDB-IAQ as being emitted only by the caulking, the oil-based varnish, and minimally by the carpet, not by the latex paints nor by the water-based varnish. For near-term reduction of decane emissions, the elimination of the oil-based varnish seems to be the most important factor, and for medium-to-longer-term reductions the elimination of the exposed caulking seems to be the most important factor. At 0.20 ac/h, the forecast decane concentrations at 1000 hours for Cases I and II are only slightly higher than for the Reference case. For Cases III and IV, with the exposed caulking and then the water-based varnish eliminated, the decane concentrations at 1000 hours are virtually non-existent.
CONCLUSIONS
This project has used existing tools to examine whether ventilation requirements might be reduced by careful selection of low-emission building materials. It has shown, through MEDB-IAQ simulations of the TVOC and decane emissions in a good quality home for typical material selections, that ventilation rates might be reduced to 0.20, 0.18 and even 0.16 ac/h without harming the IAQ in the house. Further qualification of these results must recognize that not all the materials required to build a house, or an office building, school or hospital, for example, have been tested for emissions or characterized in the MEDB-IAQ database for simulation. Repetition of this study when the MEDB-IAQ database is more comprehensive, i.e., more building materials have been tested and characterized in it for the emissions of more VOCs, would illustrate the IAQ consequences of material substitutions more clearly. Another important qualification of these results is that they have examined IAQ contaminants emitted by the building fabric itself, not by occupants or their normal
activities. In other words, this feasibility study has indicated the methodology, but does not provide complete guidance for the successful management of indoor air quality.
100 300 500 700 900 Elapsed Time (h) 0.00 0.05 0.10 0.15 0.20 D ec a ne C on c en tr a ti on (mg/m^ 3) Ref..- 0.23 ach Res. I - 0.20 ach Res. II - 0.20 ach Res. III - 0.20 ach Res. IV - 0.20 ach 0 20 40 60 80 0 2 4 6 8
Figure 3. Decane - air change rate of 0.20 (100 to 1000 hours), with inset for the short-term period (0 to 100 hours)
ACKNOWLEDGEMENTS
Support provided by the federal department of Natural Resources Canada through the Climate Change Technology & Innovation Initiative and by the National Research Council of Canada is gratefully acknowledged.
REFERENCES
ASHRAE. 2001. ANSI/ASHRAE Standard 62-2001, “Ventilation for Acceptable Indoor Air Quality.” ASHRAE, Inc. Atlanta. USA.
Bodalal, A., Lusztyk, E., Brouzes, M.A., Magee, R.J., and Shaw, C.Y. 2001. Field Validation of an IAQ Model for Predicting the Impact of Material Emissions on the Indoor Air Quality in a Newly Constructed House: Task II – Results of Emission Testing, IRC Report B3307.2, National Research Council of Canada, Ottawa, Canada.
CSA. 1991. National Standard of Canada CAN/CSA-F326-M91 “Residential Mechanical Ventilation Requirements.” Canadian Standards Association, Toronto, Canada.
De Bortoli M., Knoppel H., Pecchio E., Peil A. 1986. «Concentration of Selected Organic Pollutants in Indoor and Outdoor air in Northern Italy», Environ. Int. Vol. 12 pp. 343-350. Magee, R.J., Bodalal, A., Biesenthal, T.A., Lusztyk, E., Brouzes, M.A., and Shaw, C.Y. 2002.
“Prediction of VOC Concentration Profiles in a Newly Constructed House Using Small Chamber Data and an IAQ Simulation Program”, Proceedings of Indoor Air 2002, pp. 298-303.
Wallace, L. 1987. “The Total Exposure Assessment Methodology (TEAM) Study: Summary and Analysis, U.S. Environmental Protection agency, Washington, D.C., Vol.1.
Zhang, J.S., Shaw, C.Y., Sander, D.M., Zhu, J.P., Huang, Y. 1999. “MEDB-IAQ: Material emission database and a single-zone IAQ simulation program.” CMEIAQ Final Report 4.2, Institute for Research in Construction, National Research Council of Canada, Ottawa, Canada.