HD28 .M414
\MM^
IMAR
141991WORKING
PAPER
ALFRED
P.SLOAN
SCHOOL
OF
MANAGEMENT
BOOTLEGGERS AND BANDWAGONERS :
A COMPARISON OF EARLY AND LATE ENTRANTS DURING THE GROWTH OF A RESEARCH COMMUNITY
by
Michael A. Rappa* and Koenraad Debackere** January, 1991
MASSACHUSETTS
INSTITUTE
OF
TECHNOLOGY
50
MEMORIAL
DRIVE
BOOTLEGGERS AND BANDWAGONERS :
A COMPARISON OF EARLY AND LATE ENTRANTS DURING THE GROWTH OF A RESEARCH COMMUNITY
by
Michael A. Rappa* and Koenraad Debackere*' January, 1991
3:^50 '9)
-6P5
Submitted for review to the Academy of Management Technology and
Innovation Management Division for presentation at the Annual Conference to be held in Miami, Florida (August, 1991) .
fQQ\'.
The authors greatly appreciate the support and encouragement of Thomas Allen, Edward Roberts, and Roland Van Dierdonck, as well as the generous cooperation of many researchers in the neural networks research community.
* M.I.T. Sloan School of Management, E52-538, 50 Memorial Drive, Cambridge, MA, 02139 (617) 253-3627.
** De Vlerick School voor Management, Universiteit Gent,
Dawoy"
M.I.T. UBRARit
"1
MAR
1 4 1991ABSTRACT
This paper contrasts the characteristics of researchers who are early or late entrants (termed bootleggers and bandwagoners) during the growth of a R&D community. The analysis, which is based on a global survey of over 700 neural network researchers, compares researchers'
motivations for entering the community, the interaction between researchers, and the possible motivations for leaving the community.
1. INTRODUCTION
Understanding the rate of a technology's development has traditionally been viewed in two different contexts. One context, studied extensively
in the literature, is from the perspective of the individual firm. At
this level of analysis, attention focuses on factors internal to the firm that influence its effort to develop a technology. The rate of technology development within the firm is influenced by numerous factors, which can be broadly categorized as staff, structure, strategy and performance variables
.
The rate of technology development can also be understood as a "macro-level" phenomenon. From this perspective, researchers have focused on collections of firms in an industry and the factors that affect their effort to develop a new technology. The factors that constitute this
"macro-level" context of technological change can be divided broadly into the realms of technology-push and market-pull.
While both perspectives have yielded significant insights into the process of technological development, there is room for improvement in
our understanding. Indeed, students of technological development at the level of the firm may have lost sight of some critical
extra-organizational variables influencing the emergence of new technologies. At the same time, the "macro-level" perspective might benefit from
broadening the focus of analysis from that of the industry to that of the R&D community committed to developing a new technology.
The notion "RSD community" is used to signify a group of individuals, composed of scientists and engineers, who are committed to solving a set of interrelated scientific and technological problems, who may be
organizationally dispersed, and who openly communicate with each other. The ultimate goal for some members of the community may be to create new knowledge, while for others it may be to apply existing knowledge in the creation of new products and processes. The community is normally global
in scope and can include individuals in a variety of organizations, such
as universities, private firms, new ventures, quasi-public corporations, and government research institutes.
Despite the fact that R&D communities are a familiar concept used to describe the scientific world (Crane, 1972; Ziman, 1984), their place in
the realm of technological development is largely ambiguous. Whereas scientists are recognized as members of communities (the so-called
invisible colleges) in which information flows with relative freedom from lab to lab, technologists typically are viewed as working within
industrial firms and developing proprietary know-how. Secrecy,
competition, and managerial direction are the conditio sine qxia aaa of the technological landscape. Given this traditional conceptualization of technological development, it appears that the notion of a R&D community
is at once incongruent
.
However, a closer examination of science and technology yields
exceptions to such broad stereotypes. Science is not a pristine and
self-regulated world of rational seekers of knowledge. Rather, it is a
succeed within the constraints of their position. At times, scientists get caught-up in the competitive race to stake intellectual claims and may even act contrary to the established scientific norms (Mitroff, 1974;
Latour, 1987; Hull, 1988) .
Likewise, the world of technology is equally complex. Firms compete, but they also cooperate with each other, allowing technical information to flow among engineers in different organizations. Some engineers attend conferences, present technical papers, and publish the results of their work in peer-review journals that are sponsored by professional
societies. Like scientists, they too may see themselves as members of a
particular R&D community, which extends beyond the boundary of their firm. Moreover, it may be the R&D community, in addition to management, that helps to define interesting technical problems and possible
solutions, as well as recognize and reward those who ultimately solve them. In sum, contrary to well-established opinion, the development of a
new technology is not simply the activity of a handful of engineers or a
firm, but it is an activity of hundreds
—
perhaps even thousands—
of individuals working in numerous organizations spread throughout the world.Although scholarly work (e.g. Constant, 1980; Hughes, 1989) has pointed
to the role of "communities of practitioners" in technological
development, more research is needed into the structural and behavioral dynamics of R&D communities in order to understand the role they might play in the emergence of new technologies.
2. AN EVOLUTIONARY MODEL OF RSD COMMUNITIES
The proposed model has its foundation in certain ideas about
technological development that are becoming increasingly more popular among those who study technology (cfr. Granberg, 1987) . The ideas that figure predominantly in this model are: (1) technology development is a
form of knowledge creation (Laudan, 1984); (2) technology development is
a problem solving activity (Allen, 1984), where the solutions to the problems are uncertain; (3) technology development is an evolutionary process, and therefore it needs to be examined over time as problems are solved and uncertainty is reduced; (4) technological development is a
dispersed activity that may include a number of organizations, including university and government labs as well as industrial labs, which ma)ce up an R&D community; (5) technology development is inherently a scientific activity, and thus science and technology must be viewed in an integral process (Latour, 1987); and (6) technology development is a social process, and therefore there is a need to focus on the people who are developing the technology, as well as the institutional context in which they reside (Latour, 1987; Hull, 1988)
.
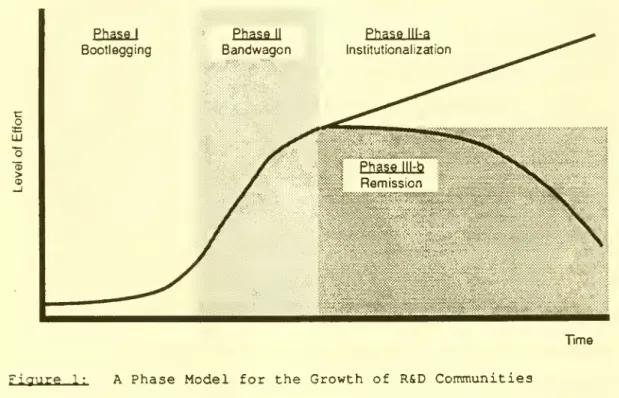
Earlier studies that were based on these assumptions suggest a pattern
of evolution within R&D communities reminiscent of three distinct phases,
as illustrated in Figure 1. The phases are diagrammed in Figure 1 in
terms of changes in the level of effort within the field. The first phase, which is coined the "bootlegging" phase, is characterized by a
relatively low level of effort. During this period, a handful of
researchers dedicate themselves to furthering the field, even though their enthusiasm may not be shared by their peers, and indeed, may be
severly criticized. Typically, they have difficulty securing adequate funding; hence the name bootlegging, which implies that researchers
struggle to maintain their research without formal recognition or funding to underwrite the cost of their work. Furthermore, there is no obvious market for the emerging technology. While the scientific value of the new field may be the topic of debate, the commercial value is extremely
difficult to see, if at all. Thus, researchers tend to have little pecuniary motivation in pursuing their line of work.
tr o LU "5 > Bootlegging Phase II Bandwagon Time
Figure 1: A Phase Model for the Growth of R&D Communities
In conparison, the second phase represents a sharp transition from the first phase. The dominant characteristic of this phase is the very rapid increase in the number of researchers working in the community in a
relatively short period of time. This phenomenon is sometimes referred to
grows, it typically becomes more widely distributed across organizations, sectors, and countries. Within this phase, the field begins to make
headway against its mainstream detractors and builds wider scientific legitimacy. This second phase is also accompanied by the growth of niche markets, which begin to take advantage of the commercial potential of the new technology.
As the bandwagon progresses, the community enters the third phase, where one of two paths will emerge: (a) researchers continue to make progress in solving the problems confronting them, allowing the community
to institutionalize itself, or (b) progress begins to slow down such that researchers become discouraged, forcing the community to contract and perhaps eventually return to the conditions prevailing in the first phase.
The empirical research reported in the following sections aims at
probing more deeply into the sociological dimensions of the different phases and the factors precipitating the phase transitions. The focus will be on contrasting researchers who enter during Phase I
("bootleggers") and those that enter during Phase II ("bandwagoners") in
an attempt to better understand the similarities and differences in their attitudes and behavior. In particular, the analysis compares bootleggers and bandwagoners in terms of their motivations to enter the R&D
community, their interaction with other researchers in the community, and their possible motivations for leaving the community in the future.
3. METHODS AND SAMPLE
In order to investigate the similarities and differences between bootleggers and bandwagoners, a survey technique was used. First of all,
however, we had to focus on a particular R&D community. Several choices were possible. Following the suggestions by sociologists of technology concerning the choice of "strategic research sites" that might enhance our understanding of the processes going on inside the black box of
technological development (Bijker, Hughes, and Pinch, 1987) , we selected
neural network technology as a research site.
Neural networks offer a method of computation that is quite different
in its approach from conventional rule-based techniques. Inspired by theories of neurological processes in biological organisms in their design, neural networks are typically implemented in areas such as
machine vision, speech recognition, and signal-proces3ing--areas in which traditional computational methods have proven difficult. Their
development has an intellectual history that spans more than forty-years.
In recent years, the level of interest among researchers within several disciplines has risen dramatically, and numerous streams of activity have resulted in the commercialization of neural network computer software and hardware.
A survey instrument was designed and tested specifically for collecting information from neural network researchers about their research
activities. The questions in the survey instrument were organized into five sections that deal with: (1) the extent and nature of the
decision to work in the field of neural networks; (3) the extent and nature of the respondent's communal activities, such as sharing
information with other researchers through conferences, papers, and other collaborations; (4) the respondent's perceptions regarding the future progress of neural networks research, including events that might influence his exit from the community; and (5) the basic demographic
characteristics of the respondent and his or her organization.
The target population for the survey was identified by scrutinizing the literature published by neural network researchers during the period 1988-89. About 3,000 researchers were identified worldwide. Of these, the addresses of 2,037 researchers were specified and thus the the survey questionnaire could be sent.
The 2,037 researchers were distributed across 35 different countries: 64% resided within the U.S.; 21% resided in Europe; 11% resided in the Far East; and the remaining 4% were scattered across other parts of the world. Of the total number of questionnaires, 162 were returned
undelivered. For the remaining 1,875 questionnaires, a response rate of
38% (720) was obtained. This return rate was deemed satisfactory for the
purposes of this investigation. In order to follow-up such a large-scale
survey, use wsa made of the e-mail networks and bulletin boards which are commonly used by the neural network researchers themselves.
The regional distribution of respondents corresponds very closely to that of the sampled population. Most respondents are employed in the U.S.
(60%); about one-quarter are based in Europe and 10% are based in the Far
East. Although it is possible that the survey is skewed towards U.S.-based researchers, an examination of the international scientific literature on neural networks in 1988-89 indicates a roughly similar
regional distribution of researchers.
About 64% percent of the respondents are employed in universities, while 25% are industrial researchers, with the balance in government organizations. Here again, the distribution corresponds to the target population and to the scientific literature on neural networks in
1988-89. Furthermore, there are a total of 220 universities represented among the respondents, 101 industrial firms, and 51 government organizations.
Electrical engineers composed 36% of the total respondent sample. When added together with the computer scientists (18%), the combined total for EE and CS is more than one-half of all respondents. The second largest category are the physical sciences (19%) , where physicists make up the
majority of respondents. Biologists and mathematicians each represent about 7% of the respondent sample, while psychologists and cognitive scientists account for about 5%. As with the sectoral and regional
distribtions, an analysis of the scientific literature on neural networks in 1988-89 shows a similar disciplinary distribution.
In terms of their position, 38% of the respondents hold faculty
appointments. The second most common position is that of staff scientist
(or researcher), which represents about 32% of all respondents. This is
followed by students (17%), engineers (7%), and managers (5%). The average age of respondents is 37 years and the median age is 35 years
The youngest quartile is between the ages 22 and 30; the oldest quartile
is between ages 43 and 69.
4 . BOOTLEGGERS AND BANDWAGONERS COMPARED
4.1. Classifyin? respondents as a bootlegger or bandwagoner.
As described previously, we are mainly interested in investigating differences and similarities between respondents who entered during the bootlegging phase and respondents who entered during the bandwagon phase. Figure 2 shows the number of respondents entering into the neural network,
field in each year, from 1950 to 1990.
c 14 e « o •i 9 B zuu
the survey sample population and not necessarily by an actual decline in
the entry of new researchers.
In order to identify the first two phases of the coiranunity's evolution,
a graph is made of the cumulative number of respondents over time as
indicated by their year of entry (see Figure 3)
. 712 II I I I I II II {I II I I II II III II II II II IiTT-rTnM1 u V e 3 c 01 > 9 e u 534 356 178 75.0 50.0 4J c 01 u «
year
Figure 3: Cumulative number of survey respondents in the field of
neural networks and cumulative percent
The graph shows both the cumulative number of respondents in the field
(on the left axis) and cumulative percent (on the right axis) . It clearly illustrates the rapid growth in the field, which began about 1984. About 25% of the respondents entered the field prior to 1984, whereas about 75% entered from 1984 to 1990. In accordance with the phase model presented earlier, in the subsequent analysis the period 1950-1983 will be
designated as Phase I, or the "bootlegging" phase; and the period from 1984-1990 will be designated as Phase II, or the "bandwagon" phase.
Although not shown here, other techniques were used to validate this cut-off year. Using the thousands of articles published by neural network researchers during the period 1988-89, we traced back the first year of publication for each researcher by means of electronic literature
databases. This resulted in a similar pattern as the one shown in Figure
3. Also, as became obvious from the literature published by neural
network researchers themselves, the transition between Phase I and Phase
II ought to occur somewhere between 1981 and 1984. As a consequence, we carried out sensitivity analyses on the answers of the respondents classified into a "bootlegging" and "bandwagon" group using different cut-off years (i.e. the bootlegging phase ending in 1982, 1983, and 1984 respectively)
.
Comparing the outcomes of the different discriminant analyses revealed that 1983 was certainly acceptable. Since 702 respondents specified the year they entered into the community, this classification procedure leaves us with 165 respondents who entered during the bootlegging phase
("bootleggers") and 537 respondents who entered during the bandwagon phase ("bandwagoners") . The next sections focus on the similarities and
the differences between both groups.
4 .2 Bootleggers and bandwagoners: Why did they enter the field? A number of questions were posed concerning what factors might influence the researcher's entry into the field of neural networks. As
shown in Figure 4, bootleggers were more influenced by the
"intellectually compelling nature of neural networks" than their bandwagon counterparts; they were less influenced by the "positive
opinions of other researchers"; they were less influenced by the "recent successes of other neural network researchers"; and they were less
influenced by the "potential for peer recognition" than their
counterparts in the bandwagon phase. There is no significant difference
in the influence of "dissatisfaction with the previous research agenda" or the potential for "solving an important societal problem" between the two groups
.
intellectualcoapellinqness positive opinions recent successes potential forpeer recognition dissatisfaction sithprevious
societal problea availability of funding lack ofother topics potential forfinancial rewards coBMercialenterprise p<WI<t=-3^:nl=152:n2=518) p<D01(t=-7O7:nl=154:n2=521) p=032(l=-2J5;nl=l49;n2=5Il) nj.(t=-0.72:nl=152:n2=154) nj.(i=039:nl=I52;n2=513) ^p<lX)I(t=-355:nl=I51:n2=5I4) p<Wl(t=4.12:nI=l5I:n2=Sl5) p<D05lt=-3O8:nl=l49:n2=5Ol) fpJlQ=-13?:n]=150:^=m) . . . \p<WI(t=4.97:nl=l55:n2=510) bandwagoners (n2)
n
bootleggers (nl) J 1 2 not at all 3 4 5 somewhat 6 7 very muchFiyure 4: Bootlegger/bandwagoner comparison on entry stimuli
(2-taileci p-values are reported; n.s. p-values were in excess of 0.20)
(scale: 1-item was not at all important; 7=item was very important)
However, bootleggers were less influenced in entering the field by the "availability for funding" for neural network, research than bandwagon respondents; they were less influenced by the "lack of other promising research topics"; they were less influenced by the "potential for
financial rewards"; and they were less influenced by the "opportunity to build a commercial enterprise" than their bandwagon counterparts.
Moreover, the bandwagoners acknowledged to be significantly more influenced than the bootleggers by the (large) size of the field and the
(rapid) growth rate of the field at the moment they made their entry decision (Pdifference*-•00^ or^ both items). Discriminant analyses further substantiated the differences between bootleggers and bandwagoners with regard to their entry decision.
The results on entry decisions illustrate that bandwagoning is a
complex phenomenon. They suggest that the expansion of a community is to
a certain extent due to the rush to join in on a trend, which has less to do with the underlying fundamentals than with the propensity for people
to act on the basis of the actual or perceived actions of others. The bandwagon-effect contributes to an atmosphere of a race to the emergence of a new technology--a race for the rewards that accrue to those who are first to stalce claims to new knowledge in the form of patents or papers.
We further analyzed the entry motives for bootleggers and bandwagoners in academia and industry. As could be expected, bootleggers in academia and industry report rather similar entry motives. However, one might expect bandwagoners in academia and industry to be drawn in for different reasons. Clearly, this is not borne out by the data. Bandwagoners in academia and industry are similar in many respects. Only two entry items attain statistical significance when comparing both bandwagoner groups: industrial bandwagoners are more motivated by the potential to build a
commercial enterprise than their academic counterparts (p<.001) and they are more motivated by the potential for peer recognition than their academic counterparts (p=.04).
As the majority of bootleggers entered the field before they graduated, contrary to the majority of bandwagoners who entered after graduation, we
examined whether the difference in importance of the various entry
factors was due to the fact that different types of people are attracted to the field as it matures, or rather, whether the differences in entry factors were due to changes in people as they mature. This was done by means of an ANCOVA on the different entry items in which we used the time since graduation as a covariate and the bootlegger/bandwagoner dichotomy
as an independent variable. Time since graduation was used as an
indicator of a respondent's maturity. Although the covariate exerted a
significant effect for some of the entry items studied, the
bootlegging/bandwagon independent variable retained its significant main effects as reported in Figure 4. Thus, the results seem to indicate that different people enter a technology's development at different points in
time.
4.3 Bootleggers and bandwagoners: Their communal behavior.
The R&D community concept implies that researchers, even the ones working on technology development, in some way or other exchange information. As a consequence, an important part of the questionnaire investigated several aspects of communal behavior. Once again, our focus was on the bootlegger/bandwagoner dichotomy.
The results show that, although bootleggers face an initial "time" advantage with regard to conference attendance and publications, the bandwagoners catch-up fairly quickly, regardless of whether they reside in academia or industry. Also, in terms of their collaborations with other research teams, bootleggers and bandwagoners tend to be similar
(X2=2.47; n.s.) .
We also asked the respondents to rank order five possible outlets for a
discovery they might make in neural network technology. What would they personally do if they realized an important breakthrough? Would they publish it? Or, would they present it a conference? Would they look for patent protection? Or, would they try to commercialize their finding? And, what about announcing their discovery at a press conference? The results for bootleggers and bandwagoners are shown in Table 1. Each group
would first publish before patenting. When further taking into account sector of employment (academia versus industry) , it is noteworthy that
publishing remains the highest priority.
Bootleggers also appear to communicate significantly more outside their organizations than bandwagoners do. Using a principal components analysis with varimax rotation, we created an "External Communications Index,
"
which captured those questionnaire items indicating the strength of the respondents' external communications. Factor scores based on the varimax principal components analysis were computed using the regression method. The results are shown in Table 2: bootleggers communicate more outside their organizations than bandwagoners do.
solving effort. To paraphrase Latour (1987), the bootleggers have to become "statesmen of science" to further their cause.
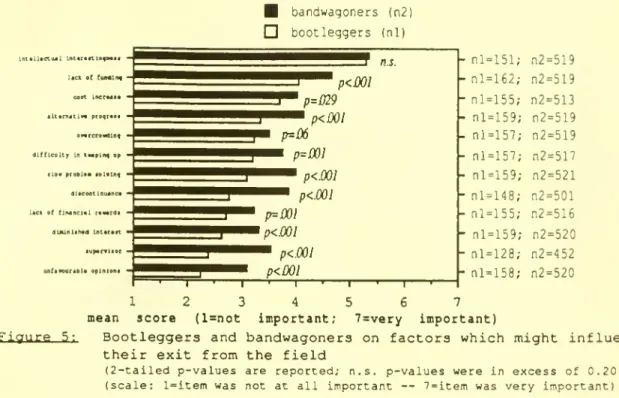
4 .4 Bootleggers and bandwa goners: Why they might leave the community.
As with the entry decision, there are also several statistically significant differences between the two groups in terms of the factors which might influence the decision to diminish respondents' conimitment to neural networks. The only category in which there is no significant
difference between the two groups is in terms of "a diminished
intellectual interestingness" of neural networks. However, bootleggers are less likely to be influenced than their bandwagon counterparts by:
(1) "a lack of funding for their research"; (2) "increased financial
costs of conducting neural network research"; (3) "rapid progress in
alternative areas of research"; (4) "overcrowding in terms of the number of neural network researchers"; (5) "difficulty in keeping up with new developments in neural networks"; (6) "slow progress in solving technical problems in neural networks"; (7) "discontinuance of neural network
activities at their organization"; (8) "a lack of financial rewards"; (9)
"diminished interest among other researchers in neural networks"; (10)
"negative opinions of supervisors"; and (11) "opinions of leading
researchers unfavorable to neural networks" (see Figure 5) . In sum, they
will stick to the field, even in the face of discouragement .
Also, the bootleggers are much more willing to stick to their research agenda before reaching their goals. About 70% of the bootleggers are willing to work for 5 years or longer on their present research agenda
bandwagoners (n2) bootleggers (nl) IntcilcctulLnt»r«>tlBfs«>« lackatfssAlrt^ «iit iftctsaia altanutl**pro^mi oMrcroadtDf — dlfflCDlty 10KMplAfop — •lo«probl**lolvlnf~
dlicoetiDaaac*
Lackof flMocialtaMrd* dtaUlatadIfltatCft tup«r?ltoc anfavoorabia oplnloni nl=151; n2=519 nl=162; n2=519 nl=155; n2=513 nl=159; n2=519 nl=157; n2=519 nl=157; n2=517 nl=159; n2=521 nl=148; n2=501 nl=155; n2=516 nl=159; n2=520 nl=128; n2=452 nl=158; n2=520
12
3 4 5 6 7mean score (l=not important; 7=very important)
Figure 5: Bootleggers and bandwagoners on factors which might influence their exit from the field
(2-tailed p-values are reported; n.s. p-values were in excess of 0.20)
(scale: l=item was not at all important -- 7=item was very important)
before achieving their goals. About the same percentage of bandwagoners would only like to wor)c at most 5 years on their present research agenda before realizing their goals (Pdifference*-- 00^) • Discriminant analyses
further substantiated the significant differences between both groups with regard to their exit decision.
When looking further into the bootleggers and bandwagoners in academia and industry, we find significant differences, mainly between
bandwagoners in industry and academia. Clearly, bandwagoners in industry are more prone to the influence of managerially imposed exit factors such as a discontinuance of neural networks research at their organization or negative opinions of supervisor towards neural networks than bandwagoners
in academia are (Pdifferences'^•01) • Nevertheless, the main differences
between bootleggers and bandwagonera remain, even when taking into account sector of employment
.
5. CONCLUSION
The objective of this research is to draw attention to the notion that R&D communities exist and that they may play an instrumental role in the emergence of new technologies. Although the importance of academic
communities in the operation of science is generally accepted, very little is understood about how communities may contribute to
technological progress. In order to answer this question, a fundamental
understanding of researcher communities is necessary. The proposed phase model discussed in this paper and the analysis of behavioral differences between bootleggers and bandwagoners provide a first step in this
direction.
The results of an international survey of the neural networks
researchers described in this paper lend insight in the similarities and differences between researchers who pioneer a field and those who enter much later, when the field has become more widely accepted. The evidence
indicates that, in the case of neural networks, bootleggers and
bandwagonera differ in terms of the factors which most influenced their decision to enter field, as well as the factors that would influence their departure. Furthermore, although both groups of researchers have similar attitudes towards their priorities in disseminating information about new developments, bootleggers tend to have a greater degree of communication with researchers external to their own organization.
However, the analysis of bootleggers and bandwagoners is complicated by several factors that need to be taken into account. Most importantly, there are severe limitations that arise when seeking to understand a
time-dependent phenomenon using a one-shot data collection procedure.
Ideally, data should be collected at the time when a researcher enters a
field, as well as when the decision is made to exit. In order to do this, what is needed is a longitudinal study that tracks changes in an R&D community over time. Although such a study is difficult to conduct, the present survey provides the opportunity to examine exit decisions by means of a periodic follow-up survey of the 720 participants.
The research reported here is preliminary. It would be unwise to read too much in the present findings without the careful examination of other R&D communities. However, a better understanding of researcher behavior within a communal, extra-organizational context is a necessary step towards a theory on how communities might actually influence
technological progress.
REFERENCES
Allen, T.J. (1977) Managing the Flow of. Tftchnology. Cambridge, MA: MIT
Press .
Bijker, W.E.; Hughes, T.P.; Pinch, T., eds. (1987) The Social Construction af. Technological System.'?. Cambridge, MA: MIT Press. Constant, E.W. (1980) The Qrigin.q of the Turboiet. Baltimore: Johns
Hoplcins University Press.
Crane, D. (1972) Invisible Colleges: Diffusion ol Knowledge in Scientific Communities . Chicago: The University of Chicago Press.
Granberg, A. (1987) "A Conceptual Frameworlc for the Study of Generic Fields of Technology," Discussion Paper No. 179, Research Policy Studies, University of Lund, Sweden.
Hughes, T.P. (1989) American Genesis. New Yorlc: Viking.
Hull, D.L. (1988) Science as
^
Process. Chicago: The University ofChicago Press.
Latour, B. (1987) Science in Action. Cambridge, MA: Harvard University
Press
.
Laudan, R. (1984) The Nature al Technological Knowledge: A££ Modsis QJL Scientific Change Relevant? Dordrecht: Reidel.
Mitroff, I. (1974) "Norms and Counter-Norms in a Select Group of the Apollo Moon Scientists: A Case Study of the Ambivalence of Scientists," American Sociological Review 39: 579-595.
Ziman, J. (1984) Aa Introduction tii Science Studies. Cambridge:
Cambridge University Press.
Date
Due
4^
''NOV
ijzm
MIT IIBR4RIES