Publisher’s version / Version de l'éditeur:
Vous avez des questions? Nous pouvons vous aider. Pour communiquer directement avec un auteur, consultez la
première page de la revue dans laquelle son article a été publié afin de trouver ses coordonnées. Si vous n’arrivez
Questions? Contact the NRC Publications Archive team at
PublicationsArchive-ArchivesPublications@nrc-cnrc.gc.ca. If you wish to email the authors directly, please see the first page of the publication for their contact information.
https://publications-cnrc.canada.ca/fra/droits
L’accès à ce site Web et l’utilisation de son contenu sont assujettis aux conditions présentées dans le site
LISEZ CES CONDITIONS ATTENTIVEMENT AVANT D’UTILISER CE SITE WEB.
Student Report; no. SR-2009-14, 2009-08
READ THESE TERMS AND CONDITIONS CAREFULLY BEFORE USING THIS WEBSITE. https://nrc-publications.canada.ca/eng/copyright
NRC Publications Archive Record / Notice des Archives des publications du CNRC : https://nrc-publications.canada.ca/eng/view/object/?id=602ec1d1-3228-4c89-ac58-f0fd7675af74 https://publications-cnrc.canada.ca/fra/voir/objet/?id=602ec1d1-3228-4c89-ac58-f0fd7675af74
Archives des publications du CNRC
For the publisher’s version, please access the DOI link below./ Pour consulter la version de l’éditeur, utilisez le lien DOI ci-dessous.
https://doi.org/10.4224/19577551
Access and use of this website and the material on it are subject to the Terms and Conditions set forth at Description of seatrial tests carried out on CCGA Roberts Sisters ll Model IOT761
Ocean Technology technologies oc ´eaniques
SR-2009-14
Student Report
Description of Seatrial Tests Carried Out on CCGA
Roberts Sisters ll Model IOT761.
Charmley, E.
REPORT NUMBER
SR-2009-14
NRC REPORT NUMBER DATE
August 2009 REPORT SECURITY CLASSIFICATION
Unclassified
DISTRIBUTION
Unlimited TITLE
DESCRIPTION OF SEAKEEPING TESTS CARRIED OUT ON CCGA ROBERTS SISTERS II MODEL IOT761
AUTHOR(S)
E. Charmley
CORPORATE AUTHOR(S)/PERFORMING AGENCY(S)
Institute for Ocean Technology, National Research Council, St. John’s, NL PUBLICATION
N/A
SPONSORING AGENCY(S)
IOT, SafetyNet IOT PROJECT NUMBER 42_2374_10
NRC FILE NUMBER
KEY WORDS
Fishing Vessel, Seakeeping, Motion Induced Interruptions
PAGES vi, 23, Apps. A-G FIGS. 11 TABLES 4 SUMMARY
This report describes a set of irregular wave seakeeping experiments carried out as part of the Fishing Vessel Safety Project on a 1:10.67 scale model of the 65 ft (19.81 m) long fishing vessel CCGA Roberts Sisters II, designatedIOT761, in the Institute for Ocean Technology (IOT) Offshore Engineering Basin (OEB) during the months of July and August 2009. The data obtained over the course of these experiments was used to determine various vessel motions at a variety of vessel headings and speeds. The objective of these experiments was to acquire quality model scale
seakeeping data to validate numerical prediction software under development at Memorial University of Newfoundland (MUN) as well as correlate it with the full-scale data.
ADDRESS National Research Council Institute for Ocean Technology Arctic Avenue, P. O. Box 12093 St. John's, NL A1B 3T5
Institute for Ocean Institut des echnologies T
Technology Océaniques
DESCRIPTION OF SEAKEEPING TESTS CARRIED OUT ON CCGA ROBERTS SISTERS II MODEL IOT761
SR-2009-14
E. Charmley August 2009
2.0 PROJECT BACKGROUND ... 1
3.0 DESCRIPTION OF THE IOT OFFSHORE ENGINEERING BASIN ... 2
4.0 DESCRIPTION OF PHYSICAL MODEL... 2
5.0 DESCRIPTION OF INSTRUMENTATION ... 4
5.1 MODEL MOTIONS MEASUREMENT INSTRUMENTATION... 4
5.2 OTHER INSTRUMENTATION... 6
6.0 DESCRIPTION OF THE EXPERIMENTAL SETUP... 7
7.0 DESCRIPTION OF SEAKEEPING TEST PROGRAM ... 10
DATA ANALYSIS... 13
8.1 ONLINE DATA ANALYSIS... 13
8.2 OFFLINE DATA ANALYSIS... 15
9.0 IRREGULAR WAVE TEST RESULTS... 16
9.1 RESULTS DISCUSSION... 18
10.0 REGULAR WAVE TEST RESULTS... 19
11.0 CONCLUSIONS... 21
AP aft perpendicular
ATTC American Towing Tank Conference
B beam, breadth
CCG Canadian Coast Guard
CCGA Canadian Coast Guard Auxiliary CCGS Canadian Coast Guard Ship CG centre of gravity
cm centimetre(s)
COG Course Over Ground DAS data acquisition system DC direct current
deg. degree(s)
DGPS Differential Global Positioning System DOF degrees of freedom
DV digital video ft. feet, foot FS full scale FW fresh water
g acceleration due to gravity GDAC General Data Acquisition and Control GEDAP General Data Analysis Package GMT transverse metacentric height
GPS Global Positioning System
h height
Hm0 significant wave height (based on zeroth moment for a narrow
banded spectrum)
HS significant wave height (based on zero crossing period)
Hz Hertz
IOT Institute for Ocean Technology
ITTC International Towing Tank Conference
kg kilogram(s)
L length
LCB longitudinal centre of buoyancy LCF longitudinal centre of floatation LCG longitudinal centre of gravity
m metre(s)
MII Motion Induced Interruptions mm millimetre(s)
MP MotionPak
MS model scale
MUN Memorial University of Newfoundland NRC National Research Council
OEB Offshore Engineering Basin
OMAE Offshore Mechanics and Arctic Engineering RMS Root Mean Square
RPM Revolutions Per Minute rps revolutions per second s, sec. second(s)
SAR Search And Rescue
S(f) energy spectrum (function of frequency)
SNAME Society of Naval Architects and Marine Engineers SOG Speed Over Ground
STBD. starboard StDev., S.D. standard deviation
SW salt water
t tonne(s), time
T draft
T1,T2 start/end time Tpd period of spectral peak
TZ zero crossing period
DESCRIPTION OF SEAKEEPING EXPERIMENTS CARRIED OUT ON CCGA ROBERTS SISTERS II MODEL IOT761
1.0 INTRODUCTION
This report describes a set of irregular wave seakeeping experiments carried out as part of the Fishing Vessel Safety Project on a 1:10.67 scale model of the 65 ft (19.81 m) long fishing vessel CCGA Roberts Sisters II, designated IOT761, in the Institute for Ocean Technology (IOT) Offshore Engineering Basin (OEB) during the months of July and August 2009. The data from these tests was used to correlate with the full-scale data acquired during sea trials carried out off St. John’s, NL October 17/18, 2004 - described in Reference 1. The objective of the experiments was to acquire quality model scale seakeeping data to correlate with full-scale data, as well as to validate numerical prediction software under development at Memorial University of Newfoundland (MUN).
This document describes the model fabrication, instrumentation, data analysis procedure, provides the results of the sea trial /physical model correlation exercise and
recommendations to improve the overall correlation in future.
2.0 PROJECT BACKGROUND
The Fishing Vessel Safety Project is just a small component of the overall SafetyNet initiative to understand and mitigate the health and safety risks associated with
employment in a marine environment. SafetyNet is the first federally funded research program investigating occupational health and safety in historically high risk Atlantic Canada marine, coastal and offshore industries. The Fishing Vessel Safety Project is conducting research on the occupational health and safety of seafood harvesters. Fishing is the most dangerous occupation in Newfoundland and Labrador and is increasingly so. Over the past ten years, the rates of reported injuries and fatalities nearly doubled.
The main focus of this portion of the Fishing Vessel Safety Project is to measure Motion Induced Interruptions (MIIs). A MII is an event caused by severe sea conditions that either prevents work or causes an injury. Sea trials and model testing of several fishing vessels have been done to determine the occurrence and effects of MIIs. The data from these trials and tests will be used in development of designs that reduce sudden vessel motions induced by wave action as well as determine criteria to reduce crew accidents when these motions occur.
Additional information on SafetyNet may be found by visiting their website (Reference 2).
3.0 DESCRIPTION OF THE IOT OFFSHORE ENGINEERING BASIN
The IOT Offshore Engineering Basin (OEB) has a working area of 26 m by 65.8 m with a depth that can be varied from 0.1 m to 2.8 m. Waves are generated using 168
individually computer controlled, hydraulically activated, wet back wavemaker segments fitted around the perimeter of the tank in an ‘L’ configuration. Each segment can be operated in one of three modes of articulation: flapper mode (± 15º), piston mode (± 400 mm), or a combination of both modes. The wavemakers are capable of generating both regular and irregular waves up to 0.5 m significant wave height. Passive wave absorbers are fitted around the other two sides of the tank. The facility has a recirculating water system based current generation capability with current speed dependent on water depth. The facility also has extensive video coverage and is serviced over its entire working area by a 5 tonne lift capacity crane. Additional information on the OEB can be found in Reference 3 and a photo of the tank during testing in Figure 9.
4.0 DESCRIPTION OF PHYSICAL MODEL
The model is a 1:10.67 representation of the CCGA Roberts Sisters II fishing vessel, designated IOT761, and was fabricated of wood and glass conforming to surfaces generated from 2-D lines/table of offsets. The model was constructed according to IOT
standard construction procedures described in Reference 4. The hull was made using a Styrofoam™ HI 60 polystyrene foam core with a ¾” plywood floor and Renshape™ was used in areas requiring reinforcement. IOT’s Liné CNC milling machine was used to prepare the general geometry of the hull which was then covered with 10 ounce cloth and resin, primed, sanded and painted with three coats of Imron™ Polyurethane 1300U Enamel high gloss yellow paint. A simple superstructure simulating the wheelhouse was included forward. Behind the wheelhouse a rectangular anti-roll tank was outfitted. The period of this tank was matched to the natural roll period of the model as per parameters outlined in Reference 9. Body plan, profile and plan view drawings are provided in Figure 1. Photographs of the completed hull are provided in Figure 2. Hydrostatics for the ship and model are included in Appendix B.
Model IOT761 was outfitted with six Renshape™ reference blocks located on the gunwales and stern, which were milled flat to a specified level above the baseline. The hull was reinforced with RENSHAPE™ blocks to provide a secure base for two ¾ inch in diameter 8 inch long (1.905 cm * 20.32 cm) aluminium model launching pins fitted on the sides of the hull forward of Station 5 and well above the waterline. These pins were designed to interface with the model launch system used to restrain the model in waves just prior to each run. A stern eyebolt, anchored to a RENSHAPE™ block, was fitted on the model longitudinal centerline just above the waterline to accommodate a tag line that provided a method to arrest and retrieve the model at the end of each run. A white painted plywood plate was fitted over the main deck as a precautionary measure to prevent the electronics from being damaged in the event of water splashing on the deck.
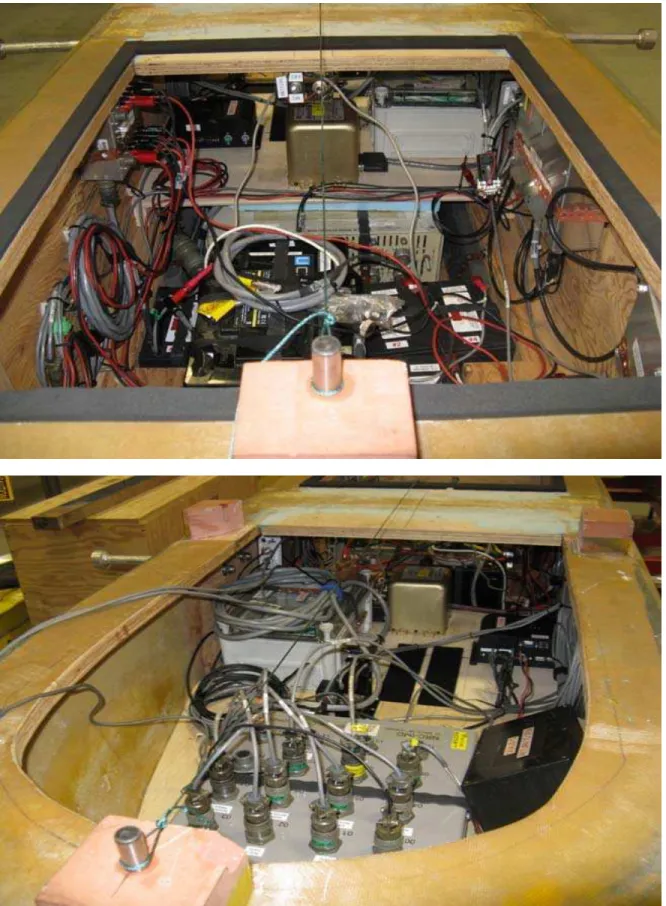
The model was outfitted with a propeller shaft and a brass four bladed, right hand propeller (Figure 3), driven by a Model 1580DC Aerotech brush type rotary DC servo motor. The propeller is in the IOT database, numbered 104R. A simple flat plate rudder (Figure 4) was installed. A fixed nozzle encompassing the propeller on the ship was omitted from the model. Other outfit components included a motor controller; radio control/telemetry electronics, model motions measurement instrumentation, cabling and several batteries of different sizes tightly packed in a confined space (Figure 4). In order
to charge the batteries, the model was removed from the OEB over night and hooked up to a charging unit along side the tank. An operator located at one end of the tank
manually controlled the model via a radio link.
Since the model was relatively small, very little additional weight was needed to ballast it to the desired draft and trim. The placement of instrumentation (especially batteries) and extra weights was crucial to matching the hydrostatics. A swing test was done, where the nominal locations of the ballast and instrumentation were determined. The model swing results are provided in Appendix C. The model was put in the small trim tank to set the condition, static and dynamic stability properties - including draft, trim, transverse metacentric height and mass moment of inertia. The results of the inclining experiment are provided in Appendix C.
A wooden cradle was fabricated to accommodate the model during transit and was fixed to a metal platform to facilitate launching and recovery of the model in the OEB. Four lengths of chain were attached to the main 5 t capacity OEB overhead crane to support the model during launch and recovery (Figure 5).
5.0 DESCRIPTION OF INSTRUMENTATION 5.1 Model Motions Measurement Instrumentation
This section describes the instrumentation and calibration methodology used for each parameter measured:
Model Motions
Two independent systems were used in the experiment to measure the model motions – a MotionPak II and the QUALISYS system. As these systems are based on different measurement principles, more confidence can be placed in the systems if they achieve similar results. Output from the MotionPak II was also verified against three orthogonal linear accelerometers located at the bow of the model.
1) BEI Systron Donner Inertial Division MotionPak II: The MotionPak II is a solid state, six degree of freedom, inertial sensing system used to measure angular rates and linear accelerations. Three orthogonally mounted GyroChip quartz rate gyroscopes are used to measure the three angular velocities; roll, pitch and yaw. Three orthogonally mounted silicon accelerometers measure the three linear accelerations; heave, sway and surge. These accelerations are measured in g’s where one g = 9.808 m/s2.
Both the angular velocities and linear accelerations were manually calibrated. Angular velocities were calibrated using the turntable that could be rotated at specified angular rates. Accelerations were calibrated in terms of g’s, where the maximum measured value is 1 g (9.808 m/s2). The MotionPak II was placed at different angles and the angle was measured with a digital inclinometer. The acceleration was computed using: A = 1 g *cos (angle).
2) QUALISYS: Several infrared emitting bulbs were strategically placed on the model such that the QUALISYS cameras fitted at the east end of the OEB could track its 3D position. The QUALISYS system is used to determine six motions: orthogonal linear displacements (X, Y, Z) in the tank co-ordinate system translated to an origin at the model’s center of gravity, the heading angle, and the pitch and roll angle in a body co-ordinate system.
3) Bow Accelerometers: Three linear accelerometers were installed well
forward of the MotionPak II to measure lateral and vertical acceleration solely to provide verification of the MotionPak II analysis algorithm. The sensors were calibrated using the same procedure as was used to calibrate the accelerometers in the MotionPak II.
5.2 Other Instrumentation
Rudder Angle
Rudder angle was measured by installing a rotational potentiometer on the pivot point of the rudder. This parameter was calibrated relative to a protractor fitted adjacent to the linkage. No effort was made to duplicate the ship’s rudder slew rate model scale because the slowest rudder rate available on the rudder servo was still much faster than the target value.
Shaft Rotation
The shaft rotation was measured using a tachometer integral with the propulsion motor. The tachometer provided an analog signal linearly proportional to shaft speed and was calibrated using a laser tachometer aimed at a piece of reflective tape on the shaft.
Wave Elevation
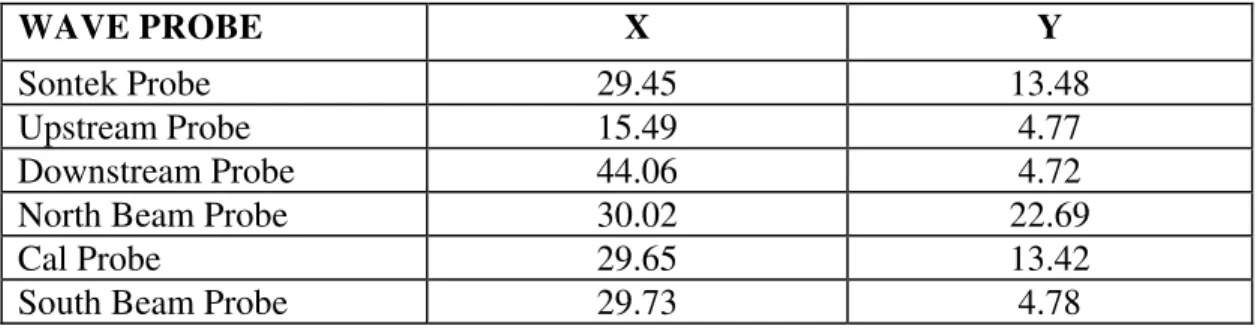
Wave elevation was measured using four capacitance wave probes located at different positions in the OEB. Wave matching was conducted using a separate wave probe nominally located at the OEB’s test center – an arbitrary central point in the OEB.
The locations of the four wave probes used during experimentation plus the wave probe installed during wave matching are listed in the following table:
WAVE PROBE X Y
Sontek Probe 29.45 13.48
Upstream Probe 15.49 4.77
Downstream Probe 44.06 4.72
North Beam Probe 30.02 22.69
Cal Probe 29.65 13.42
South Beam Probe 29.73 4.78
Note: the origin (0,0) is the far North West corner of the tank.
The wave probes were calibrated using the OEB wave probe calibration facility. A sketch of the OEB layout for these experiments is provided in Figure 8.
Data Acquisition
All analog data was low pass filtered at 10 Hz, amplified as required, and digitized at 50 Hz. All data acquired from the model was conditioned on the model before transfer to onshore data acquisition computer through radio telemetry. The wave and QUALISYS data were conditioned/digitized using a NEFF signal conditioner, transferred to the data acquisition system via cable and stored in parallel with the model data. Synchronization between the NEFF data and telemetry is nominally within 0.2 s.
In addition, an RMS error channel was set up to monitor QUALISYS signal integrity and two signals were acquired to monitor wave board activity.
6.0 DESCRIPTION OF THE EXPERIMENTAL SETUP
The OEB was specifically configured for these experiments. The following conditions were set to achieve the desired results for the seakeeping tests.
Water Depth: The water depth was set at 2.8 meters for the seakeeping experiments. This allowed the assumption that the model was operating in deep water (h/T>4) so there were no shallow water hydrodynamic effects.
Blanking Walls: The OEBs blanking walls, that cover the beaches on the north side, were removed for all seakeeping experiments.
Segmented Wave Board Configuration: All boards were adjusted to a height of 1.3 meters as measured from the OEB floor to the bottom of the board, and were set in piston mode.
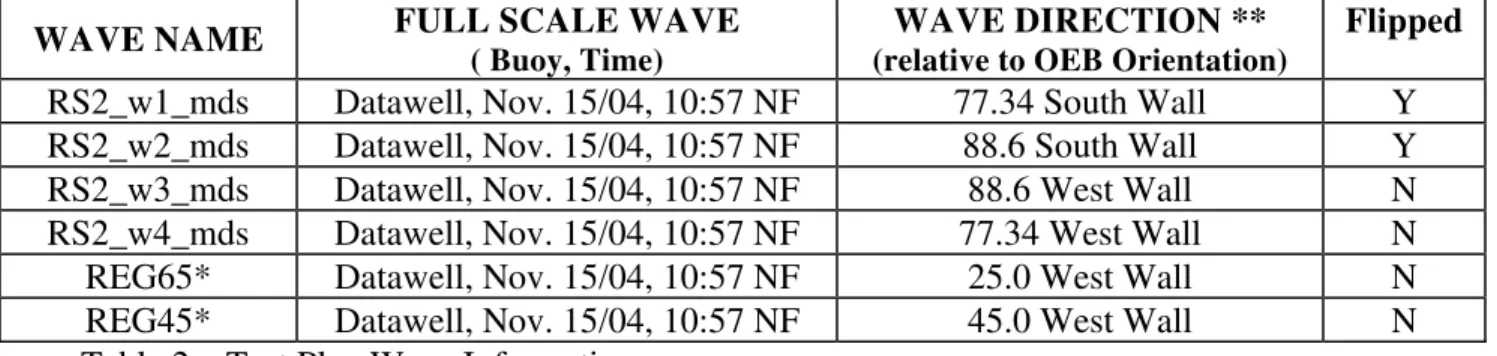
Wave Generation: Several multi-directional irregular waves, corresponding to the 11 o’clock waves as measured at sea during the full scale trial using two moored directional wave buoys were matched with a dominant wave direction of 77.34 degrees relative to the OEB South wall and 88.6 degrees from the OEB West wall. Two dominant wave directions of 25 degrees and 45 degrees from the OEB South wall were chosen for use during the regular wave tests. Two wave directions were used in both the regular and irregular wave cases to provide some flexibility regarding the model direction.
A listing of the waves used is provided below:
WAVE NAME FULL SCALE WAVE
( Buoy, Time)
WAVE DIRECTION **
(relative to OEB Orientation)
Flipped
RS2_w1_mds Datawell, Nov. 15/04, 10:57 NF 77.34 South Wall Y RS2_w2_mds Datawell, Nov. 15/04, 10:57 NF 88.6 South Wall Y RS2_w3_mds Datawell, Nov. 15/04, 10:57 NF 88.6 West Wall N RS2_w4_mds Datawell, Nov. 15/04, 10:57 NF 77.34 West Wall N REG65* Datawell, Nov. 15/04, 10:57 NF 25.0 West Wall N REG45* Datawell, Nov. 15/04, 10:57 NF 45.0 West Wall N Table 2 – Test Plan Wave Information
* note: The regular waves only had two angles of generation from the West Wall listed above, however they varying wave heights and wave periods are not listed above.
** note: “Wave Direction” in the table above represents the dominant wave direction.
Where ‘Flipped’ refers to the waves that had their wave spreading angle characteristics flipped about their dominant axis. This is to ensure that the proper side of the model was receiving the desired wave energy. A complete set of the regular and irregular wave diagrams and details are provided in Appendix E.
Video Cameras
Two digital video (DV) cameras were used to record the test runs:
View #1: This camera was mounted in a metal frame on the west wall of the OEB, roughly on the OEB longitudinal centerline, 4.68 m off the OEB floor. This camera was operated remotely from the control station.
View #2: Camera mounted on a tripod and manually directed by an operator on the North deck surrounding the OEB with runs recorded on tape. The camera location varied along the length of the North and East side of the OEB in order to capture varying views of the same run.
Model Launch System:
The OEB has a wood and rope launch system controlled by the overhead crane. The model is held in place by two rubber grips against its hull bottom and a triangular frame of rope on either side (see Figure 5). This frame of rope restrains the model in the first few waves prior to the model’s release and angles the model at a predetermined ideal run angle in order to optimize the limited available run length. The model was outfitted with launching pins located port and starboard on the hull, which rest against the rope frame to restrain the model from drifting too far aft. A single weight at the bottom of the rope launching frame anchors the frame to a single position in the tank.
Model Control System:
The model’s shaft speed and rudder angle were controlled using software installed on an on-shore desktop computer that communicated with the model via wireless modem. Model shaft speed settings were determined iteratively to ensure the desired calm water model, and shaft speed remained constant throughout the run. An autopilot was fitted in model IOT761 so that the model could move along a set course with respect to the
incident wave direction for each run. The model operation and data acquisition centre was positioned on the tank walkway directly behind the model.
7.0 DESCRIPTION OF SEAKEEPING TEST PROGRAM
The test program consisted of performing experiments while transiting at two different forward speeds (4 and 8 knots full scale), and five different headings with respect to the dominant incident waves (head, bow, beam, quartering and following seas). The regular and irregular wave diagrams and details are provided in Appendix E.
The heading angles were derived after careful examination of the directional wave data and ship heading angle data acquired during the ‘Roberts Sisters II’ full-scale seakeeping sea trials. The courses and headings used for all runs are illustrated in Appendix E.
Typical Run Sequence:
Carrying out a free running model experiment in the OEB is a labour intensive effort. The following personnel are required:
• Operator of video camera View #2
• Individual operating the model remotely via portable wireless control device. • Individual attending the model restraining line.
• Individual operating the data acquisition system (DAS) and wave generator computer.
• Individual carrying out the online data analysis - reviewing the acquired data after each run using a dedicated workstation in the OEB Control Room.
A typical run sequence is provided as follows:
1) All team members take their positions.
2) With model in the start position, the wave generation signal was loaded and wavemaker span set to no (0%) stroke.
3) Data acquisition was triggered which commences (and synchronizes) execution of the wave drive signal. Since the wavemaker stroke is set to 0%, no physical waves were generated. Calm water data is acquired until the delay interval has passed. The delay interval is equal to the sum of all ‘constant speed’ wave data acquired up to that point for a given condition, less a suitable period to allow the irregular wave train to build and traverse the tank to reach the model. Since the entire wave spectrum cannot be covered in a single run, this process is necessary to ensure that seakeeping data for the whole spectrum is acquired in an efficient manner using a series of wave segments.
4) When the required delay interval has passed, the wavemaker span was increased to 100% and physical wave generation begins.
5) Roughly one minute of waves was permitted to pass the model with the model constrained in the launcher.
6) The model shaft speed was adjusted to the desired value however the model was restrained in the launcher by the tag line attached to the stern.
7) Video recording was commenced on the cameras. 8) The model was then released.
9) The model was propelled down the tank by the auto-pilot with some unavoidable lateral drift depending on the wave heading. The model planar (X, Y) position was tracked using QUALISYS. The video camera operator manually tracked the model and zoomed in/out as required, optimizing the image.
10) Within a few metres of the end of the tank, the restraining (tag) line attached to the model stern arrests the model’s forward travel and the shaft speed is cut. Video recording, wave generation and data acquisition were terminated.
11) The model is towed manually back to the starting position using the tag line with the propulsion system and rudder control used to manoeuvre the model stern first into the launching device.
12) A wait time of 12 minutes between runs was required to permit the tank to settle to calm. A varying number of runs dependent on the forward speed and model direction with respect to the incident wave combination was required to complete a given Run Sequence. A total of 25 minutes of data full scale (447 s model scale) was required to complete each Run Sequence.
The zero speed drift runs were executed by merely setting the model heading nominally 90 degrees with respect to the dominant wave direction near the west end of the tank and acquiring data until the model either drifted too close to an obstruction, tank perimeter - or acquisition time scaled to full scale data matched. A tag line was connected to the model during drift speed runs, and at all other times.
In addition to the runs in waves, a number of dedicated roll decay experiments were carried out in calm water at zero forward speed as well as 4 and 8 knots full scale. The model was manually stimulated in roll by depressing the main deck at the nominal maximum beam. Pitch decay runs were also carried out at zero forward speed in calm water by manually depressing the bow to stimulate the model in pitch. Photographs of model IOT761 in the OEB during testing are shown in Figures 6, 7, 8. The Run Log/Video Log is provided in Appendix F.
DATA ANALYSIS
A description of the data analysis process is provided as follows:
8.1 ONLINE DATA ANALYSIS
The data were acquired in GDAC format (*.DAC files) described in References 6, 7. The following online data analysis command procedure was executed on a workstation in the OEB Control Room immediately after each run to verify the integrity of the acquired data:
• All measured channels from instrumentation, south and west wave board monitoring channels, plus signal dropout ‘RMS error’ monitoring channel (QUALISYS) were converted from GDAC to GEDAP format (described in Reference 8) and scaled to full scale units using Froude scaling laws (scale factor 10.67).
• QUALISYS data was de-spiked to remove most of the signal dropouts.
• Dedicated MotionPak motions analysis software was run generating six degrees of freedom motions at the model center of gravity (CG) in an earth fixed co-ordinate system using a value for low frequency cut-off (F1) of 0.06 Hz for irregular waves and 0.83 * (1/Tp) Hz full scale for regular waves where Tp is the peak period. Since the MotionPak unit was fitted fairly close to the location of the nominal model CG, it was not necessary to move the computed motions to a new location. The following 18 channels were output for the online data review: three orthogonal angular accelerations/rates/angles (roll, pitch and yaw) and three orthogonal linear accelerations/velocities/displacements (surge, sway and heave). • A routine was executed to transform QUALISYS linear displacement motions (X,
Y, Z) to the model CG.
• A routine was executed to compute two model speed channels (in full scale m/s and knots) from QUALISYS planar position (X, Y) data.
• All data was plotted in the time domain and time segments for statistical analysis were interactively selected.
o Plot #1: six QUALISYS acquired model motion channels (3 orthogonal linear displacements, roll, pitch and heading angle)
o Plot #2: six MotionPak II acquired raw model motion channels (3 orthogonal linear accelerations, 3 orthogonal angular rates) o Plot #3: QUALISYS signal integrity channel, south wave board
monitoring channel and the four wave probe channels
o Plot #4: west wave board monitoring channel, model speed over ground (m/s), rudder angle, shaft speed, bow vertical and lateral acceleration channels
o Plot #5: six of the computed MotionPak II motion channels – (3 orthogonal angles, 3 orthogonal linear accelerations)
• Basic statistics (minimum, maximum, mean, standard deviation) were computed for all measured and computed channels for the interactively selected tare and steady state time segment.
• The five time series plots and table of basic statistics were output to a local laser printer in the OEB Control Room and statistics were stored in an ASCII format file in the project directory.
The data collected above was used in performing the online analysis. The following is a list of parameters examined throughout the course of this analysis. These give a good indication of the quality of the data acquired.
• Verifying the value of the shaft rps, model forward speed, and heading angle as being correct.
• Comparing the standard deviation of the motion channels output by QUALISYS and MotionPak II.
• Reviewing the signal integrity channels for evidence of signal loss. If significant signal loss was detected during critical segments of the run, the run was normally repeated.
• Plotting and comparing the pitch and roll angle data output from QUALISYS on the same time base as the integrated roll and pitch rate data from the MotionPak II.
8.2 Offline Data Analysis
The data from the model test in GEDAP format, was scaled from the model-scale to full scale using the scale factor of 10.67. Most of the data channels could be used directly after they were scaled, however, modifications were required to achieve better data on some channels. For example, the QUALISYS data was de-spiked to remove some dropouts. The spikes seen on the QUALISYS data are a result of the tracking cameras losing sight of the markers located on the model.
A routine was executed to transform QUALISYS linear displacements (X, Y, Z) to the model centre of gravity. QUALISYS motions were derived from an origin located at the bottom of the hull amidships. Because of this, the motions were moved 7.75 cm aft, 13.65 cm down, and 2.25 cm to port (model scale), in order to transfer the origin to the center of the gravity. QUALISYS motions were derived at the centre of gravity for the runs.
Now that all of the required corrections have been made, all of the data is in the required form, and analysis can be done. The following 18 channels are enough to cover the full range of data analysis required for the seakeeping experiment:
CHANNEL DESCRIPTION UNITS 001 MP_Surge Displacement m 002 MP_Surge_Acceleration m/s2 003 MP_Sway_Displacement m 004 MP_Sway_Acceleration m/s2 005 MP_Heave_Displacement m 006 MP_Heave_Acceleration m/s2 007 MP_Yaw_Angle deg. 008 MP_Yaw_Rate deg./s 009 MP_Pitch_Angle deg. 010 MP_Pitch_Rate deg./s 011 MP_Roll_Angle deg. 012 MP_Roll_Rate deg./s
013 Shaft Speed rps 014 Rudder Angle deg. 015 QUAL_Pitch_Angle deg. 016 QUAL_Roll_Angle deg 017 Forward Speed knots 018 South Centre Wave Probe m
• The wave channels for each run listed above were merged with other run segments that make up the given Run Sequence using a fixed 3 s merging overlap for irregular waves and 10 s merging overlap for regular waves, between each segment to ensure a relatively smooth transition. The result is a final file that spans the entire nominal 25 minute full scale wave spectrum. The number of segments required to cover the wave spectrum was dependant on the incident wave direction and model forward speed.
• Each of the merged channels was inspected on a terminal in the time domain to ensure there were no anomalies induced during the analysis and merging process.
• The basic statistics (minimum, maximum, mean, standard deviation) were then computed for the 18 merged channels. This information was
subsequently output in tabular form.
9.0 IRREGULAR WAVE TEST RESULTS
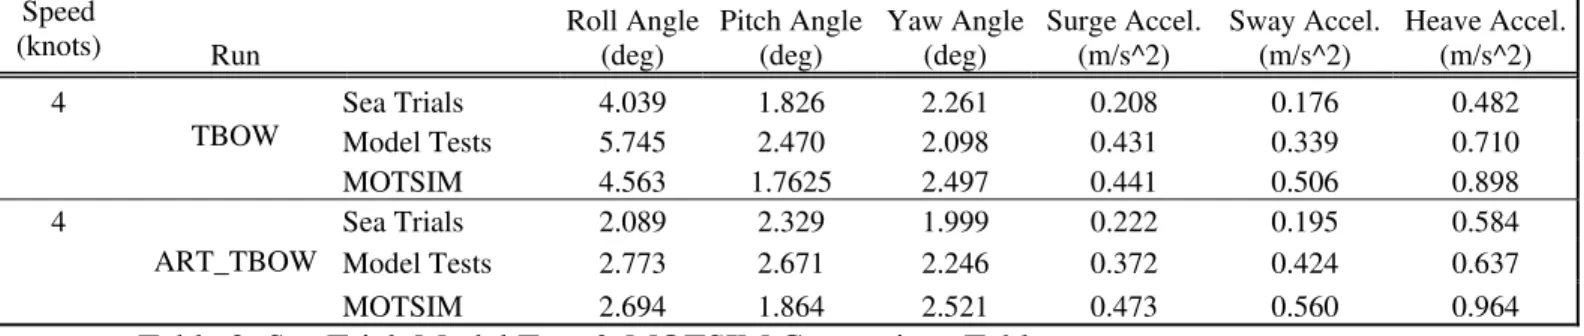
A comparison between the results of the full-scale sea trials data is described in Reference 1. In this section the sea trial results, physical model data collected for
irregular waves, and results generated by MOTSIM are presented. It should be noted that the waves used in the irregular wave tests were the 11am waves from the sea trials. The data presented in Table 3 below shows the data from the time of the run from the sea trial tests. However, the 11 am waves were used in the model tests and MOTSIM data for these scenarios was generated from waves in the early morning or the late afternoon. Therefore, the data generated at the 9 am waves is presented in the table below since this is the closest time to the 11 am waves. In addition to this, the model auto-pilot was
movement while maintaining the run course. Information about the parameters used on the fishing vessel Roberts Sisters II is not available.
An initial correlation of the seakeeping data with full-scale sea trial results and numerical predictions is provided in Reference 5.
Speed
(knots) Run Roll Angle(deg) Pitch Angle(deg) Yaw Angle(deg) Surge Accel. (m/s^2) Sway Accel.(m/s^2) Heave Accel.(m/s^2)
4 Sea Trials 4.039 1.826 2.261 0.208 0.176 0.482 Model Tests 5.745 2.470 2.098 0.431 0.339 0.710 TBOW MOTSIM 4.563 1.7625 2.497 0.441 0.506 0.898 4 Sea Trials 2.089 2.329 1.999 0.222 0.195 0.584 Model Tests 2.773 2.671 2.246 0.372 0.424 0.637 ART_TBOW MOTSIM 2.694 1.864 2.521 0.473 0.560 0.964
Table 3: Sea Trial, Model Test & MOTSIM Comparison Table
A comparison between the sea trials, model tests and MOTSIM can now be made. Comparisons are listed as follows:
• The model test results are generally larger than the sea trial results. This may be a result of the model being tested using a different wave time as noted above, slight variations in differences between the model scale GM and the full scale GM or geometric differences in the keel between the model scale and the full scale versions.
• Over all the MOTSIM values are larger than both the model test and sea trial data. This may be because the MOTSIM scenarios are run at different wave times than the waves used during the model test, and the actual waves during the sea trials. • In all cases, the roll angle decreased with the use of the anti-roll tank. The roll
angle was reduced by roughly half during the sea trials, and the same trend was present during model tests and predicted by MOTSIM. This is an expected trend, as the purpose of the anti-roll tank is to passively dampen roll motion.
• The ART seems to increase the pitch angle while producing varying results for the yaw angle. The slight increase of the pitch angle is reflected in both the trials
and tests when the ART is in use, so this may reflect a trend. However, in the case of the yaw angle, the sea trials show that with the ART the angle decreases, and the model test shows that the angle increases. This comparison is not consistent, and therefore more data is needed to see if a trend is present.
9.1 RESULTS DISCUSSION
In light of the general comparison, the data collected during model tests and generated by MOTSIM seems reasonable. Slight discrepancies in the data may be contributed to slight differences in the testing conditions.
The reason why the model tests and MOTSIM results may be different from the trial results and each other is because of the use of different waves during testing. As mentioned previously, all waves in the irregular wave conditions were generated using the scaled 11am waves from the sea trials. On the other hand, the MOTSIM data was generated using either waves before 9am or after 3pm, meaning that results for an 11am wave scenario could not be directly compared.
Another possible contributor to the differences in the results is the speed at which the model tests were conducted. During the TBOW trial, the fishing vessel was moving at a speed of 3 knots and the model at 3.01 knots. However, for the ART_TBOW case, the fishing vessel was moving at a speed of 2 knots during trials and the model speed was 2.668 knots during testing.
In addition to this, during the model tests the significant wave height was 1.98m for the TBOW run, where as it 2.61m during trials on the TBOW heading. The same can be noted of the ART_TBOW run in which the model encountered the same 1.98m
significant wave height, and the results for the sea trials were gathered while the fishing vessel was encountering a significant wave height of 2.25m.
Finally the shape of the Roberts Sisters II Fishing Vessel below the waterline, specifically around the keel, was not known accurately prior to testing due to lack of information. Because of this, small discrepancies between the model GM and the ship GM may have contributed to differences in motion of the model when compared with the fishing vessel. The GM of the model was determined to be 0.0899 m and the scaled ship’s GM was 0.0879, roughly a 2% difference. This difference is not large, but a smaller GM may mean reduced motions.
All these factors can affect the results of the motions noted above in Table 3. However, despite these discrepancies, the results are comparable and of value for this project.
10.0 REGULAR WAVE TEST RESULTS
In this section the model test results for regular and irregular wave tests with and without the anti-roll tank are presented. The complete set of data and graphs showing the pitch, yaw, rudder, and roll angles versus the frequency are included in Appendix G.
Regular Waves Roll Angle vs. Frequency
0 2 4 6 8 10 12 14 16 18 0.1248 0.1362 0.1475 0.1589 0.1702 0.1816 0.2043 Wave Frequency (Hz) Ro ll An g le (d eg )
Case1 - 4 knots, no ART Case2 - 4 knots, ART Case3 - 8 knots, no ART Case4 - 8 knots, ART
The Graph 3, taken from Appendix G, shows the graph of the roll angle versus the frequency of the waves.
Graph 3 shows that for runs without the anti-roll tank, such as case 1 and case 3, the roll angle of the model is quite large. When the anti-roll tank is in use, seen in case 2 and case 4, the models roll angle is much smaller. At a wave frequency of 0.1589 Hz the roll angle of the model at the four-knot trawling speed is reduced by 37% when the roll tank is in use. Likewise, at the same frequency, the roll angle of the model at the eight-knot cruising speed is 44% less when the roll tank is in use.
When the frequency of the waves matches the natural roll frequency of the model, the roll angle is amplified. In Graph 3 this occurs after a frequency of 0.1589 Hz, when the roll angle jumps from just over ten degrees to sixteen degrees. At this same frequency when the anti-roll tank is in use, the peak roll angle is decreased by 37% and 44% as described in that paragraph above. However, with the anti-roll tank in use, the peak roll angle occurs at a lower frequency indicating that the use of the anti-roll tank decreases the roll period of the model as well as the amplitude of the roll angle. The reduction in roll period may be due to the addition of weight in the anti-roll tank from the water, which shortens the GM. This shift in GM would be present in both the trial and test results because a corresponding weight of water was adding during the fishing vessel trials and model tests when the anti-roll tank was in use.
Irregular Waves
Energy of Roll Motion vs. Frequency
0 200 400 600 800 1000 1200 1400 1600 1800 0 0.1 0.2 0.3 0.4 0.5 0.6 Frequency (Hz)
Energy of Roll Motion
TBOW - no ART TBOW - ART
Graph 5: Irregular Waves – Energy of Roll Motion vs. Frequency, based on the model seakeeping tests
Graph 5 shown above shows the wave energy that the model encounters versus the wave frequency. The graph shows that when the anti-roll tank is not in use, the wave energy roll motion experienced by the model is 87% higher than if the anti-roll tank were in use. The peak model energy of roll motion occurs at a lower frequency when the anti-roll tank is in use, suggesting that the anti-roll tank shortens the roll period of the model and dampens the roll motion effectively. This shortened period is a result of the shift in the GM due to the added water in the anti-roll tank. However, a corresponding mass of water was added to the fishing vessel during trials, so this shift in GM is mirrored in results from both trials and model testing.
11.0 CONCLUSIONS
Over all the model scale seakeeping tests were successful. Despite the slight
discrepancies in the hull form beneath the water line, the varying wave conditions under which tests were conducted, and the slight difference in GM values between the model
and the fishing vessel, the results from the tests are comparable. The following can be drawn from the preliminary analysis:
• The results presented in this report are within a reasonable range to match those of the sea trials.
• The performance of the anti-roll tank on the model was as expected, with results from model testing and MOTSIM comparing well with the sea trial results. • The use of the anti-roll tank in the irregular wave tests reduced the peak roll angle
roughly by half. This addition of water into the anti-roll tank also caused a shift in the GM meaning that the peak roll angle occurred at a lower frequency than when the tank was empty.
• The regular wave tests showed the same trend in data when the anti-roll tank was used.
• The use of the anti-roll tank during regular waves reduced the peak roll angle by a little less than half.
In light of this, the results from the model test will further the research being done for the Fishing Vessel Safety Project. The MIIs recorded during these tests correspond to those recorded during the Roberts Sisters II sea trials in 2004 and show that from the model tests further research can be done to understand MIIs and improve safety conditions at sea on board fishing vessels in Newfoundland.
12.0 REFERENCES
1) Cumming, D., Fleming, T., “Description of Seakeeping Trials Carried out on CCGA Roberts Sisters II – November 2004”, IOT Trials Report #TR-2005-09, July 2005.
2) “SafetyNet – a Community Research Alliance on Health and Safety in Marine and Coastal Work”, www.SafetyNet.MUN.ca, August 2009.
3) Description of Institute for Ocean Technology Offshore Engineering Basin, http://iot-ito.nrc-cnrc.gc.ca/facilities/oeb_e.html, August 2009.
4) Institute for Ocean Technology Standard Test Method: “Construction of Models of Ships, Offshore Structures and Propellers”. V10, 42-8594-S/GM-1, October 18, 2007.
5) Bass, D., et. al., “Assessing Motion Stress Levels on Board Fishing Vessels of the Newfoundland Fleet”, 23rd International Conference on Offshore Mechanics and Arctic Engineering (OMAE), June 2004, Vancouver, BC.
6) Miles, M.D., “Test Data File for New GDAC Software”, NRC Institute for Marine Dynamics Software Design Specification, Version 3.0, January 2, 1996.
7) Miles, M.D., “DACON Configuration File for New GDAC Software”, NRC Institute for Marine Dynamics Software Design Specifications, Version 3.2, August 14, 1996.
8) Miles, M.D., “The GEDAP Data Analysis Software Package”, NRC Institute for Mechanical Engineering, Hydraulics Laboratory Report No. TR-HY-030, August 11, 1990.
9) Keough, R., “Anti-Roll Tank Model Period Variation – August 2008”, IOT Student Report #SR-2008-40, August 2008.
DESCRIPTION OF SEAKEEPING EXPERIMENTS CARRIED OUT ON CCGA ROBERTS SISTERS II MODEL IOT761
1.0 INTRODUCTION
This report describes a set of irregular wave seakeeping experiments carried out as part of the Fishing Vessel Safety Project on a 1:10.67 scale model of the 65 ft (19.81 m) long fishing vessel CCGA Roberts Sisters II, designated IOT761, in the Institute for Ocean Technology (IOT) Offshore Engineering Basin (OEB) during the months of July and August 2009. The data from these tests was used to correlate with the full-scale data acquired during sea trials carried out off St. John’s, NL October 17/18, 2004 - described in Reference 1. The objective of the experiments was to acquire quality model scale seakeeping data to correlate with full-scale data, as well as to validate numerical prediction software under development at Memorial University of Newfoundland (MUN).
This document describes the model fabrication, instrumentation, data analysis procedure, provides the results of the sea trial /physical model correlation exercise and
recommendations to improve the overall correlation in future.
2.0 PROJECT BACKGROUND
The Fishing Vessel Safety Project is just a small component of the overall SafetyNet initiative to understand and mitigate the health and safety risks associated with
employment in a marine environment. SafetyNet is the first federally funded research program investigating occupational health and safety in historically high risk Atlantic Canada marine, coastal and offshore industries. The Fishing Vessel Safety Project is conducting research on the occupational health and safety of seafood harvesters. Fishing is the most dangerous occupation in Newfoundland and Labrador and is increasingly so. Over the past ten years, the rates of reported injuries and fatalities nearly doubled.
The main focus of this portion of the Fishing Vessel Safety Project is to measure Motion Induced Interruptions (MIIs). A MII is an event caused by severe sea conditions that either prevents work or causes an injury. Sea trials and model testing of several fishing vessels have been done to determine the occurrence and effects of MIIs. The data from these trials and tests will be used in development of designs that reduce sudden vessel motions induced by wave action as well as determine criteria to reduce crew accidents when these motions occur.
Additional information on SafetyNet may be found by visiting their website (Reference 2).
3.0 DESCRIPTION OF THE IOT OFFSHORE ENGINEERING BASIN
The IOT Offshore Engineering Basin (OEB) has a working area of 26 m by 65.8 m with a depth that can be varied from 0.1 m to 2.8 m. Waves are generated using 168
individually computer controlled, hydraulically activated, wet back wavemaker segments fitted around the perimeter of the tank in an ‘L’ configuration. Each segment can be operated in one of three modes of articulation: flapper mode (± 15º), piston mode (± 400 mm), or a combination of both modes. The wavemakers are capable of generating both regular and irregular waves up to 0.5 m significant wave height. Passive wave absorbers are fitted around the other two sides of the tank. The facility has a recirculating water system based current generation capability with current speed dependent on water depth. The facility also has extensive video coverage and is serviced over its entire working area by a 5 tonne lift capacity crane. Additional information on the OEB can be found in Reference 3 and a photo of the tank during testing in Figure 9.
4.0 DESCRIPTION OF PHYSICAL MODEL
The model is a 1:10.67 representation of the CCGA Roberts Sisters II fishing vessel, designated IOT761, and was fabricated of wood and glass conforming to surfaces generated from 2-D lines/table of offsets. The model was constructed according to IOT
standard construction procedures described in Reference 4. The hull was made using a Styrofoam™ HI 60 polystyrene foam core with a ¾” plywood floor and Renshape™ was used in areas requiring reinforcement. IOT’s Liné CNC milling machine was used to prepare the general geometry of the hull which was then covered with 10 ounce cloth and resin, primed, sanded and painted with three coats of Imron™ Polyurethane 1300U Enamel high gloss yellow paint. A simple superstructure simulating the wheelhouse was included forward. Behind the wheelhouse a rectangular anti-roll tank was outfitted. The period of this tank was matched to the natural roll period of the model as per parameters outlined in Reference 9. Body plan, profile and plan view drawings are provided in Figure 1. Photographs of the completed hull are provided in Figure 2. Hydrostatics for the ship and model are included in Appendix B.
Model IOT761 was outfitted with six Renshape™ reference blocks located on the gunwales and stern, which were milled flat to a specified level above the baseline. The hull was reinforced with RENSHAPE™ blocks to provide a secure base for two ¾ inch in diameter 8 inch long (1.905 cm * 20.32 cm) aluminium model launching pins fitted on the sides of the hull forward of Station 5 and well above the waterline. These pins were designed to interface with the model launch system used to restrain the model in waves just prior to each run. A stern eyebolt, anchored to a RENSHAPE™ block, was fitted on the model longitudinal centerline just above the waterline to accommodate a tag line that provided a method to arrest and retrieve the model at the end of each run. A white painted plywood plate was fitted over the main deck as a precautionary measure to prevent the electronics from being damaged in the event of water splashing on the deck.
The model was outfitted with a propeller shaft and a brass four bladed, right hand propeller (Figure 3), driven by a Model 1580DC Aerotech brush type rotary DC servo motor. The propeller is in the IOT database, numbered 104R. A simple flat plate rudder (Figure 4) was installed. A fixed nozzle encompassing the propeller on the ship was omitted from the model. Other outfit components included a motor controller; radio control/telemetry electronics, model motions measurement instrumentation, cabling and several batteries of different sizes tightly packed in a confined space (Figure 4). In order
to charge the batteries, the model was removed from the OEB over night and hooked up to a charging unit along side the tank. An operator located at one end of the tank
manually controlled the model via a radio link.
Since the model was relatively small, very little additional weight was needed to ballast it to the desired draft and trim. The placement of instrumentation (especially batteries) and extra weights was crucial to matching the hydrostatics. A swing test was done, where the nominal locations of the ballast and instrumentation were determined. The model swing results are provided in Appendix C. The model was put in the small trim tank to set the condition, static and dynamic stability properties - including draft, trim, transverse metacentric height and mass moment of inertia. The results of the inclining experiment are provided in Appendix C.
A wooden cradle was fabricated to accommodate the model during transit and was fixed to a metal platform to facilitate launching and recovery of the model in the OEB. Four lengths of chain were attached to the main 5 t capacity OEB overhead crane to support the model during launch and recovery (Figure 5).
5.0 DESCRIPTION OF INSTRUMENTATION 5.1 Model Motions Measurement Instrumentation
This section describes the instrumentation and calibration methodology used for each parameter measured:
Model Motions
Two independent systems were used in the experiment to measure the model motions – a MotionPak II and the QUALISYS system. As these systems are based on different measurement principles, more confidence can be placed in the systems if they achieve similar results. Output from the MotionPak II was also verified against three orthogonal linear accelerometers located at the bow of the model.
1) BEI Systron Donner Inertial Division MotionPak II: The MotionPak II is a solid state, six degree of freedom, inertial sensing system used to measure angular rates and linear accelerations. Three orthogonally mounted GyroChip quartz rate gyroscopes are used to measure the three angular velocities; roll, pitch and yaw. Three orthogonally mounted silicon accelerometers measure the three linear accelerations; heave, sway and surge. These accelerations are measured in g’s where one g = 9.808 m/s2.
Both the angular velocities and linear accelerations were manually calibrated. Angular velocities were calibrated using the turntable that could be rotated at specified angular rates. Accelerations were calibrated in terms of g’s, where the maximum measured value is 1 g (9.808 m/s2). The MotionPak II was placed at different angles and the angle was measured with a digital inclinometer. The acceleration was computed using: A = 1 g *cos (angle).
2) QUALISYS: Several infrared emitting bulbs were strategically placed on the model such that the QUALISYS cameras fitted at the east end of the OEB could track its 3D position. The QUALISYS system is used to determine six motions: orthogonal linear displacements (X, Y, Z) in the tank co-ordinate system translated to an origin at the model’s center of gravity, the heading angle, and the pitch and roll angle in a body co-ordinate system.
3) Bow Accelerometers: Three linear accelerometers were installed well
forward of the MotionPak II to measure lateral and vertical acceleration solely to provide verification of the MotionPak II analysis algorithm. The sensors were calibrated using the same procedure as was used to calibrate the accelerometers in the MotionPak II.
5.2 Other Instrumentation
Rudder Angle
Rudder angle was measured by installing a rotational potentiometer on the pivot point of the rudder. This parameter was calibrated relative to a protractor fitted adjacent to the linkage. No effort was made to duplicate the ship’s rudder slew rate model scale because the slowest rudder rate available on the rudder servo was still much faster than the target value.
Shaft Rotation
The shaft rotation was measured using a tachometer integral with the propulsion motor. The tachometer provided an analog signal linearly proportional to shaft speed and was calibrated using a laser tachometer aimed at a piece of reflective tape on the shaft.
Wave Elevation
Wave elevation was measured using four capacitance wave probes located at different positions in the OEB. Wave matching was conducted using a separate wave probe nominally located at the OEB’s test center – an arbitrary central point in the OEB.
The locations of the four wave probes used during experimentation plus the wave probe installed during wave matching are listed in the following table:
WAVE PROBE X Y
Sontek Probe 29.45 13.48
Upstream Probe 15.49 4.77
Downstream Probe 44.06 4.72
North Beam Probe 30.02 22.69
Cal Probe 29.65 13.42
South Beam Probe 29.73 4.78
Note: the origin (0,0) is the far North West corner of the tank.
The wave probes were calibrated using the OEB wave probe calibration facility. A sketch of the OEB layout for these experiments is provided in Figure 8.
Data Acquisition
All analog data was low pass filtered at 10 Hz, amplified as required, and digitized at 50 Hz. All data acquired from the model was conditioned on the model before transfer to onshore data acquisition computer through radio telemetry. The wave and QUALISYS data were conditioned/digitized using a NEFF signal conditioner, transferred to the data acquisition system via cable and stored in parallel with the model data. Synchronization between the NEFF data and telemetry is nominally within 0.2 s.
In addition, an RMS error channel was set up to monitor QUALISYS signal integrity and two signals were acquired to monitor wave board activity.
6.0 DESCRIPTION OF THE EXPERIMENTAL SETUP
The OEB was specifically configured for these experiments. The following conditions were set to achieve the desired results for the seakeeping tests.
Water Depth: The water depth was set at 2.8 meters for the seakeeping experiments. This allowed the assumption that the model was operating in deep water (h/T>4) so there were no shallow water hydrodynamic effects.
Blanking Walls: The OEBs blanking walls, that cover the beaches on the north side, were removed for all seakeeping experiments.
Segmented Wave Board Configuration: All boards were adjusted to a height of 1.3 meters as measured from the OEB floor to the bottom of the board, and were set in piston
Wave Generation: Several multi-directional irregular waves, corresponding to the 11 o’clock waves as measured at sea during the full scale trial using two moored directional wave buoys were matched with a dominant wave direction of 77.34 degrees relative to the OEB South wall and 88.6 degrees from the OEB West wall. Two dominant wave directions of 25 degrees and 45 degrees from the OEB South wall were chosen for use during the regular wave tests. Two wave directions were used in both the regular and irregular wave cases to provide some flexibility regarding the model direction.
A listing of the waves used is provided below:
WAVE NAME FULL SCALE WAVE
( Buoy, Time)
WAVE DIRECTION **
(relative to OEB Orientation)
Flipped
RS2_w1_mds Datawell, Nov. 15/04, 10:57 NF 77.34 South Wall Y RS2_w2_mds Datawell, Nov. 15/04, 10:57 NF 88.6 South Wall Y RS2_w3_mds Datawell, Nov. 15/04, 10:57 NF 88.6 West Wall N RS2_w4_mds Datawell, Nov. 15/04, 10:57 NF 77.34 West Wall N REG65* Datawell, Nov. 15/04, 10:57 NF 25.0 West Wall N REG45* Datawell, Nov. 15/04, 10:57 NF 45.0 West Wall N Table 2 – Test Plan Wave Information
* note: The regular waves only had two angles of generation from the West Wall listed above, however they varying wave heights and wave periods are not listed above.
** note: “Wave Direction” in the table above represents the dominant wave direction.
Where ‘Flipped’ refers to the waves that had their wave spreading angle characteristics flipped about their dominant axis. This is to ensure that the proper side of the model was receiving the desired wave energy. A complete set of the regular and irregular wave diagrams and details are provided in Appendix E.
Video Cameras
Two digital video (DV) cameras were used to record the test runs:
View #1: This camera was mounted in a metal frame on the west wall of the OEB, roughly on the OEB longitudinal centerline, 4.68 m off the OEB floor. This camera was operated remotely from the control station.
View #2: Camera mounted on a tripod and manually directed by an operator on the North deck surrounding the OEB with runs recorded on tape. The camera location varied along the length of the North and East side of the OEB in order to capture varying views of the same run.
Model Launch System:
The OEB has a wood and rope launch system controlled by the overhead crane. The model is held in place by two rubber grips against its hull bottom and a triangular frame of rope on either side (see Figure 5). This frame of rope restrains the model in the first few waves prior to the model’s release and angles the model at a predetermined ideal run angle in order to optimize the limited available run length. The model was outfitted with launching pins located port and starboard on the hull, which rest against the rope frame to restrain the model from drifting too far aft. A single weight at the bottom of the rope launching frame anchors the frame to a single position in the tank.
Model Control System:
The model’s shaft speed and rudder angle were controlled using software installed on an on-shore desktop computer that communicated with the model via wireless modem. Model shaft speed settings were determined iteratively to ensure the desired calm water model, and shaft speed remained constant throughout the run. An autopilot was fitted in model IOT761 so that the model could move along a set course with respect to the
incident wave direction for each run. The model operation and data acquisition centre was positioned on the tank walkway directly behind the model.
7.0 DESCRIPTION OF SEAKEEPING TEST PROGRAM
The test program consisted of performing experiments while transiting at two different forward speeds (4 and 8 knots full scale), and five different headings with respect to the dominant incident waves (head, bow, beam, quartering and following seas). The regular and irregular wave diagrams and details are provided in Appendix E.
The heading angles were derived after careful examination of the directional wave data and ship heading angle data acquired during the ‘Roberts Sisters II’ full-scale seakeeping sea trials. The courses and headings used for all runs are illustrated in Appendix E.
Typical Run Sequence:
Carrying out a free running model experiment in the OEB is a labour intensive effort. The following personnel are required:
• Operator of video camera View #2
• Individual operating the model remotely via portable wireless control device. • Individual attending the model restraining line.
• Individual operating the data acquisition system (DAS) and wave generator computer.
• Individual carrying out the online data analysis - reviewing the acquired data after each run using a dedicated workstation in the OEB Control Room.
A typical run sequence is provided as follows:
1) All team members take their positions.
2) With model in the start position, the wave generation signal was loaded and wavemaker span set to no (0%) stroke.
3) Data acquisition was triggered which commences (and synchronizes) execution of the wave drive signal. Since the wavemaker stroke is set to 0%, no physical waves were generated. Calm water data is acquired until the delay interval has passed. The delay interval is equal to the sum of all ‘constant speed’ wave data acquired up to that point for a given condition, less a suitable period to allow the irregular wave train to build and traverse the tank to reach the model. Since the entire wave spectrum cannot be covered in a single run, this process is necessary to ensure that seakeeping data for the whole spectrum is acquired in an efficient manner using a series of wave segments.
4) When the required delay interval has passed, the wavemaker span was increased to 100% and physical wave generation begins.
5) Roughly one minute of waves was permitted to pass the model with the model constrained in the launcher.
6) The model shaft speed was adjusted to the desired value however the model was restrained in the launcher by the tag line attached to the stern.
7) Video recording was commenced on the cameras. 8) The model was then released.
9) The model was propelled down the tank by the auto-pilot with some unavoidable lateral drift depending on the wave heading. The model planar (X, Y) position was tracked using QUALISYS. The video camera operator manually tracked the model and zoomed in/out as required, optimizing the image.
10) Within a few metres of the end of the tank, the restraining (tag) line attached to the model stern arrests the model’s forward travel and the shaft speed is cut. Video recording, wave generation and data acquisition were terminated.
11) The model is towed manually back to the starting position using the tag line with the propulsion system and rudder control used to manoeuvre the model stern first into the launching device.
12) A wait time of 12 minutes between runs was required to permit the tank to settle to calm. A varying number of runs dependent on the forward speed and model direction with respect to the incident wave combination was required to complete a given Run Sequence. A total of 25 minutes of data full scale (447 s model scale) was required to complete each Run Sequence.
The zero speed drift runs were executed by merely setting the model heading nominally 90 degrees with respect to the dominant wave direction near the west end of the tank and acquiring data until the model either drifted too close to an obstruction, tank perimeter - or acquisition time scaled to full scale data matched. A tag line was connected to the model during drift speed runs, and at all other times.
In addition to the runs in waves, a number of dedicated roll decay experiments were carried out in calm water at zero forward speed as well as 4 and 8 knots full scale. The model was manually stimulated in roll by depressing the main deck at the nominal maximum beam. Pitch decay runs were also carried out at zero forward speed in calm water by manually depressing the bow to stimulate the model in pitch. Photographs of model IOT761 in the OEB during testing are shown in Figures 6, 7, 8. The Run Log/Video Log is provided in Appendix F.
DATA ANALYSIS
A description of the data analysis process is provided as follows:
8.1 ONLINE DATA ANALYSIS
The data were acquired in GDAC format (*.DAC files) described in References 6, 7. The following online data analysis command procedure was executed on a workstation in the OEB Control Room immediately after each run to verify the integrity of the acquired data:
• All measured channels from instrumentation, south and west wave board monitoring channels, plus signal dropout ‘RMS error’ monitoring channel (QUALISYS) were converted from GDAC to GEDAP format (described in Reference 8) and scaled to full scale units using Froude scaling laws (scale factor 10.67).
• QUALISYS data was de-spiked to remove most of the signal dropouts.
• Dedicated MotionPak motions analysis software was run generating six degrees of freedom motions at the model center of gravity (CG) in an earth fixed co-ordinate system using a value for low frequency cut-off (F1) of 0.06 Hz for irregular waves and 0.83 * (1/Tp) Hz full scale for regular waves where Tp is the peak period. Since the MotionPak unit was fitted fairly close to the location of the nominal model CG, it was not necessary to move the computed motions to a new location. The following 18 channels were output for the online data review: three orthogonal angular accelerations/rates/angles (roll, pitch and yaw) and three orthogonal linear accelerations/velocities/displacements (surge, sway and heave). • A routine was executed to transform QUALISYS linear displacement motions (X,
Y, Z) to the model CG.
• A routine was executed to compute two model speed channels (in full scale m/s and knots) from QUALISYS planar position (X, Y) data.
• All data was plotted in the time domain and time segments for statistical analysis were interactively selected.
o Plot #1: six QUALISYS acquired model motion channels (3 orthogonal linear displacements, roll, pitch and heading angle)
o Plot #2: six MotionPak II acquired raw model motion channels (3 orthogonal linear accelerations, 3 orthogonal angular rates) o Plot #3: QUALISYS signal integrity channel, south wave board
monitoring channel and the four wave probe channels
o Plot #4: west wave board monitoring channel, model speed over ground (m/s), rudder angle, shaft speed, bow vertical and lateral acceleration channels
o Plot #5: six of the computed MotionPak II motion channels – (3 orthogonal angles, 3 orthogonal linear accelerations)
• Basic statistics (minimum, maximum, mean, standard deviation) were computed for all measured and computed channels for the interactively selected tare and steady state time segment.
• The five time series plots and table of basic statistics were output to a local laser printer in the OEB Control Room and statistics were stored in an ASCII format file in the project directory.
The data collected above was used in performing the online analysis. The following is a list of parameters examined throughout the course of this analysis. These give a good indication of the quality of the data acquired.
• Verifying the value of the shaft rps, model forward speed, and heading angle as being correct.
• Comparing the standard deviation of the motion channels output by QUALISYS and MotionPak II.
• Reviewing the signal integrity channels for evidence of signal loss. If significant signal loss was detected during critical segments of the run, the run was normally repeated.
• Plotting and comparing the pitch and roll angle data output from QUALISYS on the same time base as the integrated roll and pitch rate data from the MotionPak II.
8.2 Offline Data Analysis
The data from the model test in GEDAP format, was scaled from the model-scale to full scale using the scale factor of 10.67. Most of the data channels could be used directly after they were scaled, however, modifications were required to achieve better data on some channels. For example, the QUALISYS data was de-spiked to remove some dropouts. The spikes seen on the QUALISYS data are a result of the tracking cameras losing sight of the markers located on the model.
A routine was executed to transform QUALISYS linear displacements (X, Y, Z) to the model centre of gravity. QUALISYS motions were derived from an origin located at the bottom of the hull amidships. Because of this, the motions were moved 7.75 cm aft, 13.65 cm down, and 2.25 cm to port (model scale), in order to transfer the origin to the center of the gravity. QUALISYS motions were derived at the centre of gravity for the runs.
Now that all of the required corrections have been made, all of the data is in the required form, and analysis can be done. The following 18 channels are enough to cover the full range of data analysis required for the seakeeping experiment:
CHANNEL DESCRIPTION UNITS 001 MP_Surge Displacement m 002 MP_Surge_Acceleration m/s2 003 MP_Sway_Displacement m 004 MP_Sway_Acceleration m/s2 005 MP_Heave_Displacement m 006 MP_Heave_Acceleration m/s2 007 MP_Yaw_Angle deg. 008 MP_Yaw_Rate deg./s 009 MP_Pitch_Angle deg. 010 MP_Pitch_Rate deg./s 011 MP_Roll_Angle deg.