HAL Id: hal-00592439
https://hal.archives-ouvertes.fr/hal-00592439
Submitted on 6 Jul 2011HAL is a multi-disciplinary open access
archive for the deposit and dissemination of sci-entific research documents, whether they are pub-lished or not. The documents may come from teaching and research institutions in France or abroad, or from public or private research centers.
L’archive ouverte pluridisciplinaire HAL, est destinée au dépôt et à la diffusion de documents scientifiques de niveau recherche, publiés ou non, émanant des établissements d’enseignement et de recherche français ou étrangers, des laboratoires publics ou privés.
Roles of heat shock factor 1 and 2 in response to
proteasome inhibition: consequence on p53 stability.
Sylvain Lecomte, Fabienne Desmots, Florent Le Masson, Pascale Le Goff,
Denis Michel, Elisabeth Christians, Yves Le Dréan
To cite this version:
Sylvain Lecomte, Fabienne Desmots, Florent Le Masson, Pascale Le Goff, Denis Michel, et al.. Roles of heat shock factor 1 and 2 in response to proteasome inhibition: consequence on p53 stability.. Onco-gene, Nature Publishing Group, 2010, 29 (29), pp.4216-24. �10.1038/onc.2010.171�. �hal-00592439�
Roles of Heat Shock Factor 1 and 2 in response to
proteasome inhibition: consequence on p53 stability.
S Lecomte1, F Desmots1, F Le Masson2, P Le Goff1, D Michel1, ES Christians2 and Y Le Dréan1.
1Homéostasie Intracellulaire des Protéines, UMR CNRS 6026, Interactions Cellulaires et
Moléculaires, IFR 140 –Génomique Fonctionnelle Agronomie et Santé-, Université de Rennes1, 35042 Rennes, France.
2Centre de Biologie du Développement, UMR CNRS 5547, Université Toulouse 3, 31062
Toulouse, France
Mailing address for corresponding author:
Dr Yves LE DREAN.
Équipe « Homéostasie intracellulaire des protéines » (Hip), UMR CNRS 6026, Université de
Rennes 1, Bat. 13, campus de Beaulieu,35 042 Rennes Cedex, France.
E-mail: yves.le-drean@univ-rennes1.fr
Tel: +33 (0)2 23 23 50 95
Running Title: HSF2-dependent expression of proteasome subunits Key words: Heat shock factor, MG132, Proteasome, Gankyrin, p53.
Abstract
A single Heat Shock Factor (HSF), mediating the heat shock response, exists from yeast to
Drosophila, while several related HSFs have been found in mammals. This raises the question
of the specific or redundant functions of the different members of the HSF family and in particular of HSF1 and HSF2 which are both ubiquitously expressed. Using immortalized
mouse embryonic fibroblasts (iMEFs) derived form either wild-type, Hsf1-/-, Hsf2-/- or
double-mutant mice, we observed distinctive behaviors of these double-mutants with respect to proteasome
inhibition. This proteotoxic stress reduces to the same extent the viability of Hsf1-/- and Hsf2
-/-deficient cells, but through different underlying mechanisms. Contrary to Hsf2-/- cells, Hsf1
-/-cells are unable to induce prosurvival Heat Shock Protein (HSP) expression. Conversely,
proteasome activity is lower in Hsf2-/- cells and the expression of some proteasome subunits,
such as Psmb5 and gankyrin is decreased. Since gankyrin is an oncoprotein involved in p53 degradation, we analyzed the status of p53 in HSF-deficient iMEFs and observed that it was
strongly stabilized in Hsf2-/- cells. This study points a new role for HSF2 in the regulation of
protein degradation and suggests that pan-HSF inhibitors could be valuable tools to reduce chemoresistance to proteasome inhibition observed in cancer therapy.
Introduction
Vertebrate genome contains 3 to 5 members of the Heat Shock Transcription Factor (HSF) family (for review see Pirkkala et al., 2001; Akerfelt et al., 2007). Within this family, HSF1 and HSF2 possess close related DNA-binding domains but they exhibit some slight differences in Heat Shock Element (HSE) recognition (Kroeger and Morimoto, 1994; Yamamoto et al., 2009), suggesting that both factors control different set of genes. HSF1 represents the archetypal stress transcription factor, rapidly activated by a large variety of proteotoxic stimuli. It regulates the stress inducible expression of Heat Shock Proteins (HSPs) but also controls numerous other genes as demonstrated by transcriptome analysis (Trinklein
et al., 2004). Recently, it was shown that HSF1, by favouring cellular adaptation and survival
in response to environmental stress, also enhances oncogenic transformation (Dai et al., 2007). In comparison to HSF1, HSF2 is a less efficient transcriptional activator and appears to be differently responsive to stimuli (Sistonen et al., 1992). However, inhibition of the proteasome activates both, HSF1 and HSF2 (Kawazoe et al., 1998). Proteasome inhibition leads to the accumulation of misfolded proteins and consequently induces expression of all the major HSPs (Bush et al., 1997), but Pirkkala and coworkers (Pirkkala et al., 2000), clearly showed that HSF1, but not HSF2, plays a key role in this induction. Nevertheless, to add to
the complexity of this proteotoxic response, our group showed that a HSF1/HSF2 heterocomplex was present on the promoter of the chaperone gene Clusterin, following proteasome inhibition (Loison et al., 2006). The existence of HSF1/HSF2 heterotrimer was recently confirmed (Sandqvist et al., 2009) and it was demonstrated that HSF2 can act as a modulator of HSF1 activity in response to proteotoxic insults (Ostling et al., 2007). Hence, the respective role of HSF1 and HSF2 remains unclear when cells are exposed to proteasome inhibitors.
The proteasome/ubiquitin system constitutes the major pathway for regulated degradation of intracellular proteins. The proteasome holoenzyme is a large multi-subunit complex composed of a 20S proteolytic core particle associated with one or two 19S regulatory particles (Pickart and Cohen, 2004). The 20S core particle is a cylindrical structure made up of four heteromeric rings. The two outer rings are composed of seven different α subunits (named α1 to α7), whereas the two inner rings are composed of seven different β subunits (β1-β7) and formed the catalytic chamber. Although these subunits are evolutionary related and similarly conserved, only β1, β2 and β5 possess proteolytic properties. The 19S regulatory particle comprises approximately eighteen distinct subunits that form a lid controlling the access to the catalytic core particle. Proteins destined to be degraded by proteasome must be conjugated to multi-ubiquitin chain for recognition by the 19S regulatory particle. Dysfunction of the proteasome pathway can lead to many disorders, including cancers and neurodegenerative diseases (Paul, 2008). Proteasome is crucial for the regulation of cell cycle and apoptosis and its specific inhibition by molecules has emerged as a promising strategy to treat cancers (Nencioni et al., 2007). For example, bortezomib (also known as PS-341 or Velcade®) is the first proteasome inhibitor used in the treatment of multiple myeloma (Twombly, 2003). In addition, proteasome inhibition may modulate many other transcriptional events (Muratani and Tansey, 2003) and the activity of stress-related transcription factors, such as p53 and HSFs.
To determine the contribution of HSF2 versus HSF1 in cell response to proteasome inhibitors, we used immortalized Mouse Embryonic Fibroblasts (iMEFs) derived from wild type (WT), Hsf1 and/or Hsf2 knock-out (KO) mice (McMillan et al., 1998; McMillan et al., 2002). We found that both factors are essential for cell viability but have distinct actions: as previously shown, HSF1 is required in the induction of pro-survival HSP expression and in contrast, HSF2 is involved in the regulation of proteasome subunit expression.
Results
Proteasome inhibition is severely toxic for HSF1 and/or HSF2-deficient cells.
To determine the specific contribution of HSF1 and HSF2 to the cellular response to proteasome inhibition, we first examined the cytotoxic effect of two proteasome inhibitors: the peptide aldehyde MG132, a reversible inhibitor and the peptide epoxyketone Epoxomicin, an irreversible inhibitor. To assess viability of iMEFs cells, we utilized the quantitative colorimetric MTT test as cytotoxicity assay and we established concentration-effect curves after a 16 h treatment. With high concentrations of MG132 (830 nM) or Epoxomicin (250
nM) Hsf1-/-, Hsf2
or Hsf1-/- & Hsf2-/- iMEFs were significantly more sensitive to these
proteasome inhibitors than WT cells (Student’s t-test, p < 0.05 and p<0.001 respectively) (Fig. 1A and 1B, respectively). By comparison, we treated cells with Thapsigargin that induces a proteotoxic stress specific to the reticulum endoplasmic without affecting
proteasome activity and without activating HSF. In contrast to proteasome inhibition,
Thapsigargin treatment had the same effect on the four cell lines. These data clearly showed that the higher sensitivity of HSF1- and HSF2-deficient cells was specific to proteasome switch off and was not a direct consequence of a general alteration of stress response in these KO cells (Fig. 1 C).
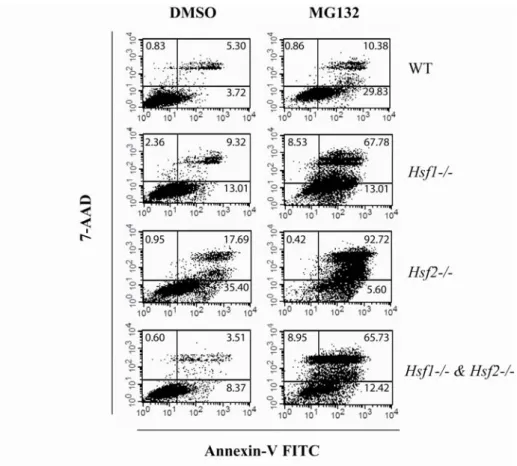
To evaluate whether the decline of MTT values after proteasome inhibition was due to an antiproliferative or a cytotoxic effect, we conducted a flow cytometric analysis of cellular viability. The WT or HSF-deficient iMEFs were treated for 16 h with 1 µM of MG132, and then apoptotic levels were determined by staining with annexin V-fluorescein isothiocyanate (FITC) and 7-aminoactinomycin D (7-AAD) (Fig. 1 D and supplemental Fig. S1). Mortality of all the cell lines was increased in MG132 treated samples, and apoptosis level in HSF-deficient cells was found 2 fold higher compared to WT cells. These data revealed that both factors, HSF1 and HSF2, are critical for cell survival when proteasome is inhibited.
HSP induction is differently affected in Hsf1-/- and Hsf2-/- iMEFs
HSPs are important chaperones induced by proteotoxic stress where they contribute to cell death resistance (Beer HM, 2005). Thus we analysed the inducible expression of two HSPs: HSP70 and HSP25. Messenger RNA levels of Hsp25 and Hsp70 in WT, HSF1 and/or HSF2-deficient iMEFs were compared in absence or presence of MG132 (Fig. 2A and 2B).
After MG132 exposure, only iMEFs expressing HSF1 (either WT or Hsf2-/-) were able to
exhibit a strong induced expression of both chaperones, whereas iMEFs deficient in HSF1
and Hsp25 is highly dependent on the presence of HSF1. These results were confirmed by immunoblot (Fig. 2C), HSP25 and HSP70 are strongly increased in WT cells but not in
HSF1-depleted cells (Hsf1-/- and Hsf1-/- & Hsf2-/-). Moreover, HSF2-depleted cells display
higher levels of HSP25 and HSP70 than those observed in WT iMEFs – wich could be explained by a lower level of protein degradation and thus an increase in protein’s half-life in
those Hsf2-/- cell lines. Hence, it was unlikely that the high sensitivity of Hsf2-/- cells to
proteasome inhibition could be explained by the lack of HSPs. This suggested that another mechanism should be involved.
Proteasome activity is decreased in Hsf2-/- iMEFs
To test this possibility that proteasome function would be natively affected, an in vitro assay based on the measurement of the chymotrypsin-like activity of proteasome present in crude protein extract was first used. Secondly, the proteasome activity at the cellular level was evaluated, by setting up an assay based on the degradation of a proteasome-targeted protein.
A fluorescent proteasome substrate (Z-LLVY-AMC) was incubated with cellular extracts from the different iMEFs cell lines. This peptide was hydrolyzed by chymotrypsin-like activity of proteasome releasing the fluorophore that could be assessed with a
spectrofluorimeter (Fig. 3A). Hsf2-/- and Hsf1
& Hsf2-/- cellular extracts contain a lower
amount of active proteasome (0.36 +/- 0.11 and 0.21 +/- 0.04, respectively) compared to WT
iMEFs (0.96 +/- 0.20). Decrease of proteasome activity measured in Hsf1-/- cells (0.63 +/-
0.14) was less striking but still significant. To ascertain that measured fluorescence was due to proteasome activity, crude extracts were incubated with the peptide and 10 µM of MG132 and no fluorescence could be measured, indicating that this inhibitor clearly abolished the previously assessed activity.
To confirm in vivo this observation at the cellular level, expression vector coding for the fusion protein uncleavable Ubiquitin-Green Fluorescent Protein (Ubi-GFP) was transfected in iMEFs. The mutated non cleavable ubiquitin moiety within the fusion protein serves as template to poly-ubiquitination, which is addressed to proteasome for degradation. Thus, intracellular accumulation of the unstable Ubi-GFP requires partial or total inhibition of proteasome/ubiquitin system. Ubi-GFP expression vector was co-transfected with a plasmid coding for EGFP, as internal control to evaluate the difference of transfection efficiencies between the iMEFs cell lines. Then, the protein levels of GFP were probed by immunoblotting, using the same antibody (Fig. 3B). In all cell lines (except the double knock-out iMEFs), the EGFP control is highly expressed, demonstrating that the transfections were
equally efficient. We found that in WT and Hsf1-/- cells, the Ubi-GFP specific bands were not
visible in untreated cells while it became slightly detectable when cells were incubated with 1 µM of MG132. These data showed that Ubi-GFP was efficiently targeted to proteasomal degradation and demonstrated that exposure to 1 µM MG132 could not block totally the intracellular proteasome activity. By contrast, Ubi-GFP was significantly more stable in cells
deficient in HSF2 (Hsf2-/- and Hsf1
& Hsf2-/-), especially after MG132 treatment (Fig. 3B,
lanes 6 and 8, respectively). This indicated that HSF2-deficient cells exhibited a reduced proteasome activity either due to functional defect or reduced amount of the proteasome machinery in comparison to WT.
Partial but significant depletion of Ubiquitin-proteasome machinery in Hsf2-/- iMEFs To determine whether the decrease of proteasome activity was linked to reduced level of proteasome subunit expression, 10 subunits were selected (5 located in the 20S particle and 5 located in the 19S particle – Table 1) based on the work of Kruger’s team about proteasome expression in response to proteasome inhibition (Meiners et al., 2003) and the level of transcripts was analyzed by real time PCR analysis. The expression level of two ubiquitin genes (Ubb and Ubc) was also analyzed. As summarized in Table 1, a decreased expression was observed in absence of HSF1 for some proteasome subunits and for Ubb and Ubc but at a lower level than observed in HSF2-deficient cells. In fact, the level of the majority of the 20S and 19S subunits likewise the two ubiquitin genes decreased by a factor 2 or 3 fold in HSF2-deficient cells. However, mRNA levels of two subunits, Psmb4 and Psmc5 were unchanged in HSF-deleted cells compared to WT, suggesting that all constitutive subunits are not regulated in the same way. In addition, it is interesting to note that the level of the β5 catalytic
subunit (Psmb5) was significantly lower in Hsf2-/- and Hsf1
& Hsf2-/- cells (Table 1 and Fig.
4A), which is consistent with the decrease of proteasome activity measured in these cells (Fig. 3). To ascertain that this decrease of expression was due to the lack of HSF2, we stably
transfected Hsf2-/- iMEFs with a plasmid coding for HSF2 or a control vector (Fig. 4C and
supplemental Fig. S2). Reintroduction of HSF2 allowed a rescue of Psmb5 expression which was 2-3 fold higher in transfected cells with Hsf2 vector in comparison to empty vector.
Increased stability of p53 in HSF2-depleted cells
As shown in Fig. 4B, Psmd10 or gankyrin, an oncogene overexpressed in human hepatic cancers (Higashitsuji et al., 2000) was 2-4 fold down-regulated in HSF2-deficient iMEFs and its expression was totally rescued when cells were transfected with Hsf2 vector
(Fig. 4D). As gankyrin is also known to interact with the MDM2 ubiquitin ligase and to play a pivotal role in controlling the level of p53 by proteasomal degradation (Higashitsuji et al., 2005), we wanted to determine whether the lower level of gankyrin affects intracellular p53 concentration. Using untreated cells, in immunoblot assay, endogenous p53 was hardly visible
in WT and Hsf1-/- iMEFs, whereas it was dramatically increased in both Hsf2-/- and in Hsf1
-/-& Hsf2-/- iMEFs (Fig. 5A). Real time PCR analysis revealed that there was no significant
increased level of p53 transcripts in cell lines which exhibited higher p53 protein content, suggesting that this p53 up-regulation in HSF2-deficient cells was due to protein stabilization (Fig. 5B). Finally, a pulse-chase experiment using p53 antibody was performed to assess p53 half-life in our model. As shown in Fig. 5C, endogenous p53 in WT iMEFs exhibited a very
short half-life (less than 1 h). In Hsf1-/- iMEFs p53 half-life was slightly longer than in WT
cells as previously described (Jin et al., 2009). P53 was yet detected after 2 hours of chase. This result was in accordance with the decrease of proteasome activity, observed in HSF1-deleted cells. In sharp contrast with this modest increased stability, p53 was dramatically
stabilized to a half-life of more than 9 h, in Hsf2-/- cells. To confirm this stabilization, p53
immunoblotting was performed in primary MEF from WT, Hsf1-/- and/or Hsf2-/- mice. In
those cells, the basal endogenous p53 was not detectable (Fig. 5D). In contrast, when cells
were treated with 1 µM of MG132, p53 was slightly increased in WT and Hsf1-/- MEFs
whereas a strong accumulation was detectable in Hsf2-/- and Hsf1
& Hsf2-/- MEFs. All
together our data suggest that proteasome and gankyrin down-regulations in Hsf2
cells are
accompanied by stabilization of the short-lived protein p53.
Discussion
Proteasome inhibition causes an accumulation of altered proteins, generating a proteotoxic stress, which was shown to simultaneously activate both HSF1 and HSF2 (Kawazoe et al., 1998). Nevertheless the respective roles of HSF1 and HSF2 remained unclear. We took advantage of genetically modified cells to further clarify the specific function of each factor in the cellular response to such a stress. We found that HSF1 and HSF2 were both critical for the resistance to proteasome inhibition. However, HSF1 and HSF2 are involved in different mechanisms.
HSF1 deficiency dramatically prevented the induced expression of Hsp25 and Hsp70 after proteotoxic stress. This was in agreement with previous works showing that HSF1 is the major factor involved in proteotoxic response and that it could not be compensated by HSF2 alone (Pirkkala et al., 2000). As HSP25 and HSP70 promote cellular survival by preventing
protein aggregation, facilitating refolding and directly inhibiting apoptotic signalling (Beere et
al., 2000; Bruey et al., 2000), Hsf1-/- cells lacked an important protective mechanism which
could explain the observed reduction in cell survival. In contrast to Hsf1 deletion, Hsf2 deletion did not prevent induction of Hsp25 and Hsp70 expression. Thus, the high expression
of protective HSP in Hsf2-/- iMEFs led us to conclude that HSF2 and cell sensitivity to
proteasome inhibition were linked by a different mechanism. According to this hypothesis, we were interested to proteasome subunit expression and found that it was particularly affected in
Hsf2-/- cells.
Little is known about the regulation of basal expression of mammalian proteasome subunits. Recently, one study suggested that each type of proteasome subunits could be regulated by common unknown transcription factors (Sato et al., 2009). It was found that inactivation of HSF1 does not alter proteasome expression (Taylor et al., 2005) and our data
are in accordance with this report as we show that Hsf1-/- iMEFs exhibit a slight but not
significant decrease of proteasome subunit expression. However, this slight decrease could be explained by interdependence between HSF2 and HSF1 (Loison et al., 2006; Sandqvist et al., 2009). Thus, one could hypothesize that the lack of HSF1 would affect HSF2 binding and consequently reduce HSF2 activity.
Currently, we do not know if HSF2 regulates proteasome subunit expression indirectly or by direct binding to the promoters of the corresponding genes. By in silico analysis we searched for the presence of HSE, within genes encoding proteasome subunits and found that the majority of those genes possess putative degenerated HSEs. For example, the gankyrin gene contains a conserved HSE into its first intron. This sequence was able to bind HSF in electrophoretic mobility shift assay, but we hardly detected in vivo HSF2 binding by chromatin immunoprecipitation assay (data not shown). The difficulty of detecting HSF2 bound to gankyrin HSE could be explained by the fact that this interaction could be very transient. Recently, HSF2 was found to ephemerally bind to Hsp promoters during mitosis and that interaction favoured the basal expression of Hsps. (Xing et al., 2005; Wilkerson et
al., 2007). So, it is possible that the role of HSF2 in bookmarking that maintains an open
chromatin at the promoters of certain genes entails the constitutive expression level of proteasome subunits. To test this hypothesis, Formaldehyde Assisted Isolation of Regulated Element assay was performed (supplemental Fig. S3) and showed that chromatin was more compacted at gankyrin transcription start site in HSF-deficient cells than in WT cells. However, another mechanism described in yeast could be implicated. An indirect transcriptional network involving HSF and RPN4 was demonstrated (Hahn et al., 2006). This
latter protein corresponds to the main transcription factor implied in the expression of yeast proteasome subunits but no mammalian homolog has been described to date.
The decreased expression of proteasome subunits has consequence for cell physiology. Alteration of proteasome activity has been implicated in the pathogenesis of cancers (Schwartz and Ciechanover, 1999) and in some cells, a clear relationship has been established between increased expression of proteasome and proliferation or resistance to apoptosis (Fuchs et al., 2008). We found that decrease of catalytic subunit β5 and gankyrin in HSF2-depleted cells was accompanied by p53 stabilization. It would be interesting to determine
whether re-introduction of gankyrin in Hsf2-/- iMEF could restore the level of p53, knowing
that it was already demonstrated that gankyrin overexpression accelerates the degradation of p53 in various cell models, including MEF (Higashitsuji et al., 2005). Mivechi’s group described a mechanism linking HSF1-deficiency and p53 stabilization (Homma et al., 2007; Jin et al., 2009). Our study confirms a role for HSF1 in the regulation of p53 with a slight stabilization of this protein in pulse chase experiment compared to WT cells. However, our work completes the mechanism by introducing HSF2 as a new actor. The iMEFs used in this study have been immortalized with T antigen of SV40 virus that is known to bind to p53 and blocks its transcriptional activity (Pipas and Levine, 2001) which could permit its stabilization in our model. However our results (p53 stabilization) were confirmed by p53 immunoblot in primary MEFs. Furthermore, it was found that SV40 transformation does not affect the
protein control machinery (Cantalupo et al., 2009), which emphasizes that the decrease of
ubiquitin-proteasome system expression is related to the loss of Hsf2 gene confirmed by HSF2 rescue.
Development of inhibitors of both HSF1 and HSF2 could be a valuable approach to increase effectiveness of cancer therapy. By blocking HSF1, it is possible to alter the adaptive transcriptional response that allows the expression of anti-apoptotic chaperones (Zaarur et al., 2006). Therapeutic use of proteasome inhibitors remains limited because of the selection of resistant cells. It was found that bortezomib-adapted cells showed increased expression of β5
and β2 proteasome subunits (Oerlemans et al., 2008;Rückrich et al., 2009), and we found that
one of these subunits was down-expressed in absence of HSF2. Moreover, by blocking HSF2, the level of intracellular proteasome is expected to decrease and potentially to increase the sensitivity to proteasome inhibition, even in resistant clones. Recently, a close correlation was demonstrated between expression levels of proteasome subunits, their enzymatic activity and the sensitivity of cells to proteasome inhibitor (Busse et al., 2008). Finally, a decrease of
gankyrin level in Hsf2-blocked cells would permit overexpression of p53 that will in turn participate in the apoptosis of treated cells.
In conclusion, our work in iMEFs brought new insights in the respective roles of HSF1 and HSF2, the most abundantly expressed HSF in organisms. Beyond these fundamental interests in a better understanding of transcription factor, the data presented here confirm that HSF1 and now HSF2 could be targeted with benefits in cancer therapy.
Materials and methods Cell culture
Mouse Embryonic Fibroblasts Wild Type (WT), deleted for HSF1 (Hsf1-/-), HSF2 (Hsf2-/-) or
both genes (Hsf1
& Hsf2-/-) were isolated from KO mice (McMillan et al., 1998 ; McMillan et al., 2002) and were immortalized using SV40 T antigen by Dr V. Mezger (UMR CNRS
7216, Paris, France). Cells were maintained in DMEM 4500 mg/L glucose (Gibco, CA, USA) supplemented with 10 % Fetal Bovine Serum (Biowest, France), 4 mM L-glutamine, Non Essential Amino-Acids and 100 Units/mL penicillin, 100 mg/mL streptomycin (Gibco, CA,
USA). All cells were grown at 37°C under 5 % CO2.
For rescue experiments Hsf2-/- iMEFs were stably transfected with plasmid coding for Hsf2α
and HSF2 expression was confirm by RT-PCR and HSF2 immunoblotting in each selected clone (supplemental Fig. S2).
Plasmid constructs and transfection
An ubiquitin tagged green fluorescent protein (GFP) was previously used to quantify ubiquitin-proteasome dependent proteolysis in living cells (Dantuma et al., 2000). For this purpose, the DNA fragment from the pDG268 plasmid (kindly provided by Dr D. Gray, university of Ottawa, Canada), encoding an ubiquitin-EGFP fusion protein (Tsirigotis et al., 2001), was transferred into pCDNA3 expression vector (Invitrogen Life science, CA, USA). Then, the carboxy-terminal glycine in ubiquitin was converted into a valine using the site directed mutagenesis kit QuickChange (Stratagene, CA, USA), to block cleavage of the ubiquitin moiety by cellular de-ubiquitinases and thus render the entire fusion prone to degradation by the ubiquitin-proteasome system. The vector coding for non cleavable ubiquitin fused to GFP (Ubi-GFP) was co-transfected with a plasmid coding for EGFP (pEGFP-C3, Clontech, CA, USA), as internal control of transfection efficiency. All transfections were performed with JetPEI (Polyplus Transfection, France), according to manufacturer’s instructions. Cells were harvested after 24 h of transient expression and 7 h of
treatment with DMSO or 1 µM of MG132 (Biomol, PA, USA). Relative quantity of these two GFP proteins was assessed by immunoblotting using anti-GFP antibodies (Invitrogen Life Science, CA, USA).
Cell toxicity assay (MTT assay)
WT, Hsf1-/-, Hsf2
and Hsf1-/- & Hsf2-/- iMEFs were spread in 96 wells-plate and were treated
with increasing doses of proteasome inhibitors Epoxomicin (Sigma Aldrich, MO, USA), MG132 (Biomol, PA, USA), or with Thapsigargin (Sigma Aldrich, MO, USA), an inductor of endoplasmic reticulum stress. Cells were treated at the indicated concentration for 16 h. Following treatment, MTT [1-(4,5-Dimethylthiazol-2-yl)-3,5-diphenylformazan] (Sigma Aldrich, MO, USA) was added to cells at final concentration of 0.5 mg/ml. Cells were
incubated for 3 h at 37°C under 5 % CO2. The medium was then discarded and formazan
crystals were dissolved in 100 µl of isopropanol with 0.1 % SDS and 0.05 N HCl for 1 h at obscurity. Absorbance was read at 570 nm and results were expressed as percentage of untreated cells.
Real Time PCR analysis
One million cells for each iMEFs lines was plated into 10 cm plate and harvested after 24 h of culture. Total RNAs were extracted with Trizol reagent (Invitrogen Life Science, CA USA) according to the manufacturer’s procedure. Then 5 µg of RNA were retrotranscribed using M-MLV RT (Invitrogen Life Science, CA USA). Real time PCR was performed using 12.5 ng of cDNA, 300 nM of primers (referred to supplemental data) and 1X SybrGreen, on MiniOpticon Real Time PCR (Bio-Rad, CA, USA). Amplification of each studied gene was normalized using amplification of three housekeeping genes Gapdh (Glyceraldehyde-3-phosphate dehydrogenase), Hprt1 (Hypoxanthine guanine phosphoribosyl transferase 1) and Tbp (TATA box binding protein). Data were analysed using qBase software (Hellemans et
al., 2007).
Measurement of proteasome activity
Proteasome activity was measured in accordance with the protocol described by Kisselev and Goldberg (Kisselev and Goldberg, 2005). Briefly, cells were harvested in a lysis buffer that maintained 26S proteasome integrity. After incubation on ice during 45 min, the cytosols were squeezed out by centrifugation at 14000 rpm at 4°C for 15 min. 15 µg of proteins were loaded on opaque white 96 well-plates. Volume was adjusted at 90 µl with 26S proteasome
assay buffer. Thereafter, 10 µl of Z-LLVY-AMC (Calbiochem, England) at 1 mM stock solution was added and plate was incubated at 37°C. Fluorescence was measured after 15 min and 30 min using a fluorimeter (Dynatech Laboratories, VA, USA) with excitation at 365 nm wavelength and emission at 450 nm wavelength.
Protein extracts and immunoblot analyses
Cells extracts were prepared using osmotic shock methods like previously described (Loison
et al., 2006). Protein extracts were separated on polyacrylamide gel and transferred to
nitrocellulose membrane (Amersham Bioscience, England). Anti-Hsp25 (sc-1084), anti-Hsp70 (SPA-810), anti-β-actin (A-1978) antibodies were purchased from Santa Cruz Biotechnology (CA, USA), Stressgen (MI, USA) and Sigma Aldrich (MO, USA) respectively. Anti-p53 antibody was a gift from Dr T. Soussi, Université Pierre et Marie Curie, Paris, France.
Pulse-Chase Assays
Wild type, Hsf1-/- and Hsf2-/- iMEFs were washed with PBS and preincubated for 30 min with
methionine- and leucine-free DMEM, containing 10 % dialyzed Fetal Bovine Serum and 4 mM glutamine. Cells were labeled for 1 h 30 in the same medium with 10 µCi/ml of
L-[35S]methionine (PerkinElmer, France), and chased in complete media. At various times after
termination of labeling, cells were isolated in PBS 0.5% Triton X-100 supplemented by protease inhibitors (Roche Applied Science, France) and incubated 30 min on ice. Proteins were immunoprecipitated overnight at 4°C with 5 µg of monoclonal anti-p53 antibody in PBS supplemented with NaCl 600nM, Triton X-100 4% and protease inhibitors (Roche Applied Science, France). Immune complexes recovered by protein-G Sepharose were washed three times with PBS supplemented with Triton X-100 1% and NaCl 150 mM. Immune complexes were electrophoretically separated on SDS-PAGE gels. Gels were fixed and dried and
subjected to autoradiography. Corresponding lysates (lysates 35S) were loaded as control for
equal amount of proteins, as well as equal incorporation of 35S.
Acknowledgements
This work was supported by Cancéropole Grand Ouest and CNRS. SL & FLM were supported by fellowship from the French ministry of higher education and research (MENRT), and FD by fellowship from the “Association pour la Recherche sur le Cancer” (ARC). We thank Dr V. Mezger (UMR CNRS 7216, Paris, France) for the gift of immortalized MEFs, and V. Noel for
the help in in silico analysis. We thanks too Frédéric Percevault for the establishment of stable
clone expressing HSF2 from Hsf2-/- iMEFs.
Supplementary information is avalaible at the Oncogene website
References
Akerfelt M, Trouillet D, Mezger V, Sistonen L. (2007). Heat shock factors at a crossroad between stress and development. Ann N Y Acad Sci. 1113:15-27
Beere HM, Wolf BB, Cain K, Mosser DD, Mahboubi A, Kuwana T, et al. (2000). Heat-shock protein 70 inhibits apoptosis by preventing recruitment of procaspase-9 to the Apaf-1 apoptosome. Nat Cell Biol. 2:469-475.
Beere HM. (2005). Death versus survival: functional interaction between the apoptotic and the stress- inducible heat shock protein pathways. J Clin Invest. 115:2633-2639
Bruey JM, Ducasse C, Bonniaud P, Ravagnan L, Susin SA, Diaz-Latoud C, et al. (2000). Hsp27 negatively regulates cell death by interacting with cytochrome c. Nat Cell Biol. 2:645-652.
Bush KT, Goldberg AL, Nigam SK. (1997). Proteasome inhibition leads to a heat-shock response, induction of endoplasmic reticulum chaperones, and thermotolerance. J Biol Chem.
272:9086-9092.
Busse A, Kraus M, Na IK, Rietz A, Scheibenbogen C, Driessen C, et al. (2008). Sensitivity of tumor cells to proteasome inhibitors is associated with expression levels and composition of proteasome subunits. Cancer. 112:659-670.
Cantalupo PG, Sáenz-Robles MT, Rathi AV, Beerman RW, Patterson WH, Whitehead RH, et
al. (2009). Cell-type specific regulation of gene expression by simian virus 40 T antigens. Virology. 386:183-191
Dai C, Whitesell L, Rogers AB, Lindquist S. (2007). Heat shock factor 1 is a powerful multifaceted modifier of carcinogenesis. Cell. 130:1005-1018.
Dantuma NP, Lindsten K, Glas R, Jellne M, Masucci MG. (2000). Short-lived green fluorescent proteins for quantifying ubiquitin/proteasome-dependent proteolysis in living cells. Nat Biotechnol. 18:538-543.
Fuchs D, Berges C, Opelz G, Daniel V, Naujokat C. (2008). Increased expression and altered subunit composition of proteasomes induced by continuous proteasome inhibition establish apoptosis resistance and hyperproliferation of Burkitt lymphoma cells. J Cell Biochem.
103:270-283.
Hahn JS, Neef DW, Thiele DJ. (2006). A stress regulatory network for co-ordinated activation of proteasome expression mediated by yeast heat shock transcription factor. Mol Microbiol.
60:240-251.
Hellemans J, Mortier G, De Paepe A, Speleman F, Vandesompele J. (2007). qBase relative quantification framework and software for management and automated analysis of real-time quantitative PCR data. Genome Biol. 8:R19.
Higashitsuji H, Itoh K, Nagao T, Dawson S, Nonoguchi K, Kido T, et al. (2000). Reduced stability of retinoblastoma protein by gankyrin, an oncogenic ankyrin-repeat protein overexpressed in hepatomas. Nat Med. 6:96–99
Higashitsuji H, Higashitsuji H, Itoh K, Sakurai T, Nagao T, Sumitomo H, et al. (2005). The oncoprotein gankyrin binds to MDM2/HDM2, enhancing ubiquitylation and degradation of p53. Cancer Cell. 8:75-87.
Homma S, Jin X, Wang G, Tu N, Min J, Yanasak N, et al. (2007). Demyelination, astrogliosis and accumulation of ubiquitinated proteins, hallmarks of CNS disease in hsf1-deficient mice.
J Neurosci. 27:7974-7986.
Jin X, Moskophidis D, Hu Y, Phillips A, Mivechi NF. (2009). Heat shock factor 1 deficiency via its downstream target gene alphaB-crystallin (Hspb5) impairs p53 degradation. J Cell
Kawazoe Y, Nakai A, Tanabe M, Nagata K. (1998). Proteasome inhibition leads to the activation of all members of the heat-shock-factor family. Eur J Biochem. 255:356-362.
Kisselev AF, Goldberg AL. (2005). Monitoring activity and inhibition of 26S proteasomes with fluorogenic peptide substrates. Methods Enzymol. 398:364-378.
Kroeger PE, Morimoto RI. (1994). Selection of new HSF1 and HSF2 DNA-binding sites reveals difference in trimer cooperativity. Mol Cell Biol. 14:7592-7603.
Loison F, Debure L, Nizard P, le Goff P, Michel D, le Dréan Y. (2006). Up-regulation of the clusterin gene after proteotoxic stress: implication of HSF1-HSF2 heterocomplexes. Biochem
J. 395:223-231.
McMillan DR, Xiao X, Shao L, Graves K, Benjamin IJ. (1998). Targeted disruption of heat shock transcription factor 1 abolishes thermotolerance and protection against heat-inducible apoptosis. J Biol Chem. 273:7523-7528
McMillan DR, Christians E, Forster M, Xiao X, Connell P, Plumier JC, et al. (2002). Heat shock transcription factor 2 is not essential for embryonic development, fertility, or adult cognitive and psychomotor function in mice. Mol Cell Biol. 22:8005-8014.
Meiners S, Heyken D, Weller A, Ludwig A, Stangl K, Kloetzel PM, et al. (2003). Inhibition of proteasome activity induces concerted expression of proteasome genes and de novo formation of Mammalian proteasomes. J Biol Chem. 278:21517-21525
Muratani M, Tansey WP. (2003). How the ubiquitin-proteasome system controls transcription. Nat Rev Mol Cell Biol. 4:192-201.
Nencioni A, Grünebach F, Patrone F, Ballestrero A, Brossart P. (2007). Proteasome inhibitors: antitumor effects and beyond. Leukemia. 21:30-36.
Oerlemans R, Franke NE, Assaraf YG, Cloos J, van Zantwijk I, Berkers CR, et al. (2008). Molecular basis of bortezomib resistance: proteasome subunit beta5 (PSMB5) gene mutation and overexpression of PSMB5 protein. Blood. 112:2489-2499.
Ostling P, Björk JK, Roos-Mattjus P, Mezger V, Sistonen L. (2007). Heat shock factor 2 (HSF2) contributes to inducible expression of hsp genes through interplay with HSF1. J Biol
Chem. 282:7077-7086.
Paul S. (2008). Dysfunction of the ubiquitin-proteasome system in multiple disease conditions: therapeutic approaches. Bioessays. 30:1172-1184.
Pickart CM, Cohen RE. (2004). Proteasomes and their kin: proteases in the machine age. Nat
Rev Mol Cell Biol. 5:177-187.
Pipas JM, Levine AJ. (2001). Role of T antigen interactions with p53 in tumorigenesis. Semin
Cancer Biol. 11:23-30.
Pirkkala L, Alastalo TP, Zuo X, Benjamin IJ, Sistonen L. (2000). Disruption of heat shock factor 1 reveals an essential role in the ubiquitin proteolytic pathway. Mol Cell Biol. 20:2670-2675.
Pirkkala L, Nykänen P, Sistonen L. (2001). Roles of heat shock transcription factors in regulation of heat shock response and beyond. FASEB J. 15:1118-1131
Rückrich T, Kraus M, Gogel J, Beck A, Ovaa H, Verdoes M, et al. (2009). Characterization of the ubiquitin-proteasome system in bortezomib-adapted cells. Leukemia. 23:1098-1105 Sandqvist A, Björk JK, Akerfelt M, Chitikova Z, Grichine A, Vourc'h C, et al. (2009). Heterotrimerization of heat-shock factors 1 and 2 provides a transcriptional switch in response to distinct stimuli. Mol Biol Cell. 20:1340-1347.
Sato Y, Sakamoto K, Sei M, Ewis AA, Nakahori Y. (2009). Proteasome subunits are regulated and expressed in comparable concentrations as a functional cluster. Biochem
Biophys Res Commun. 378:795-798.
Schwartz AL, Ciechanover A. (1999). The ubiquitin-proteasome pathway and pathogenesis of human diseases. Annu Rev Med. 50:57–74.
Sistonen, L., Sarge KD, Phillips B, Abravaya K, Morimoto RI. (1992). Activation of heat shock factor 2 during hemin-induced differentiation of human erythroleukemia cells. Mol Cell
Biol. 12:4104–4111.
Taylor DM, Kabashi E, Agar JN, Minotti S, Durham HD. (2005). Proteasome activity or expression is not altered by activation of the heat shock transcription factor Hsf1 in cultured fibroblasts or myoblasts. Cell Stress Chaperones. 10:230-241
Trinklein ND, Murray JI, Hartman SJ, Botstein D, Myers RM. (2004). The role of heat shock transcription factor 1 in the genome-wide regulation of the mammalian heat shock response.
Mol Biol Cell. 15:1254-1261.
Tsirigotis M, Thurig S, Dubé M, Vanderhyden BC, Zhang M, Gray DA. (2001). Analysis of ubiquitination in vivo using a transgenic mouse model. Biotechniques. 31:120-130.
Twombly R. (2003). First proteasome inhibitor approved for multiple myeloma. J Natl
Cancer Inst. 95:845.
Wilkerson DC, Skaggs HS, Sarge KD. (2007). HSF2 binds to the Hsp90, Hsp27, and c-Fos promoters constitutively and modulates their expression. Cell Stress Chaperones. 12:283-290 Xing H, Wilkerson DC, Mayhew CN, Lubert EJ, Skaggs HS, Goodson ML, et al. (2005). Mechanism of hsp70i gene bookmarking. Science. 307:421-423.
Yamamoto N, Takemori Y, Sakurai M, Sugiyama K, Sakurai H. (2009) Differential recognition of heat shock elements by members of the heat shock transcription factor family.
FEBS J. 276:1962-1974.
Zaarur N, Gabai VL, Porco JA Jr, Calderwood S, Sherman MY. (2006). Targeting heat shock response to sensitize cancer cells to proteasome and Hsp90 inhibitors. Cancer Res. 66:1783-1791.
Figures
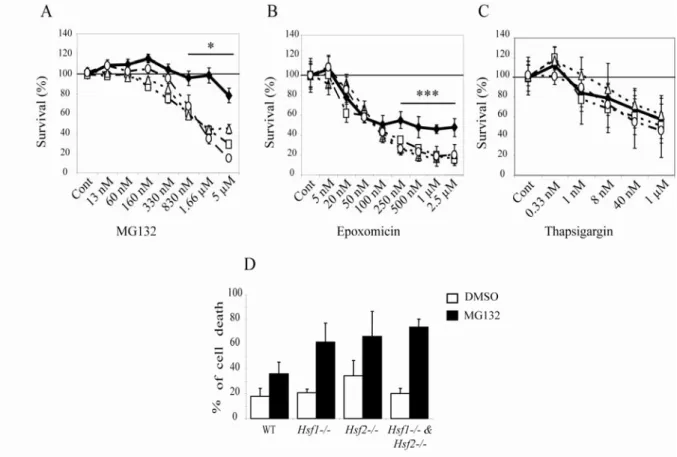
Fig. 1: Increased vulnerability to proteasome inhibition in HSF-deficient cells.
Dose-response curves for cell viability assessment by MTT assay were prepared using immortalized Mouse Embryonic Fibroblasts (iMEFs) exposed to proteasome inhibitors (A, MG132 and B, Epoxomicin) or endoplasmic reticulum stressor (C, Thapsigargin). WT (black diamond),
Hsf1-/- (white square), Hsf2-/- (white triangle) and Hsf1-/- & Hsf2-/- (white circle) iMEFs were
incubated for 16 h with DMSO (Cont) or indicated concentrations of the drugs before being subjected to MTT assay. Results are expressed in percentage of survival compared to DMSO control (Student’s test: each KO cell compared to WT cells. * p<0.05, *** p<0.001). To confirm that decrease of survival was due to apoptosis, cells were treated with 1 µM of MG132 for 16h and apoptosis was assessed by flow cytometry using annexin V-FITC and 7-AAD (D). Results were expressed in percentage of cell death for DMSO (cont) and MG132 treated cells. Data are the means for three to four independent experiments +/- SEM..
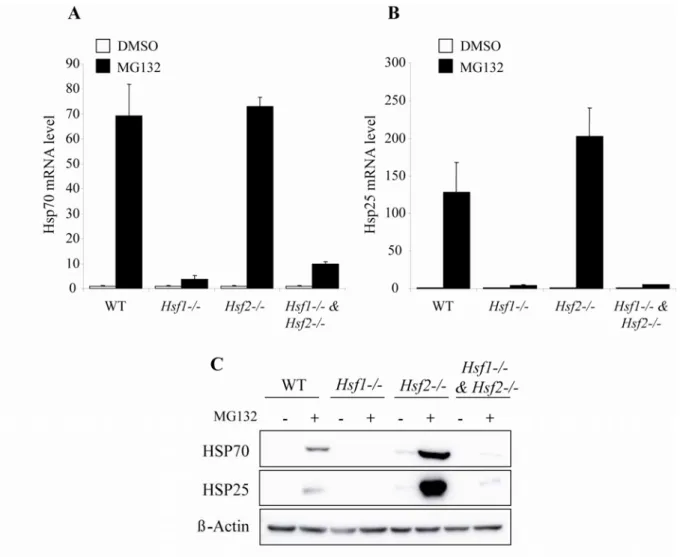
Fig. 2: HSF dependent response of Hsp25 and Hsp70 to proteasome inhibition. WT,
Hsf1-/-, Hsf2-/- and Hsf1-/- & Hsf2-/- iMEFs were treated with DMSO (cont) or with 1 µM of
MG132 for 10 h. Hsp70 (A) and Hsp25 (B) transcript levels were measured by real time PCR. Expression data were normalized by reference genes (see materials and methods) and analyzed with qBase software. Results were expressed in fold induction, normalized to DMSO sample of each cell line. Data are the means of three independent experiments +/- SD. (C) Corresponding immunoblot analysis of HSP70 and HSP25 expression in response to 1
µM of MG132 for 10h in WT, Hsf1-/-, Hsf2
and Hsf1-/- & Hsf2-/- iMEFs. β-actin served as
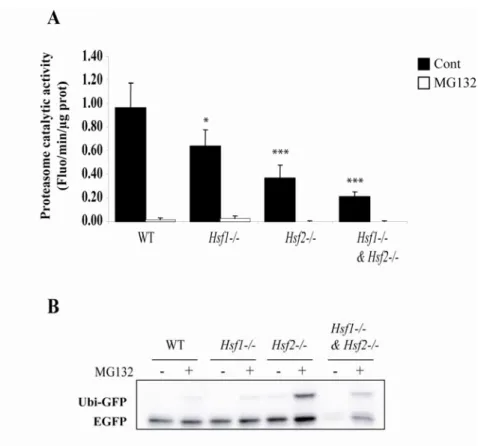
Fig. 3: Proteasome catalytic activity in Hsf-deficient cells. (A) In vitro assay using 15 µg of
protein extracts from WT, Hsf1-/-, Hsf2
and Hsf1-/- & Hsf2-/- iMEFs incubated with 100 µM
of peptide coupled to a fluorophore (Z-LLVY-AMC) in presence of DMSO (cont) or with 10 µM of MG132. The fluorescence was read after peptide cleavage by the proteasome’s chymotrypsin-like activity. The relative catalytic activity was expressed in fluorescence (Arbitrary Unit) per minute per microgram of proteins (Fluo/min/µg of prot). Data are the means for three independent experiments +/- SD (Student’s Test compare to WT cells. * p<0.05, *** p<0.001). (B). In vivo assay: plasmid coding for the fusion protein Ubiquitin-GFP (Ubi-Ubiquitin-GFP) was co-transfected with a plasmid coding for EUbiquitin-GFP used as transfection efficiency control. Ubiquitin part of the fusion protein serves as template for ubiquitination, rending the protein labile. Cells were treated with DMSO (Cont) or with 1 µM of MG132 for 7 h and stabilization of Ubi-GFP protein was assessed by anti-GFP immunoblot.
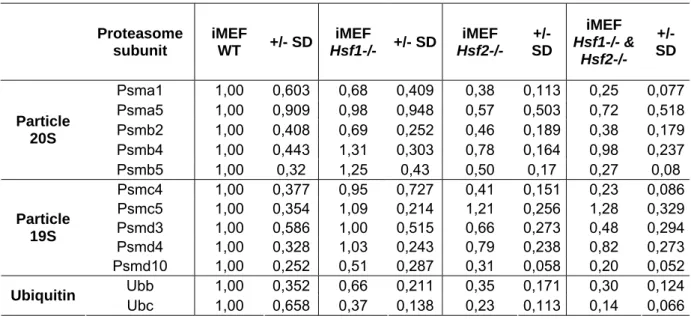
Proteasome subunit iMEF WT +/- SD iMEF Hsf1-/- +/- SD iMEF Hsf2-/- +/- SD iMEF Hsf1-/- & Hsf2-/- +/- SD Psma1 1,00 0,603 0,68 0,409 0,38 0,113 0,25 0,077 Psma5 1,00 0,909 0,98 0,948 0,57 0,503 0,72 0,518 Psmb2 1,00 0,408 0,69 0,252 0,46 0,189 0,38 0,179 Psmb4 1,00 0,443 1,31 0,303 0,78 0,164 0,98 0,237 Particle 20S Psmb5 1,00 0,32 1,25 0,43 0,50 0,17 0,27 0,08 Psmc4 1,00 0,377 0,95 0,727 0,41 0,151 0,23 0,086 Psmc5 1,00 0,354 1,09 0,214 1,21 0,256 1,28 0,329 Psmd3 1,00 0,586 1,00 0,515 0,66 0,273 0,48 0,294 Psmd4 1,00 0,328 1,03 0,243 0,79 0,238 0,82 0,273 Particle 19S Psmd10 1,00 0,252 0,51 0,287 0,31 0,058 0,20 0,052 Ubb 1,00 0,352 0,66 0,211 0,35 0,171 0,30 0,124 Ubiquitin Ubc 1,00 0,658 0,37 0,138 0,23 0,113 0,14 0,066
Table 1: Transcript levels of proteasome subunits and ubiquitin in iMEFs WT and HSF-deficient. RNA level of five subunits of 20S particle, five subunits of the 19S particle and
Ubiquitin B and C were measured by real time PCR and normalized using three reference genes Gapdh, Hprt1 and Tbp. Results are expressed as relative value to WT. Data are the mean for four independent experiments +/- SD.
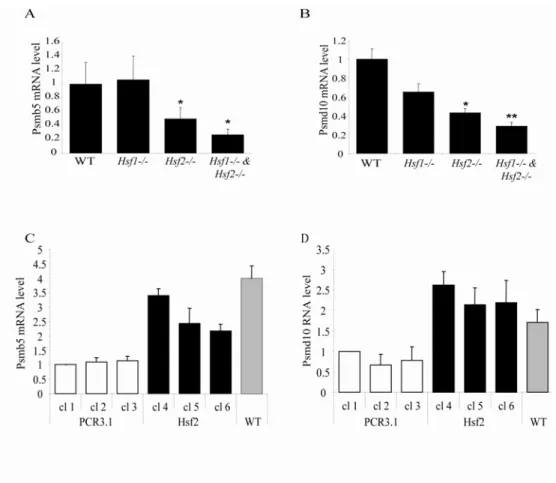
Fig. 4: Transcript levels of proteasome subunits in HSF-deficient iMEFs and HSF2 rescued iMEFs. WT or HSF-deficient iMEFs (Hsf1-/-. Hsf2
and Hsf1-/- & Hsf2-/-) were
plated and total RNA were extracted the day after. Relative basal expression of two proteasomal subunits Psmb5 (A) and Psmd10 (B) were assessed by real time PCR and normalized using three reference genes Gapdh, Hprt1 and Tbp. Transcript levels in HSF-deficient cells were presented as relative value to WT. Data are the means for four independent experiments +/- SEM. (Student’s test compared to WT cells. * p<0.05, ** p<0.01, *** p<0.001). For rescue experiments cells were transfected with PCR3.1 as control vector (white histogram) or PCR3.1 expressing HSF2 (black histogram). Three independent stable clones of each transfection were selected (cl 1, 2, 3 for control vector transfection and cl 4, 5, 6 for HSF2 transfection). Psmb5 (C) and Psmd10 (D) expression level were measured by real-time PCR in each clone and in WT cells (grey histogram). Transcript levels in each stable clone and in WT cells were presented as relative value to PCR3.1 cl 1 for three independent experiments +/- SEM. Data were analyzed with qBase software.
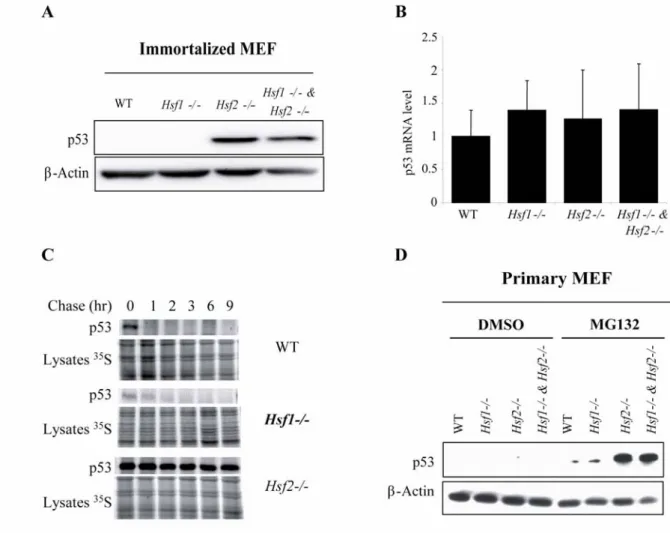
Fig. 5: Stabilization of p53 in HSF2-deficient cells. (A) Untreated immortalized Mouse
Embryonic Fibroblast (iMEFs) derived from WT or knock-out Hsf1 and/or Hsf2 mice (Hsf1-/-,
Hsf2-/- and Hsf1-/- & Hsf2-/-) were analyzed by Western immunoblotting using antibodies
against p53 and β-actin as control. (B) p53 gene expression was compared in WT, Hsf1-/-,
Hsf2-/- and Hsf1-/- & Hsf2-/- iMEFs, by real time RT-PCR. Data were normalized by three
reference genes Gapdh, Hprt1 and Tbp and analyzed using qBase software. Histograms
represent relative expression means +/- SD of four independent experiments. (C) WT, Hsf1
-/-and Hsf2-/- iMEFs were grown and metabolically labeled with L-[35S] methionine for
pulse-chase study. Labeled proteins were immunoprecipitated using anti-p53 antibody and subjected
to denaturing electrophoresis. Lysate 35S was used as loading and 35S incorporation control.
(D) Primary MEFs from WT, Hsf1-/- and/or Hsf2-/- animals were treated with DMSO (cont) or
with 1 µM of MG132 for 16 h. Protein extracts were prepared and p53 western blotting was realized. β-actin was used as loading control.
Supplemental data
Table primers sequences
Gene name and symbol Forward primer Reverse primer
Heat shock protein 70kDa
(Hsp70) GGCCACATTGTTGATACATGC CTACAGTGCAACCACCATGC
Heat shock protein 27kDa
(Hsp27) AATGGTGATCTCCGCTGACT CCTCTTCCCTATCCCCTGAG
Proteasome subunit
alpha-type 1 (Psma1) GATCACCGAACCGTAGTTGG CAACTGTTGCTGAACCTTGC
Proteasome subunit
alpha-type 5 (Psma5) CCCCACTAATGGAGCCTAGC AGAGCCAGATTGGACACAGC
Proteasome subunit beta-type
2 (Psmb2) TGACTCTCAGCATCCTTGACC GTTAGGAGTCCCGCTTAGGG
Proteasome subunit beta-type
4 (Psmb4) ACTACAAAGATGCCCGTTCG TTGAGCCAGCTACAGTCACG
Proteasome subunit beta-type
5 (Psmb5) GATCAACCCGTACCTTCTGG CGAGATGCGTTCCTTATTGC
26S protease regulatory
subunit 6B (Psmc4) CGAGGTGTCCTCATGTATGG GCAGGTGCATTCTCCTTAGC
26S protease regulatory
subunit 8 (Psmc5) TAACAAGGTGGACCCTTTGG TAGAGCAGGACTCCCTTTGG
26S proteasome non-ATPase
regulatory subunit 3 (Psmd3) CTTTTGAACCTCCTGCTTCG AGCTGGATAGCCTTGATTCG
26S proteasome non-ATPase
regulatory subunit 4 (Psmd4) CCTATTCTGGCTGGTGAAGG GTAGCAATTCCAGCCTCAGC
26S proteasome non-ATPase regulatory subunit 10
(Gankyrin) (Psmd10) TGCACTCCACTCCATTATGC AGCATCGTAATGGTCCTTCG
Cellular tumor antigen p53
(Tp53) TGAACCGCCGACCTATCCTTA GGCACAAACACGAACCTCAAA
Ubiquitin B
(Ubb) AGTGACGAGAGGCTTTGTCC ACGAAGATCTGCATTTTGACC
Ubiquitin C
(Ubc) AGCCCAGTGTTACCACCAAG ACCCAAGAACAAGCACAAGG
Glyceraldehyde-3-phosphate
dehydrogenase (Gapdh) TGAAGCAGGCATCTGAGGG CGAAGGTGGAAGAGTGGGAG
Hypoxanthine-guanine phosphoribosyltransferase
(Hprt1)
CCTAAGATGAGCGCAAGTTGAA CCACAGGACTAGAACACCTGCTAA TATA box binding protein
Flow cytometry analysis
WT, Hsf1-/-, Hsf2
and Hsf1-/- & Hsf2-/- iMEFs were plated in 6 well-plate and treated with 1
µM MG132 for 16 h. Cells were trypsined and labeled with Annexin-V FITC (Becton Dickinson Pharmigen, CA, USA) and 1 µg of 7-Aminoactinomycin D (7-AAD) (Sigma Aldrich, MO, USA) for 15 min at room temperature and at obscurity. Apoptosis was performed with FACScalibur flow cytometer (Becton Dickinson, NJ, USA) by analyzing 10 000 events. Data analyses were performed using Cell Quest Pro software (Becton Dickinson, NJ, USA).
Fig. S1: Representative flow cytometry analysis of cellular apoptosis after MG132 exposure. WT, Hsf1-/-, Hsf2
and Hsf1-/- & Hsf2-/- iMEF were treated with DMSO (left panel)
or with 1 µM of MG132 for 16 h (right panel). Then apoptosis level was assessed by flow cytometry using annexin-V fluorescein isothiocyanate (FITC) and 7-aminoactinomycin D (7-AAD) labeling. A typical log fluorescence intensity of annexin V- FITC and 7-AAD plot with quadrant delimiting regions with distinct sub-populations of events is shown. Percentages of cells present in each phase were analyzed using Cell Quest Pro software and indicated on graph.
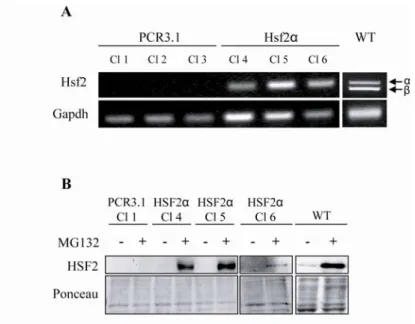
Analysis of Hsf2 expression in stable clone
For the establishment of HSF2 stably transfected cells, Hsf2-/- iMEFs were co-transfected with
a pIRES Hygro coding for Hygromycin B resistance and either with expression vector PCR3.1 or by PCR3.1 coding for HSF2α. Clones were selected in the medium described in materials and methods supplemented by 0.2 mg / ml of hygromycin B (Calbiochem, Germany). Hsf2 expression was measured at RNA level by RT-PCR and at protein level by HSF2 immunoblot. One million of each selected clone were plated into 10 cm plate and harvested after 24 h of culture. For RT-PCR, total RNA were extracted using Trizol reagent (Invitrogen Life Science, CA USA) according to manufacturer’s procedure. Then 5 µg of RNA were retrotrancribed using M-MLV RT (Invitrogen Life Science, CA USA). PCR was performed using Taq DNA polymerase (Qiagen, France) with 100 ng of cDNA and 500 nM of primers. Primers sequences used for Hsf2 are: 5’-CATGTCTAGTGCTGTCCAGC-3’ (forward primer) and 5’-GAGCTCATCGACTTCTATGG-3’ (reverse primer). Gapdh served as loading control. For HSF2 immunoblot, cells were treated with 1 µM of MG132 for 10 h and nuclear extracts were prepared with the nuclear extract kit (Active Motif, Belgium) in accordance with manufacturer’s procedure. 30 µg of protein were loaded and separated on polyacrylamide gel. Proteins were transferred on nitrocellulose membrane and HSF2 were revealed by an anti-HSF2 antibody (sc-13517) (Santa Cruz Biotechnology, CA USA). Ponceau staining were shown as loading control.
RT-PCR analysis of Hsf2 expression (A) clearly showed that clones stably transfected with Hsf2α expressed this transcript whereas cells transfected with the expression control vector PCR3.1 did not. Slight expression differences between each clone could be the results of the number of insertion of Hsf2 or chromatin compaction in the insertion site. Expression of Hsf2 in WT cells was realized as positive control and showed the two isoforms of Hsf2 α and β. HSF2 is a constitutive expressed protein and a constitutive degraded proteins. To detect this transcription factor cells must be treated with MG132 to stabilize HSF2. HSF2 immunoblot (B) in cells transfected with PCR3.1 did not show the presence of HSF2 whereas in cells transfected with HSF2 a strong expression was detect in clone 4 and 5. In clone 6 HSF2 expression was found less important compared to other clones. HSF2 immunoblot in WT cells served as positive control.
Formaldehyde Assisted Isolation of Regulatory Elements (FAIRE)
WT, Hsf1-/- and Hsf2-/- iMEFs were grown in 15 cm plates to 60-70% confluence. Then cells
were cross-linked with 1% formaldehyde for 10 min at room temperature. Formaldehyde was poured off and cells were incubated with 125 mM glycine for 5 min at room temperature. iMEFs were rinsed with ice cold PBS and harvested. Cells were lysed with 1% SDS, 10mM EDTA and 50mM Tris-HCl pH 8.1 supplemented with protease inhibitor cocktail (Roche Applied Science, France) and sonicated for 14 min (30 s on / 30 s off cycles) using a Bioruptor (Diagenode) set up at the highest intensity. 20 µl of chromatin were taken as input. The soluble extracts were subjected to three consecutive phenol-chloroform isoamylic acid extractions to expand in open chromatin. To reverse cross-linking samples were incubated at 65 °C overnight. Finally DNA was purified using Nucleospin Extract II (Macherey Nagel, Germany). Data were analyzed by real time PCR with 0.5 µl of inputs and 3 µl of chromatin subjected to phenol-chloroform extractions.
Fig. S3: FAIRE-Real Time PCR analysis of chromatin at the transcription start site of Psmd10 and on clusterin HSE in WT, Hsf1
and Hsf2-/- iMEFs. Compaction of chromatin
at the transcription start site of Psmd10 and one clusterin HSE was abritary fixed to 1 in WT cells and data obtained from HSF-deficient cells were expressed in relative FAIRE enrichment to WT cells. Mean for three experiments +/-SD (* p<0.05 Student’s t Test). Data obtained clearly showed that chromatin was more compacted at the transcription start site of Psmd10 in HSF-deficient cells than WT iMEFs.