Decision Support for Marketing Management John D.C. Little
Sloan School of Management M.I.T.
WP 1019-78 September 1978
M.I.T. Marketing Center
In the past ten years a new technology has emerged for assisting and improving marketing decision making. We define a marketing
decision support system as a coordinated collection of data, analytic tools, and computing power by which an organization gathers
information from the environment and turns it into a basis for action. Models and measurements are now available to support each major stage in the product life cycle. Simple models provide structure for thinking. Large, flexible models synthesize individual relationships into a useful whole. Measurements, models, and data analysis
encourage the discovery of new marketing phenomena. Rapid improvements in computer technology permit the storage and
manipulation of large masses of data. Although brave predictions of managers sitting at computer terminals have proven false, a new
professional role has appeared, that of a marketing science
intermediary who uses powerful tools to solve problems defined by or for the manager. Dire forecasts of a two-culture conflict with
management have not come true. Where marketing decision support systems have taken root, they have grown and become increasingly productive for their organizations.
1.
1. Introduction
The combination of large potential payoffs, highly motivated professional staffs, evolving OR/MS techniques, and rising computer power is making an impact on marketing management. A problem-solving technology is emerging that consists of people, knowledge, software, and hardware successfully wired into the management process.
Following Gorry and Scott Morton (1971) we shall call the set of facilitating tools a decision support system or, more specifically a Marketing Decision Support System (MDSS). Intellectual contributions to MDSS have come from many disciplines: OR/MS, marketing research, computer science, behavioral science, and statistics, to name a few. We view the results collectively as an advance in management science or, more specifically marketing science. Our purpose is to define and illustrate the concept of an MDSS and show its effects on marketing practice.
2. What is it? A Black BOx View.
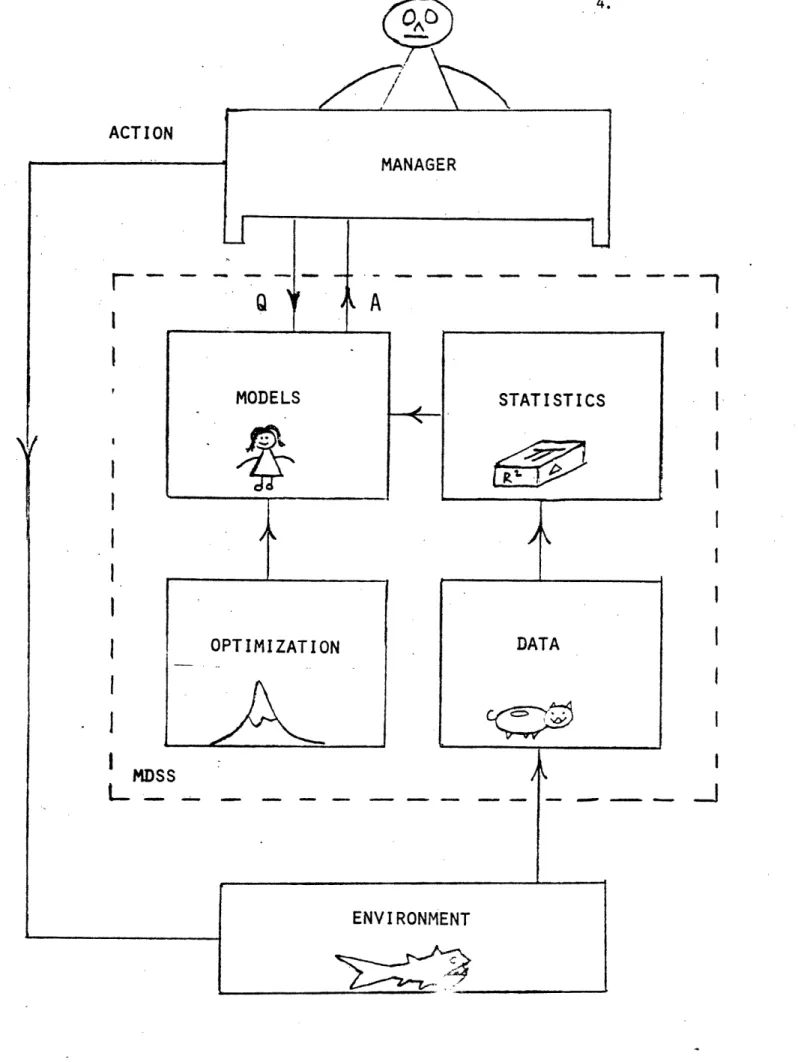
A manager takes action with respect to an environment in order to achieve the objectives of his organization. To do this he must
perceive and interpret the market, even if imperfectly. Then he must think up strategies, analyze them and converge on one to put into practice. This process is conducted through a complicated system of people, paper, and machines. We call the inanimate paart of this an MDSS. We identify major components and trace the flow of activity in Figures 1 and 2. Figure 2, modified from Montgomery and Urban (1969)
bn---·----DATA BANK STAT I ST I CAL PACKAGE
MATHEMATICAL MODEL OPTIMIZATION
PR
:S a
DECISION MAKER THE BUSINESS ENVIRONMENT
Figure 1. Components of a dection support system
7--)-G3
E
3.
shows the MDSS and its role in interpreting and analyzing the environment.
Dataan. A stream of information comes into the organization from the world at large. It comes in many ways: from members of the organization, from talking to people, from reading the New York Times, from purchasing market research, and especially from distilling the multitude of individual transactions of the business: orders,
shipments, purchases, records of internal action, and much more. The data are stored in varied forms: on paper, in people's heads, and, most relevant for our present purposes, in large chunks on machine readable media. The amount of data handled by a large company is
staggering. Business runs on numbers. Sales alone have vast detail, and might, for example, be broken out by time period, market area, brand, package size, salesman, and customer. How did people get along before computers? (Quite well, thank you, but they missed many profit opportunities open to us now.)
Less obvious than the flood of data washing over companies is the information they do not have. Often they may have it in principle, but not in practice. For example, I recently asked a large and successful company for the following data, which they could not supply: product category sales by month and major market area, competitive advertising, and even more surprising, the company's own promotional spending by market area. At another company, I once
sought advertising expenditures by month but it could only be provided in terms of when the bills were paid, not when the advertising was run. This was not too helpful for marketing analysis. Certain data
/~c
I
MODELS OPTIMIZATION __ STATISTICS DATA . _ ENV I RONMENTFigure 2. A manager uses a marketing decision support system (MDSS) to learn about the business environment and take action with respect to It.
ACTION MANAGER
r-I
I
L
l
-1
I
I
I.
I
I
1
i
I
I
I
I
I
I
MDSSL-_
_ _ __-_ _ ~_ II --- - - s -.. --Ill I .~~~ __ ------.
I
Q
)-
N.I~~~~~~~~~~~~~~~~
--
-
-
-i~
~ ~ ~/
AA
5.
are simply not gathered, others are aggregated and the original detail is lost or prohibitively costly to recover. Competitive data usually comes from syndicated services as hard copy. This is inadequate for
any but the most aggregate analysis.
Clearly a basic task of any MDSS is to capture major marketing variables such as sales, advertising, promotion and price in
reasonable detail and truly accessible form. Remarkably few companies do an adequate ob today. The issue is cost and therefore value,
since data for data's sake is a worthless luxury. It takes skillful analysis and effective coupling with management to provide the
benefits that Justify the cost, but then the payback can be large. Models. Whenever a manager (or anybody else) looks at data, he or she has a preconceived idea of how the world works and therefore of what is interesting and worthwhile in the data. We shall call such preconceived ideas models. Even a person who is browsing through
tables has a set of constructs in mind that signal when a particular number is important and worth further consideration. Thus a manager or management scientist uses theories to determine what aggregations or manipulations are meaningful for the decision at hand. The data user may want to confirm or disprove a hypothesis, guide an action, or learn the magnitude of a past number so as to judge the reasonableness of a current one. Manipulation of the numbers may cause an old theory to be discarded and a new one created to conform better to the facts.
Some models remain in people's heads but the ones of most interest here are those that find explicit mathematical and
computational representation. These aid planning and decision making and many less publicized supporting tasks required for understanding
----and analyzing the market.
Statistics. The process of relating models to data we shall call statistics. The most important statistical operation is addition. This makes big important numbers out of small, trivial ones. Many sophisticated techniques are available for model and hypothesis testing and they often prove useful. However, it is not widely realized except by those with their hands on the data that the most frequent operations are basic ones like segregating numbers into groups, aggregating them, taking ratios, making comparisons, picking out exceptional cases, plotting, tabulating summaries, etc. These manipulations are required by such standard managerial models as
proforma profit and loss statements, budgeting, and forecasting, to say nothing of more complicated models for new product tracking, marketing-mix planning and the like.
QOtimization. A manager constantly seeks to improve the performance of his organization. Abstractly this is optimization. The most frequent operations are deceptively simple: calculating two numbers and seeing which is larger, ranking a set of numbers, or sorting a set of alternatives into categories of effectiveness. In addition there are many cases where formal OR/MS optimization methods such as linear programming and its extensions offer substantial
payoffs.
QLA. Finally, the manager and his staff must communicate with
the system. Insofar as the required skills, talent, and information are distributed throughout the organization, communication involves
the standard processes of meetings, studies and reports. As the systems become formal and automated, some of the communication takes
7.
place through interactive time-shared computing. Individual tools are
stored as computer programs. Wth the right software, data and files
pass easily between analyses and a management scientist or other person can perform a wide scope of analysis smoothly, quickly, and efficiently.
To summarize, a marketing decision support system is a
coordinated collection of data, systems, tools and techniques with supporting software and hardware, by which an organization gathers and
interprets relevant information from the business and environment and
turns it into a basis for marketing action.
3. The Critics.
We have described the concept, but what about the practice? Management science has its critics. Let's see what C. Jackson
Grayson, Jr., says, writing in the Harvard Business Review. Grayson, a Harvard DBA, author of a book applying decision analysis to oil drilling decisions, former head of the U.S. Price Commission, former dean of a business school, and currently head of a productivity institute, writes:
"Management Science has grown so remote from and
unmindful of the conditions of 'live' management that it has abdicated its usability." (1973)
One would like to dismiss this as an isolated lapse in a Harvard
education. But wait, not all the critics come from the other side of
the Charles River. Let's see what John D.C. Little, Professor of
Operations Research and Management at M.I.T., says in Management
"The big problem with management science models is that managers practically never use them." (1970)
Clearly this is more serious. On close examination, however, Grayson's article and mine are quite different in content and tone. Grayson, writing in 1973, says that in the most important
administrative role of his career (Chairman of the U.S. Price
Commission) he found no use for his management science training. He goes on to describe managers generally as confused and dissatisfied with management science activities in their organizations and
admonishes management scientists and managers to build bridges to each other. One can hardly advocate that they should not, but this proposal seems patronizing at best and indicates an ignorance of a great deal of useful work that has gone on.
My own paper, written three years earlier, sought to draw on a variety of practical experiences to describe "how-to-to-it" in building
useful models. By 1970 much had been learned, sometimes by painful trial and error, about doing OR/MS successfully in business and
government. Regrettably, good applications often lie concealed because little incentive exists for their revelation and, worse yet, strong
forces favor secrecy. Fortunately, studies are beginning to appear more regularly. See, for example, the prize paper issues of Interfaces
(Nigam, 1975, 6, 7).
OR/MS practitioners have continued to learn what works and what does not. The present paper tries to report some of this.
9.
4. How an MDSS Works. A True Story.
THE MARKETING MANAGER, THE MANAGEMENT SCIENTIST AND THE MBA
Once upon a time (1973) an MBA student took a summer job with a large food manufacturer. He reported to a management scientist in the principal division of the company. The MBA was assigned to put key marketing information, basically store audit data, on a time-shared computer. The goal was an easy-to-use retrieval system, essentially the DATA box of Figure 2.
O.K. He did this.
By the end of the summer, word of the system had reached the Marketing Manager of the major product of the division. The Marketing Manager asked for a demonstration and so the three met. The MBA and
the Management Scientist showed the Marketing Manager how simple
English-like commands could retrieve data items: sales, share, price, distribution level, etc., each by brand, package size and month.
The Marketing Manager was impressed. "You must be fantas.tically smart," he told the MBA. "The people downstairs in MIS have been trying to do this for years and they haven't gotten anywhere. You did it in a summer."
It was hard for the MBA to reject this assessment out of hand, but he did acknowledge, and this is a key point, that the software world had changed. There are now high level computer languages available on time sharing that make it easy to bring up data and start working on it right away.
The MBA and the Management Scientist, flushed with success, now
----said to the Marketing Manager: "O.K. Ask us anything!" (Famous last words.)
The Marketing Manager thought a minute and said: "I'd like to know how much the competition's introduction of a 40 oz. package in Los Angeles cut into the sales of our 16 oz. package."
The MBA and the Management Scientist looked at each other in dismay. What they realized right away, and what you might too, if you think about it, is that there isn't going to be any number in the machine for sales that didn't occur. This isn't a retrieval question
at all, it's an analysis question.
Here then is another point. The Marketing Manager had no idea the number would not be in the machine. To him it was ust one more fact no different in his mind from other facts about the market. Notice also that the question is a reasonable one. One can visualize a whole string of managerial acts that might be triggered by the answer,
possibly even culminating in the introduction of a new package by the company.
What is needed to answer the question is a model, probably a
rather simple model. For example, one might extrapolate previous share and use it to estimate the sales that would have happened without the competitor's introduction. Then subtraction of actual sales would give the loss.
The three discussed possible assumptions for a few minutes and agreed on how to approach the problem. Then the Management Scientist typed in one line of high level commands. Out came the result,
expressed in dollars, cases, and share points.
11.
demonstration. The MBA and the Management Scientist thought it was a miracle! They had responded to the question with a speed and accuracy
unthinkable a few months earlier.
The story is simple but contains several important lessons. I see the same points coming up again and again in various organizations, although not always so neatly and concisely:
1. Managers ask for analysis not retrieval. Sometimes retrieval questions come up, of course, but most often the answers to
important questions require non-trivial manipulation of stored data. Knowing this tells us much about the kind of software required for an MDSS. For example, a data base management system
is not enough.
2. Good data are vital. If you haven't done your homework and put key data on the system you are nowhere. Thus a powerful analytic language alone is not enough.
3. You need models. These are often simple, but not always. Some can be prepackaged. Many are ad hoc.
4. The management scientist is an intermediary. He connects the manager to the MDSS. The manager does not use the system
directly. The management scientist interprets questions, formulates problems in cooperation with the manager, creates models and uses them to answer questions and analyze issues.
5. Quick. uick. uick. If you can answer people's questions right away, you will affect their thinking. If you cannot, they will make their decisions without you and go on to something else. 6. Muscular software cuts out rogrammers. New high-level
languages on timesharing permit a management scientist or recently
;----^_I---trained MBA to bring up systems and do analyses singlehandedly. This makes for efficient problem-solving. Furthermore, the problem-solver identifies with and deals directl-y with marketing management so that his understanding and motivation is high. Time-sharing costs more than batch processing but an army of programmers is eliminated and, far more important, problems get solved on time.
5. Decision SupDort for the Product Life Cycle: Cradle to Grave Care.
Let's look at marketing per se. Over the past 10 or 15 years and continuing unabated there has evolved from diverse origins a series of
tools and techniques for support of the product life cycle.
By product life cycle we mean a sequence of conveniently defined stages that describe the history of a product from conception to
possible demise. We do not imply that every product goes through every stage or that any stage lasts some prescribed length of time.
The product life cycle is illustrated in Figure 3. A product starts as someone's bright idea, thereby identifying a category. The idea then goes through a stage of develooment and evaluation, leading to a detailed design and market position. Development and evaluation are closely linked; at various times during development, evaluations of greater or lesser depth will be made and the results fed back to
refocus development.
The next step is usually test market, although an industrial product will not ordinarily have this step. Then comes national
WLU I--J -i · ., ... 13. a: 0 n, 0 0 M Cc m .c 04 0 n 4 >i o co P OC, ji 4. coI CJ P o :E: a WWLL Z z LL - N-W= . z 'O Z-uJ0 IQ 0 )-0 I.o W-W -c ~(..t LU CU. U-I--i CL 14 Q) 0 -H Pr4 1111_1 t
established and profitable business. From time to time a product may go through a thorough revamping or "reintroduction." Many products at some point go into a twilight of obsolescence. The slide rule and the mechanical watch seem headed this way. Finally many products including quite a few former household names, go out of existence entirely: LOOK magazine is an example, or the tombstone in Figure 3 might read
"Chrysler Imperial: 1926-1975, died at age 49 of sales starvation." The mortality of new products has traditionally been notorious. For example, General Foods reported in Business Week (1973) a 15 year history in which 83% of new products did not get out of the idea stage. Of those that did, 60% never reached test market, of those entering test market 59% failed, and even among those making it to national introduction, 25% were considered financial failures. At the same time, new product introduction is very expensive. For a typical packaged good of a major manufacturer the development and evaluation stage might cost $150,000, a test market $1,000,000, a national introduction $5-10,000,OO0. A new industrial product would omit the test market expense, but might well spend an equivalent amount on development and evaluation.
Responding to the challenge of the heavy expenses and high profit aspirations of new products, marketing scientists have developed an array of methodologies and measurements to support decision making at various stages of the life cycle.
At the idea and categor selection stage, systematic search procedures drawn from behavioral science supplement traditional
inspiration. Focus groups (Cox et. al. (1976)) probe customer feelings about needs and perceptions. "Synectics" (Prince (1972)) is a
15.
technique whereby a group of people seek to solve a problem in an organized way, e.g., conceive of a product to meet a specified set of customers needs. As demonstrated by von Hippel (1978) customers themselves are an important source of industrial product ideas.
Industrial and government data on potential markets suggest new product opportunities. Environmental scanning can turn up danger spots for existing products and needs for new ones.
The bulk of the new techniques, however, begin to come into play at the next stage: develooment and evaluation. Value-in-use analysis
(Gross (1977)) looks at a product from the customer's point of view and asks: What advantages are there to the customer from using this
product? What cost savings? What time savings? What investment would be required to achieve this savings?" By answering such questions for each potential market segment, an aggregate picture of volume vs. price can be synthesized.
A particularly well-articulated description of a formal new product design, development, and positioning methodology is that of Hauser and Urban (1977). Their normative design process envisages, first finding out the customer's words for talking about the product category. This might be done through focus groups. Then customer
words are developed into psychometric scales. Potential customers next use these scales to rate new and existing products in the category. As
customers do this, they also express preferences among the products and so generate data that can be analyzed to identify the customers' key utility dimensions. Such information permits the calibration of a model of new product share and sales. A feedback loop between model
and manager facilitates the modification of the product and its market
II___---position.
Other tools fit in at this stage of the life cycle, some of them within the Hauser-Urban framework. These include mapping studies, conjoint measurement, and consumer choice models. Mapping is a general
term to describe the visual representation of competitive products relative to each other in a space of consumer perceptual dimensions.
Conjoint measurement (Green and Tull (1978)) presents alternative product features to customers in order to obtain their trade-offs and build new products with high market potential. Consumer choice models
(Hauser (1978)) relate choice to consumer utility or preference. A particularly successful blend of models, measurements, and
statistical techinques has emerged for re-test market evaluation. The best example is Silk and Urban's ASSESSOR (1978). In their method people passing through a shopping mall are invited to participate in a marketing study. They view competing advertising commericals,
including one for the new product under test, and then have an opportunity to select a brand from a shelf display that contains
the new product. Data are taken by questionnaire during the process and later a telephone callback determines the customer' s .likelihood of repurchasing. This type of careful orchestration of psychometric
scaling, consumer choice models, trial-repeat purchase models, and statistical calibration has proven extremely useful to marketers of packaged goods and holds the promise of extension to new areas, e.g., pharmaceuticals and small durables.
As we move on to test marketing and national introduction, the techniques change. The principal tools become trial-repeat models calibrated by store audits, ad hoc surveys and consumer diary panels.
17.
The task is to follow the buildup of consumer trial and repurchase and project ahead to future sales and share. Parfitt and Collins (1968) provide a simple model and Urban in SPRINTER (1970) a comprehensive model for doing this. As pre-test market evaluations increasingly
eliminate costly failures in advance, test marketing becomes more of a
fine-tuning for the marketing-mix than a go/no-go test. Therefore, new
product tracking models that contain major control variables become
most useful.
At the established brand stage, -the picture changes again. Ongoing brands frequently take a back seat as new products consume managerial attention. Yet for many companies this is a mistake since major profit opportunities often lie with the old breadwinners. Market
response analyses assisted by marketing-mix models like Little's BRANDAID (1975) or- Bloom and Stewart's MAPLAMOD (1977) harness major control variables, such as price, promotion, and advertising, for
strategy planning and permit tracking predicted vs. actual sales. Discrepancies lead to diagnosis of market problems. Econometric analysis of historical data can help calibrate such models. Consumer panel analyses like those of Ehrenberg (1972) can detect customer
purchase shifts. Individual models of price, promotion and advertising are frequently useful for specific tactical problems.
The basic information sources are also different in the ongoing stage since product management relies more heavily on continuing data:
factory shipments, promotion reports, advertising expenses, and syndicated services such as store audits, warehouse withdrawals and
consumer panels. These services are well developed in consumer package
goods, spotty in consumer durables, and almost absent in industrial
markets.
The twilight or obsolescence stage has also attracted effort. For example, Hess (1967) discusses the pricing of new and old products when the new is destined to supplant the old. The final elimination of a product from a product line is studied in product portfolio analyses (Day 1977).
Thus every part of the product life cycle has generated marketing
science activity. Some efforts are more extensive and more successful than others but it is clear that changes are afoot in marketing
practice.
6. Marketing Science: Who is Kidding Whom?
The term "marketing science" makes some people flinch and others stir restlessly. Is what we have described an advance in fundamental understanding of is it merely a series off commercial fads? Can we sensibly talk about science in a flambouyant field where the motivation and funding are so far from the usual domain of the natural
philosopher? I shall argue that we are indeed engaged in science. First, it should be observed that most of the actors on the
marketing stage are not scientists. Many them are skillful performing artists and very successful, but not scientists any more than, say, a sculptor is. But when a sculptor hammers a chisel into a piece of marble, he initiates a process that is well described by the laws of
physics. In marketing we are not so far along.
Are we anywhere? Natural science is concerned with understanding how the world works. This means models and measurements, the twin
19.
engines of scientific advance. Models provide structure for describing phenomena and permit knowledge to be more than an encyclopedia of facts. Measurements separate good models from bad and allow good ones to be calibrated for practical application. It seem obvious that you can make a scientific study of any observable phenomenon and that we
are certainly doing that on many occasions in marketing.
Whereas understanding is the province of science, application is the domain of technology. Common usage expands science to cover both.
(Thus: "Science put men on the moon, -why can't it cure the common
cold?") The dividing line is blurred and we shall follow the common usages but require understanding as the essential ingredient of science.
Two characteristics of marketing practice tend to obscure accomplishments in fundamental understanding. First, application regularly oversteps knowledge, a situation that makes for confusion, since truths are often proclaimed that are not true. I used to read articles in the business press about marketing successes and marvel
that people knew so much more about their markets than I was able to discover by analysis. Eventually I realized that the authors were
using different standards of knowing. What was being written reflected
the fact that businessmen often make good decisions with relatively
poor information. As part of the process they usually claim knowledge
whether they firmly possess it or not. In any case businessmen much
prefer to have knowledge than otherwise. They would like us to give it
to them wherever possible.
The second point is that, because so much marketing data
collection, analysis and model building is bent toward specific decisions, underlying discoveries are frequently the spinoff of the
application, rather than the reverse. On the way to solving a practical problem, people often develop new understanding. This certainly isn't novel in science - probability, for example, was born at the gaming tables. Not all marketing studies produce scientific knowledge - most are not done nearly carefully enough - but the
potential is there and sometimes the realization. The marketing papers appearing in Management Science, Oerations Research, and Journal of Marketing Research over the past fifteen years demonstrate the quality of the work and the vitality of the field.
Thus, we view marketing science as real. It is an applications
driven subject that is building a base of understanding about marketing processes.
6.1 Measurements. Measurements are contact points with reality, they generate the excitement of new discovery and practical payoff more often than models. Companies pay a great deal for measurements.
Syndicated services in store audits, diary panels, media ratings, and the like constitute at least a two hundred million dollar industry in the U.S. Ad hoc surveys, copy tests, etc. reach a comparable dollar magnitude.
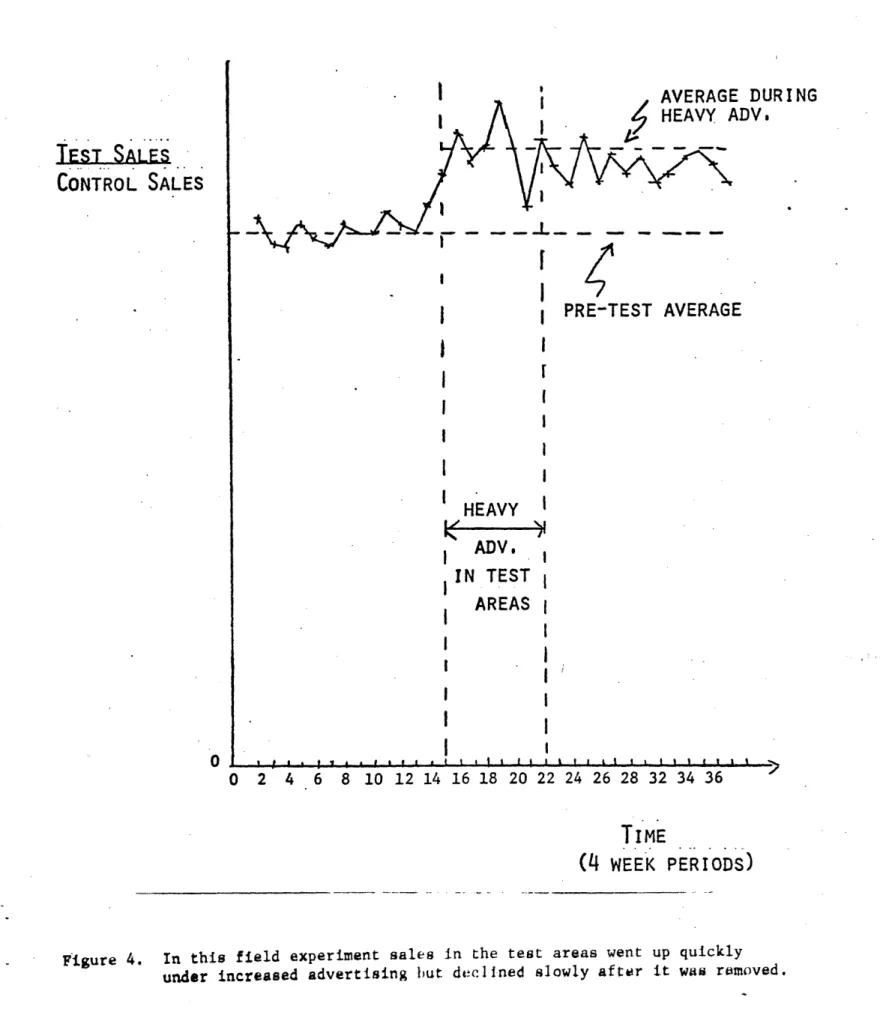
Measurements motivated by theories and models are most valuable. For example, Figure 4 shows the results of an advertising test. Sales are plotted vs. time before, during and after a heavy-up of
advertising.
The results are striking. Notice the rapid rise, leveling off and
slow decay. The data cry out for a theory - and more measurement. Why
21.
TEST SALES
CONTROL SALES 0OI
' AVFRARF nURI NG .DV PRE-TEST AVERAGE.
I
I
I
HEAVY I!
ADV.I
IN TEST I AREAS II
I
I
I
I
I
0 2 4 6 8 10 12 14 16 18 20 22 24 26 28 32 34 36 TIME (4 WEEK PERIODS)Figure 4. In this field experiment sales in the test areas went up quickly under increased advertising but declined slowly after it wa, removed.
.:a- rtQIPlgfi*YI
test were repeated in the same areas a year later? Clearly Figure 4 has strong policy implications. It appears that much more profit was generated by removing the heavy advertising after 6 months than would have occured by continuing it. This is because decay was so slow. However, to determine an optimal, or even a sensible, policy requires a theory of what is going on. This will expose the assumptions that must be made to turn these measurements into decisions. Clearly, there is no shortage of practical and scientific questions here.
The experiment ust described was a project within a marketing decision support operation of a large package-goods company.
Management asked for the experiment because of concern over advertising budget levels. The sales data used were routinely captured from
external syndicated sources and internal company records. Company management scientists analyzed the results using a high level computer language and wielding a variety of standard ahd non-standard
statistical tools.
Whenever new measurement technologies appear they create special opportunities for learning how the world works. Figure 5 shows data of
type that is becoming available through automated checkout equipment in grocery stores. Shown is daily market share chain. The bumps are
promotions, The speed and precision with which the promotional effect can be read is portentous. Here is an indicator of opportunities for new knowledge that will become possible in the near future.
6.2 Mod Models form the other half of the models and
measurements team of natural science. They provide theories that seek to bring order to the chaos of collected facts. Models are much less
23. 4-. D ,-4 * Q)cjCau ua) 4JO 00 o Co tW 4iur4 044 u 0 C) C Or-4u 0 0) a U * MU4-I 0 ao IH LLJ C = -C/) _
well understood by laymen and, indeed, the word is used in enough different ways by professionals that its meaning is often unclear.
For our purposes here I shall define a model as a mathematical description of how something works. Once upon a time, in a simpler
age, scientists thought they were discovering the laws of nature; thus in physics we find Ohm's law, Newton's laws and the like.
Unfortunately, as people subjected these laws to closer and closer examination, they often found unsettling imperfections. These
frequently led, not to outright rejection, but to deeper, more
comprehensive theory. A famous example is Einstein's generalization of Newtonian mechanics through relativity. However, after enough
incidents like this, physical scientists became more cautious and often described their theories as models. In more recent times, as social and management scientists have sought to develop mathematical
understanding of their worlds, they have entertained few illusions about the exactness of their representations. Consequently, they have readily taken up the term.
There is an important practical advantage to the incompleteness implied by the word model. Consider the construction of a model to help solve a marketing problem. We would wish the model to include all the important marketing phenomena required to analyze the problem, but, equally, we would wish it to exclude extraneous complication. This incampletemenss is important and desirable. Managers, however, are
sometimes nervous about it; they conceive that science is exact (even though science and especially engineering abounds with approximations).
If a model is full of art, managers become wary. They say art is Just what they were trying to get rid of by hiring expensive, over-educated
25.
terminal thumpers.
As something of a corroboration of this mind-set, we observe that consulting firms which say they have discovered "laws of marketing" have sometimes had remarkable success with high levels of management.
Managers use models all the time but without the name. Successful management scientists working with managers often deemphasize the word,
using models as required for the ob but communicating the results as ideas and phenomena, going into detail as requested. ne important development in this direction should be noted by those complainers who say models are not used in practice. Management scientist imbed models into problem-solving systems where the models themselves are relatively inconspicuos because they are only a part of the final product. Silk and Urban's ASSESSOR (1978) for evaluating new products is a good example. It employs high technology consumer choice models and
statistical calibration, yet the manager-client focuses on the output and its message for his product. A similar situation arises in the models used for audience exposure analysis of advertising media
schedules (research and frequency studies). In such cases the client company frequently, and properly, treats the analytic system like any other industrial product and does a technical evaluation of it before using it routinely.
I would like to distinguish between odel and rocedure. If you allocate the advertising budget to major markets proportional to last year's sale in those markets, you have specified a procedure. Implicit
in the procedure may or may not be a model. For example, if you hypothesize that advertising response is proportional to last year's
sales times a suitably chosen funtion of advertising dollars, then you
r--.---·---·--ls---can construct a model of market response that will yield as the optimal budget allocation the same results as the described procedure.
Thus a rocedure is a way of calculatin a result; a model is a set of assumptions about how something works. Managers frequently use procedures, usually based in part on implicit intuitive models.
Management scientists devise procedures directly but often try to develop and calibrate explicit models which will generate good
procedures.
In my simple world I like to distinguish between two types of model: good and bad. Bad models include those that are simply wrong. For example, a model with a linear relationship between sales and advertising has to be incorrect. Other models are vacuous. The symbols may not really be defined or the model may merely be a
formalistic way of saying something obvious that is better said simply. Still other models are so extraordinarily elaborate that they collapse of their own weight as data and calibration requirements become so enormous that testing and calibration are infeasible.
We have lived through many bad marketing models and, if we are to
continue to progress, we will have to live through many more. At least
we have good models too. Fortunately, it is a characteristic of science that, once you discover omething worthwhile, you can use it from then on and make it a building block for continued progress.
Three types of good models are: (1) small models offereing
insight and structure for thinking, (2) general structures that permit the synthesis of a variety of phenomena and (3) models of new
phenomena. Without trying to cover the whole field (a book length task), I shall illustrate each of these types.
27.
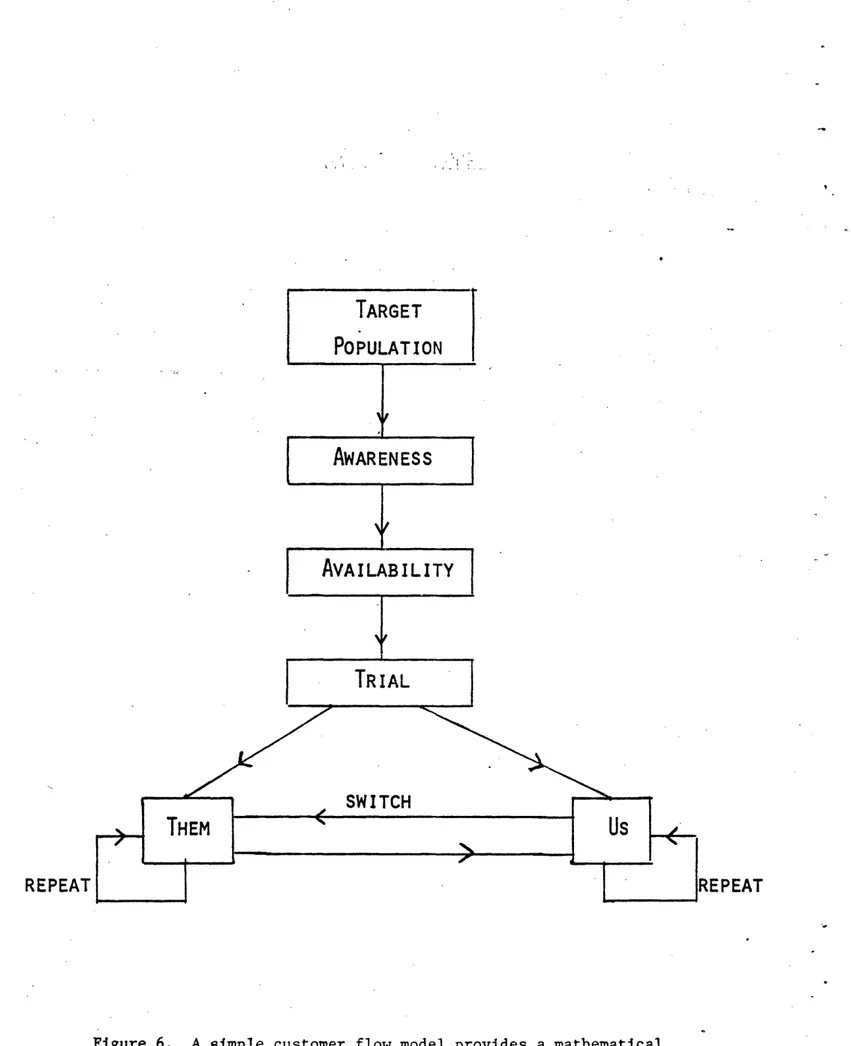
6.2.1 Small Models Offering Insight: The customer flow model displayed in Figure 6 has very much affected people's thinking about new products in the past 15 years. Here is the basic propostion.
A new product has some intended set of customers, called its target market. Suppose we have developed an inexpensive gyrocompass for recreational vehicles. Recreational vehicle owners are the target poDulation. Before any of them can possibly buy the product they have to be aware of it. A company can teach people the existence of a new product by advertising and, in fact, any advertising agency can produce a reasonable estimate of how much money it will take to do this. For
some number of millions of dollars, for example, you can teach 20% of the American public the name of your product.
But people cannot buy it unless it is available. This is a
distribution problem. Assuming a company is marketing somewhat similar goods, it will know the appropriate distribution channesl and will be
able to tell what kind of availability it can achieve for this product. Once a person in the target market is aware of the product and has a place to buy it, the next question is: will that person trv the
product i.e., buy it once? Involved here is, first, the success of advertising in communicating the product's attributes to the
prospective customer; and, second, how the customer evaluates the desirability of those attributes. Reasonable estimates can usually be made of trial probability. In some categories of package goods,
historical norms are now available. You can also make more refined estimates by taking field measurements with the actual product. Note, however, that even without this, and long before the product has even been made, estimates based on historical norms or managerial judgements
ram·rs·sllimrsma-ds·*I---REPEAT
Figure 6. A simple customer flow model provides a mathematical structure for estimating future sales of a new product.
29.
will permit useful market calculations.
Given that a person has tried the product, the next question is 'whether he or she will repeat the purchase the next time such a product
is needed. Alternatively the customer may switch to another brand. Provided that reasonable estimates of switching and repeating
probabilities can be made, we can calculate the share of purchases going to the new product among people who try it once.
A straighforward calculation puts together the whole sequence: the number of people in the target market times the fraction who become aware of it times the fraction who find it available timer the fraction of those who try it times the share of purchases that triers devote to the new brand times the sales rate for the product class, determines
the sales rate of the new product.
The notions of awareness, availability, trial, repeat and switching are fundamental. These processes are obviously going on.
The model can be made very elaborate (see Urban (1970), but the basic conceptual structure and the process described above for calculating long run sales rate are exceedingly simple.
The quality of that calculation will depend on the quality of the
inputs, but Just using sensible numbers helps keep the new product
manager from becoming a total dreamer. Every new product manager is
wild advocate for his or her product. Probably this is necessary since most new products fail and somebody has to be a believer to keep from giving up before starting. The prehistoric way to estimate new product sales was to declare a final number in one judgmental swoop. Amazingly enough the number usually turned out to be exactly that value which would ustify continuing the development. The discipline of putting
----plausible numbers into the above calculation restricts answers to a believable range. Then, as the company goes through the new product development sequence, increasing investments in field measurements narrow down the uncertainty in the final sales.
6.2.2 Models for Synthesis. Another useful type of model
provides a structure for assembling measurements and phenomena from a
variety of sources to solve a given problem. An example is the
marketing-mix model BRANDAID (Little (1975)). BRANDAID, when
appropriately calibrated for a product of interest, relates brand sales and profit to major marketing control variables, competitive actions, and environmental influences. The structure is modular so that
marketing effects can be added or deleted to suit the application. Each effect is a submodel which can be designed separately. Major control variables such as price, promotion, and advertising are pre-modeled but custom versions can be substituted if desired. The number of geographic regions is flexible, from one to whatever patience will permit. The same applies to the number of competitors.
Model calibration makes the general structure specific to a
particular application. Historical data, field experiments,
econometric analysis, and whatever else may prove useful are used to develop values for model parameters so that the model becomes a suitable representation of a given market.
Usually a few key variables account for most of the effects on
sales. Figures 7 and 8 show an application employing four submodels.
The submodel outputs are plotted along with the final retrospective
31. Soles Inde sesoaihlyl *4 trend 12 24 36 Months adwvrlising 12 24 36 Months retail price Soles Index 12 24 36 Months Months
Figure 7. An application of the marketing-mix model Brandaid. Historical company actions and environmental conditions fed into four submodels give the outputs shown.
Sales
- - - - Model
- Actual
12 24 Months
Figure 8. The Brandaid submodels are combined to track historical sales.
Soles ldes Soles lades 0 I I I I I ~ -_ -_ _~~~~~-n I vA __~~~~~~~~~~~~~~~~~~~~~~~~Lat I 0 I I I I I II I I I i l
and sometimes even more useful for generating an anticipated sales rate. This becomes a standard to be compared with actual sales. Discrepancies trigger diag:.osis and feedback to management.
6.2.3 New phenomena. It is always exciting to discover a new phenomenon and build a model of it. This does not happen often and, because of commercial secrecy, the news sometimes spreads rather
slowly. An example that originated a number of years ago but continues to have ramifications deals with concentration of retail outlets. The
original work was done on gasoline service stations. All the oil
companies are familiar with it, but, as with many scientific phenomena, the principle is more general. In this case, it carries over into other franchise operations (e.g., branch banks and fast food outlets) and in these industries the idea is ust beginning to take hold.
The phenomenon deals with competition between outlets in a given city. I recall sitting on the office of a marketing economist in a major oil company and discussing service station site location.
He said, "One thing you have to be careful about is putting two of our stations close together or putting too many stations in the same market. First of all, the dealers will scream, but, in addition, you start running into self-competition. If the company puts new stations in a market where it already has many, it is taking business away from itself."
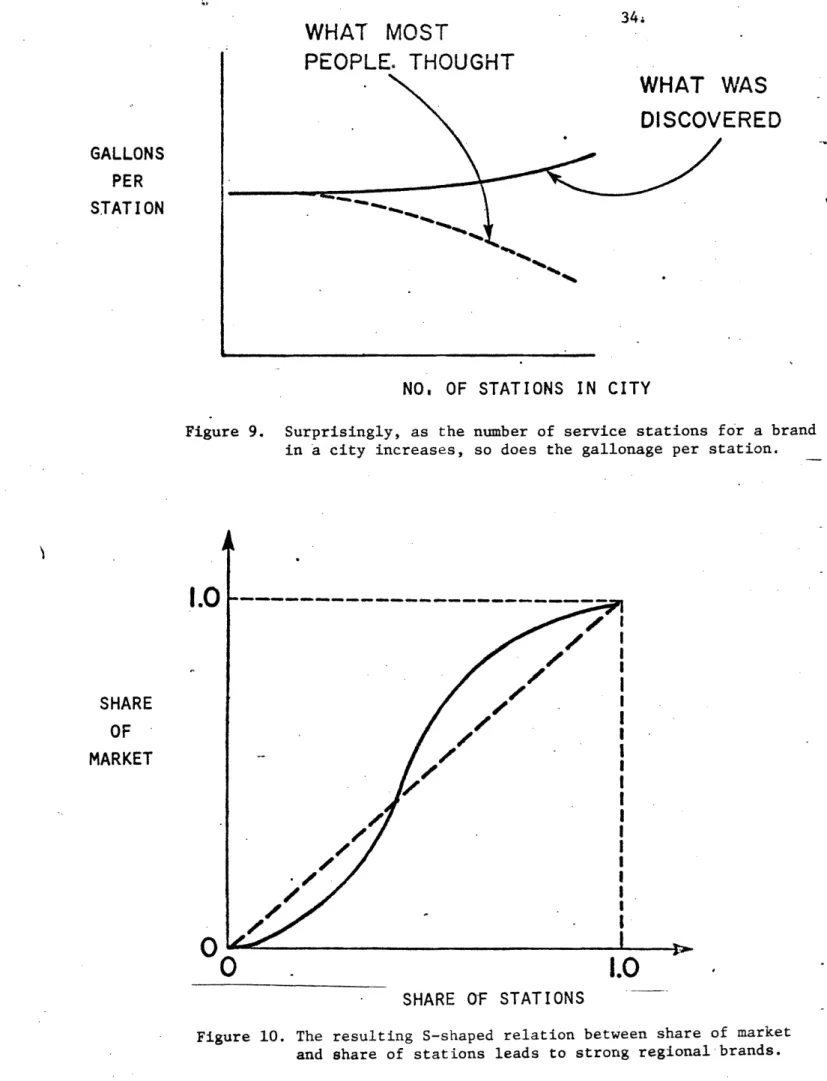
This point of view is represented in Figure 9 by the curve marked "What people thought" and shows gallonage per station decreasing with number of outlets in a city.
33.
and build a theory. After filtering out a variety of variables that confuse the situation they found that the curve actually goes UD. In other words, up to a certain point, stations actually reinforce each other: the more stations that the company has, the greater is the gallonage Der station.
To me this is quite surprising, although, once a fact is known, it is easy to offer explanations. For example, stations are outdoor
advertisments for the company; the more stations the more people become aware of the brand. In addition, media advertising, which is hardly worthwhile for one or two stations in a market, becomes economical if there are many. Credit cards become more useful to a customer if the brand has many stations and therefore will enhance total brand sales in the market. Everything makes sense - once you know the answer.
Figure 10 sketches the station reinforcement phenomenon as a plot of market share vs. station share. If the effect did not exist, we would expect the diagonal straight line. With the effect, the company does worse than the straight line at low station share, then with
increasing station share crosses over the diagonal, and finally bends over to unity as diminishing returns set in.
The strategy implications of the relationship are dramatic and quite opposite to the actions most oil companies were taking at the time. The curve tells a company to add stations where it is already strong, at least up to quite a high level, whereas most companies were trying to reach out geographically as fast as possible to become
national companies with the widest possible markets. As we now see, this was not the best way to gain the most new business with new investment dollars, (Notice, incidentally, that the oil industry is
WHAT MOST
PEOPLE- THOUGHT
NO. OF STATIONS IN 34.WAS
ERED
CITYFigure 9. Surprisingly, as the number of service stations for a brand in a city increases, so does the gallonage per station.
1.0
SHARE OF STATIONS
Figure 10. The resulting S-shaped relation between share of market and share of stations leads to strong regional brands. GALLONS PER STATION
1.0
SHARE OF MARKETo
0
-- -. .35.
characterized by strong regional marketers, a piece of empirical support for the underlying phenomenon.)
Later Lilien and Rao (1976) imbedded the reinforcement model into a financial model that takes into account laydown costs, competitive
pricing conditions, building costs, total budget, etc. This provided marketing management with a tool to allocate service station investment
dollars to maximize long run return, thereby reaping productivity.of
the basic discovery.
7. MSS in Practice: The bottom line is on too.
The best marketing decision support I know of grew up over several years in the major division of a large packaged goods company.
Although the first big data base came on stream in mid 1972, the system is still evolving today. It has become an integral part of marketing operations and has materially affected management style in several
ways.
A management science group of 2 or 3 professionals and a similar number of clerical and long-time company people run the activity. Their online database contains internal company sales, records of marketing activities (e.g. advertising and promotion) and a sizeable block of syndicated data (e.g. panel and store audit data). As a rough
estimate 106 numbers are online and more can be available with a few days notice.
The system software is a high level language which offers not only
data base management but also powerful manipulative and analytic
capabilities. Gradually, many small and large analytic routines and
models have been written and incorporated in the system. The computer is in constant use; one or two people are logged in virtually all the time and overnight batch runs ordered online during the day are common.
The bread and butter business of the MDSS consists of responding to a remarkable variety of small requests from brand managers and higher levels or marketing management. Rarely does raw data retrieval provide the answer. Almost always data is manipulated and presented in a special way because of some issue at hand. Service is sufficiently good with fast turnaround on short requests that, at one point,
barriers had to be raised to reduce requests and maintain quality control on obs performed. An important block of time goes into database maintenance and updating.
7.1 Changes in management style. Two significant changes in marketing management style can be traced to the MDSS. Tendencies toward each had existed previously but the MDSS permits them to emerge in a practical way.
The first is the growth of a "try and see" approach to new marketing programs. The marketing managers in the company are
activists who want to introduce new ideas but also want to know whether they really work. A mini-experiment program has evolved. The
management science group has identified a bank of market area
appropriate for tests. The annual marketing plan includes a set of tests for the coming year and, in addition, extra tests can be put in the field quickly. Typical projects are new promotion ideas, packages, product line extensions, and changes in advertising media strategy, copy or weight. The management science group has developed analytic
37.
and evaluative routines for reading the results quickly and
efficiently. The detail, flexibility, and rapid turnaround of the MDSS along with the experience and skill of the professional people make the operation possible.
The mini-experiment program is the invention of marketing management, not the management scientists. This has important
consequences. In the first place the tests are not very precise. Each test is usually done in a single market, and as any statistician will point out, it is difficult to estimate a standard error from one observation. Nevertheless, the program prospers. Although an
individual test may be statistically weak, the whole collection screens a considerable number of new ideas. Real winners stand out.
,Run-of-the-mill improvements are hard to read but correspondingly less important. As has been shown by Gross (1972) in the case of
advertising copy testing, significant gains accrue to creating multiple ideas and screening them, even if the precision is limited. It is doubtful that the management science department would ever have proposed the program on its own. The technical people would have proposed multiple market experiments that were more statistically defensible on an individual basis, but then costs would have prevented a really extensive program. As it is, marketing management, having invented the idea, is willing to absorb the uncertainties of the results.
Larger scale, multiple market experiments are also conducted. In fact, a carefully designed advertising weights test analyzed within thee MDSS recently led to a major shift in advertising spending strategy.
rs---The second managerial style change is a shift toward regional marketing. Anyone can think up regional strategies, but it is another matter to maintain management control over them and do follow up evaluations. These are necessary to determine successes and failures and to adjust strategies to changing conditions. The MDSS has been critical in making this possible.
7.2 Market Resoonse Re ortin . Conventional reviews of brand and company performance stress status reporting, i.e. how things are. For example, what are sales, share, price, promotion and advertising
expenditures and what are their trends? Status reporting is
characteristic both of standard market monitoring systems like SAMI and Nielsen and of internal company reporting.
A more action-oriented performance review is becoming possible with the evolution of MDSS's. This is market response reporting, i.e., how effective marketing actions are. For example, what is price
elasticity, how do sales respond to promotion, and what effect will increased advertising have on sales?
The markets of this company have witnessed important competitive
changes over the past few years. The historical events captured in company and syndicated data permit extensive analysis of various marketing actions. Analytic methods have evolved, not overnight but over several years, to permit estimates of market response to major changes in marketing actions. These response estimates are the subject of ongoing reviews similar to those conventionally made with static indicators and offer marketing management new and sharper information for decision making.
39.
The market response information also permits projection of future performance by means of marketing-mix models. While this is done for certain purposes, a more important role of models has been in the historical analysis itself. A credible model of the effects of all major marketing variables is essential to performing the market response analysis.
7.3 Costs/Benefits. The cost of the MDSS in this company is large in dollars: several hundreds of thousands. As a fraction of sales, however, the cost of the system, the data, and the people who run it is small, perhaps .1%. This seems modest considering that marketing
budgets run about 5% of sales and, more important, the decisions being affected influence sales and profit by much more. The cost of the system and its operation splits roughly equally among data, people, and computation.
The MDSS did not spring full blown from the marketing vice
president's head nor did it evolve without controversy. The growth has been incremental, moving from first tentative beginnings and useful initial results, to further extensions, more results and so on. This has brought certain inefficiencies ("If we'd known then, what we know now..."), but the idea of "best" at each evolutionary stage changes considerably by the time of the next one so that a flexible approach pays off.
The MDSS has used outside time sharing services copiously and so
has been a constant target for an inhouse data processing takeover. Yet the power, flexibility, and responsiveness of languages available on external timesharing has not been duplicated inhouse. Marketing
---management has insisted on high and increasing levels of service which have only been available externally.
Some payoffs have been explicit. An analysis of promotion led to a strategy change with a profit increase in seven figures. Such
incidents are obviously helpful and may well be essential for survival. However, my own feeling is that the largest benefits have come simply by facilitating good management. Bold changes of direction in a
company are infrequent (which is probably a good thing). For the most part management deals with a series of adjustments to conditions, no adjustment being particularly spectacular nor uniquely traceable to any specific piece of data or analysis. Yet the collection of analyses adds up to influence, decision, and improved profit. Another usually unrecognized role is assistance in preventing disasters. The pressure for improvement in a company turns up fascinating proposals, some of which are bound to be bad. Analyses that lead to recommendations for inaction are not very exciting but are sometimes more valuable than calls for revolution.
In summary, this particular company has developed an effective MDSS over a multi-year period. The process has been evolutionary with high costs and higher benefits. Marketing management has become more innovative as it receives more and better feedback from "try and see" operations. The system has encourage a shift from market status
reporting to market response reporting. However, the main point to be made is that effective MDSS's are not pie in the sky. They are here
41.
8. Problem Solving with Interactive Systems: The Grey Flannel Robot
In the early days of time-shared computers, many people realized that a marvelous invention was at hand. A person could have convenient access to huge computers from any place possessing a telephone.
Without too much difficulty a computer could interrogate the user in a semblance of natural language, using words and phrases to ask for input and deliver output.
8.1 What People Thought. Clearly timesharing was a breakthrough and the imaginations of the visionaries were stimulated. A new world was forecast in which managers would sit at terminals and formulate their problems. With the help of easy-to-use commands they would put key assumptions and Judgements into the computer. These would be incorporated into models relevant to the issues to be examined. The managers would ask "what if" questions and evaluate various strategies.
New ones would be stimulated by the analysis. Finally the managers would select their best alternatives and go off to take action.
8.2 hat PeoDle Eound. Managers do not like terminals. They are
impatient and busy. They do not formulate problems in model terms
because that is not the way they naturally think. They want to think
about strategy not. analysis. They will propose actions to be analyzed but they do not want to do it themselves.
Anecdotes to illustrate these points are many. I recall one excruciating incident in the early days of online models when the president of a very large corporation was invited to use the new toy
hands-on. Unfortunately, he couldn't type, not even with a tolerable hunt and peck. The situation became embarrassing. Vice presidents fluttered about. Finally a data processing manager took over the keyboard. More fundamentally, however, managers do not go online because of their function and style. As Mintzberg (1973) has amply documented, the manager leads a high pressure, communications-intensive life, which tends to be much try-and-see than think-and-analyze.
The notion of the hands-on manager is not dead, however. I have rather recently been told that a large computer manufacturer has sold an elaborate information system that will put video terminals on the desks of 10 bank vice presidents for constant use in running their departments. I am not optimistic about the ultimate level of use. We shall find an occasional top executive who is an avid hands-on analyst, but I feel quite confident the majority will not be for some time to come.
8.3 A Ne Role. All is not lost, however. Interactive systems are definitely the way to go. We need only recognize that managers work through human organizations in this as in most things they do. What we find happening is that individuals are emerging who can be described as marketing scince intermediaries. They are typically OR/MS professionals or recent MBA's with good technical skills. They are first and foremost problem solvers. They convert managers'
questions into models and analyses. They enter into dialog with
managers and others in the organization as to what the problems really are. They provide answers to managers' questions and repond to the new
43.
databases, models and systems to solve recurring problems. They do the homework managers lack the time to do. They want the manager's jobs in a few years. For the present they are organizers and internal
consultants who build knowledge and systems to support marketing operations.
Typically marketing science intermediaries program and use models and systems personally, or with small staffs. However, they are not computer scientists and do not report to MIS. What makes their role possible is powerful new computer languages available on time-sharing.
8. 4 Hardware and Software: Readyv-to-Wear. Computers are
impossible to work with but are getting better. Advances in hardware and software are pushing the evolution of decision support systems.
Hardware manufacturing costs are dropping and prices are following at a respectful distance. Some people forecast that hardware costs will
eventually become negligible. I am not so sure because we are so good at thinking up big new things to do. However, it is fair to predict'
that hardware cost will become a negligible part of the computations we are doing today. Software, on the other hand, continues to be
expensive but has.undergone advances in ways particularly relevant to us here.
The philosophy behind contemporary software is to let the computer solve its own problems. Wy should users have to go through elaborate contortions to move data from a statistical package to a marketing model to a report generator? They shouldn't. Good software systems
can solve these and many other machine problems, leaving the users free to concentrate on the essence of the analysis. High level commands
permit easy plotting, tabling, array arithmetic, statistical analysis, optimization, report generation, and model building, all on the same database.
As a user I am most appreciative of default options. Thus, if SALES is a defined data variable, I can give a command like PLOT SALES and out comes a plot. It fits on a 8 1/2 x 11 page, the curve
approximately fills the plot, the axes are labelled, a sensible grid has been selected and it has round-number gradations, etc. The computer had finally become a moderately effective clerk. If I want something different from default conditions, I can override them, but most of the time, especially during exploratory work, the automated
plot is fine. Furthermore the same commands will work on a dozen different terminals; it is only necessary to tell the computer which one is being used.
High level languages that embody many of these features are increasing in number and scope. An early one with the emphasis on a concise and powerful mathematical notation is APL. A commercial system with a strong business orientation is EXPRESS. Somewhat similar are PROBE, TSAM, and XSIM. Some of the systems are easily extendable so that, for example, FORTRAN subroutines can be easily introduced as new commands. Why reinvent the wheel? Features and degree of power vary but all these languages try to let the analyst work an order of
magnitude faster than a FORTRAN programmer on a bare-bones time-sharing system.
Most of the observations just made about interactive systems extend well beyond the context of marketing, see, for example, Keen (1976).
45.
9. Ilementation: Which Way Is U?
Any attempt to install an MDSS has organizational ramifications. Will marketing management's antibodies reject the graft? Will the internal computer establishment gag?
Taking these issues in order, consider Argyris' view (1971). Writing in Management Science in 1971, he says:
"If management information systems achieve their designers' highest aspirations, they will tend to create conditions where executives will experience: (1) reduction of space of free movement, (2) psychological failure and double bind, (3) leadership based more on competence than formal power, (4) decreased feelings of essentiality. These experiences will tend to create genuine resistance to MIS.
Another hand-wringer. I do not agree and will argue otherwise, but first let me give an anecdote to favor Argyris' view. A marketing vice president I know refused to conduct a field experiment which would
have sought to measure the effect of advertising on sales. He had various reasons for his position but I suspect the real reason was that he had negotiated an increased advertising budget with the president. Therefore, if the experiment should be confirming, it would be
redundant and, if not, he would look bad. So why do the experiment? To use Argyris' words, better information only restricted his space of
free movement.
I believe that the executive was wrong and that by such actions his company could lose competitive advantage which would eventually reflect back on him. However, this type of managerial reaction certainly exists. A better style, in my opinion, is to view the advertising increase as an opportunity for measurement and further