AT
21° NORTH, EAST PACIFIC RISE AND
GUAYMAS BASIN, GULF OF CALIFORNIA
by
Karen Louise Von Damm B.S., Yale University
(1977)
SUBMITTED IN PARTIAL FULFILLMENT OF THE REQUIREMENTS FOR THE DEGREE OF
DOCTOR OF PHILOSOPHY
at the
MASSACHUSETTS INSTITUTE OF TECHNOLOGY and the
WOODS HOLE OCEANOGRAPHIC INSTITUTION August 1983
© Massachusetts Institute of Technology 1983
Signature of Author
Joint Program in Oceanography, Massachusetts Institute of Technology - Woods Hole Oceanographic Institution, and the Department of Earth, Atmospheric and Planetary Sciences, Massachusetts Institute of Technology, August 1983
Certified by_
John M. Edmond Thesis Supervisor Accepted by
Chairman, Joint Crm itt& for Chemical Oceanography, Massachusetts InsUtute of Technology - Woods Hole Oceanographic Institution
Archives
MASSACHUSETTS INSTITUTE OF TECHNOLOGY
NOV 1 5 1983
CHEMISTRY OF SUBMARINE HYDROTHERMAL SOLUTIONS at
210 NORTH, EAST PACIFIC RISE and
GUAYMAS BASIN, GULF OF CALIFORNIA by
Karen Louise Von Damm
Submitted to the Joint Oceanographic Committee of the Department of Earth, Atmospheric and Planetary Sciences, Massachusetts Institute of Technology, and the Woods Hole Oceanographic Institution on August 5, 1983, in partial fulfillment of the requirements for the degree of Doctor of Philosophy.
ABSTRACT
Submarine hydrothermal solutions at 210 north latitude on the East Pacific Rise were sampled for the first time in November 1979 and again in November 1981. In the 1981 program, four vent fields were sampled and a maximum temperature of 350-355 C was measured for three of the areas (OBS, SW, and HG) and only 273 C for the fourth area (NGS). The temperatures were stable over the twelve days of the diving program. The hot springs are "black smokers" which are forming constructional features of Fe, Zn and Cu sulfides and Ca and Ba sulfates. The solutions are seawater which has been heated during convection through the oceanic crust and has reacted with basqlt. The hydrothermal solutions are acid (pH = 3.3-3.8, 25° C, 1 atm), reducing (H2S = 6.6-8.4 mmoles/kg, S04 <1 mmoles/kg), and metal rich
(Fe = 0.8-2.4 mmoles/kg, Mn = 0.7-1.0 mmoles/kg, Zn = 40-106 moles/kg, Cu = 0-44 moles/kg, Pb = 183-359 nmoles/kg, Co = 22-227 nmoles/kg, Cd =
17-180 nmoles/kg and Ag = <1-38 nmoles/kg). Mg and S04 are quantitatively removed from these solutions while other elements are highly enriched. Li increase- to 0.9-1.3 moles/kg, K to 23.2-25.8 mmoles/kg, Rb to 27-33
molesi'kg and Ca to 11.7-20.8 mmoles/kg. Sr both increases and decreases from the seawater concentration to 65-97 moles/kg. Na and C1 also
increase and decrease; the gain can be attributed to a -7% loss of water due to rock hydration. Silica increases to 15.6-19.5 mmoles/kg. Silica increases along strike from the southwest to the northeast; variations in the other chemical components are not geographically consistent. Quartz geobarometry indicates a pressure of reaction between 300-600 bars, implying a depth f reaction within the oceanic crust of 0.5-3.5 kms; in agreement with the geophysical estimates. The silica data imply that the NGS vent is conductively cooling.
The Guaymas Basin, Gulf of California hydrothermal system was first sampled in January 1982. A total of ten vent areas were sampled with a maximum a3mperatu:e of 315° C. In contrast to the 21 N systems where the solutions exit directly from basalt, the hydrothermal systems at Guaymas pass through and react with approximately 500 meters of sediment cover
before they exit on the seafloor. This difference is reflected in the chemistry of these solutions. The sediment also provides a trapping
mechanism for the metals in solution and a sediment-hosted type ore deposit may be forming at depth. These solutions differ from those at 210 N as
they are less acid (pH = 5.9, 250 C, 1 atm), sulfur rich (H2S = 3.8-6.0 mmoles/kg, S04 <1 mmole/kg) and metal rich (Fe = 0.02-0.18 mmoles/kg, Mn = 0.13-0.24 mmoles/kg, Zn = 0-40 imoles/kg, Cu <6 moles/kg, Pb = 230-652 nmoles/kg, Ag <230 nmoles/kg, Cd <46 nmoles/kg and Co <5 nmoles/kg). The higher pH and extremely high alkalinity (2.8-10.6 meq/kg) can be attributed to dissolution of CaCO3 and thermal degradation of organic matter which occur in the sediment column. The organic matter degradation is also responsible for the very high levels of ammonium (10.3-15.6 mmoles/kg) found in the solutions. The high pH and alkalinity are responsible for the lower concentrations of the metals which form insoluble sulfides. The ammonium exchanges for K and Rb in the sediments raising their levels in solution to a maximum of 49.2 mmoles/kg and 86 moles/kg, respectively; significantly higher than the values observed at 210 N. Li increases to 0.6-1.1 mmoles/kg, Ca to 41.5 mmoles/kg and Sr to 253 moles/kg. Na and C1 increase between 8-18%; this is attributed to hydration. Na is lost
preferentially to C1. Quartz geobarometry indicates a depth of reaction of -0.5 kms into the oceanic crust.
These two sites demonstrate the importance of seawater reactions with basalt in altering the composition of seawater. The 210 N system is
dependent only on reactions between seawater and basalt at elevated
temperatures for its chemistry. The Guaymas system is a more complicated case in which reactions between the hydrothermal solutions and sediment overprint the basalt signature. The presence of large amounts of CaCO3 and organic matter in the sediments at Guaymas is probably very important in determining the solution chemistry.
Without the enthusiasm of my advisor John Edmond this thesis would not have succeeded. I would like to thank him for the opportunity to work with him on this project.
Barry Grant and Chris Measures provided tireless help at sea and back in the lab, as well as good company through it all. Without their help
this thesis would not have been finished. Ed Boyle, Russ McDuff, Alan Shiller, Bob Stallard, Bob Collier, Peggy Delaney, Art Spivack and Glen Shen were always ready to have a perceptive discussion.
Special thanks to Karl Turekian who provided me with my first exposure to this field as a college freshman. As my undergraduate thesis
supervisor, and as a member of my thesis committee he has enriched my
understanding of global processes and has provided immeasurable help. Bill Jenkins explained the mysteries of 3He to me and as a member of my thesis committee was always ready to listen and to help. As a member of the committee, Mike Mottl's discussions aided the interpretation of the data set.
This thesis is based on several field sampling programs of
hydrothermal solutions. Without the help of the captain and crew of the Alvin/Lulu these programs would not have succeeded. Special thanks to the Alvin pilots Ralph Hollis, George Ellis and Bob Brown whose virtuousity in handling the submarine and samplers obtained the most pristine hydrothermal samples yet. Barrie Walden's sampler design has worked flawlessly on three diving cruises to date. The captains and crews of the Gilliss, Melville and E.B. Scripps provided the support facilities which made these cruises a success. Bob Ballard and the ANGUS group and many co-workers from Scripps helped to make these cruises a success as well as enjoyable.
thank them enough for their support.
The National Science Foundation through grants OCE-8020203,
TABLE OF CONTENTS Page Number Title page 1 Abstract 2 Dedication 4 Acknowledgements 5 Table of Contents 7 List of Figures 9 List of Tables 11 Chapter 1 - Introduction 12
Chapter 2 - Results and Discussion of 210 North, East Pacific 21 Rise Solution Chemistry
2.1 Sample setting 21
2.2 Solution chemistry 27
2.3 Sulfur system 88
2.4 Silica concentration and the depth of reaction 96
2.5 21° N model 104
2.6 Comparison to chimney chemistry 109
2.7 Comparison to ore deposits 112
2.8 Comparison to observed basalt alteration 114 2.9 Comparison to experimental work 117 2.10 Comparison to metalliferous sediments 122
2.11 Summary 125
Chapter 3 - Results and Discussion of Guaymas Basin, Gulf of 127 California Solution Chemistry
3.1 Sample setting 127
3.2 Solution chemistry 131
3.3 Sulfur system 173
3.4 Silica concentration and the depth of reaction 174
3.5 Guaymas model 176
3.6 Comparison to DSDP Leg 64 177
3.7 Comparison to chimney chemistry 180
3.8 Comparison to ore deposits 181
3.9 Comparison to experimental work 184 3.10 Comparison to metalliferous sediments 186
3.11 Summary 186
Chapter 4 - Conclusions 188
4.1 Comparison of 210 N and Guaymas 188
4.3 Further work 194
References 196
Appendix 1 - Sample Collection and Treatment 205
Appendix 2 - Analytical Methods 215
Appendix 3 - Data Tables 231
LIST OF FIGURES
Page Number
Chapter 1
1-1 Map of discovered submarine hydrothermal systems. 16 1-2 Schematic comparison of the Galapagos Spreading 18
Center; 210 North, East Pacific Rise; and Guaymas Basin, Gulf of California hydrothermal systems.
Chapter 2
2-1 Simplified geology and vent locations at 210N. 22
2-2 Lithium versus magnesium at 210 N. 38
2-3 Sodium versus magnesium at 21° N. 41
2-4 Potassium versus magnesium at 210 N. 43
2-5 Rubidium versus magnesium at 21° N. 45
2-6 Lithium versus potassium at 210 N. 46
2-7 Beryllium versus magnesium at 21° N. 49
2-8 Calcium versus magnesium at 210 N. 51
2-9 (Calcium - sulfate) versus magnesium at 210 N. 52
2-10 Strontium versus magnesium at 210 N. 54
2-11 Barium versus magnesium at 210 N. 55
2-12 Silica versus magnesium at 210 N. 59
2-13 pH versus magnesium at 210 N. 61
2-14 Alkalinity versus magnesium at 210 N. 62
2-15 Fluoride versus magnesium at 210 N. 64
2-16 Chloride versus magnesium at 210 N. 65
2-17 Charge balance sodium versus chloride at 210 N. 68
2-18 Sulfate versus magnesium at 210 N. 70
2-19 Hydrogen sulfide versus magnesium at 210 N. 72
2-20 Manganese versus magnesium at 210 N. 76
2-21 Iron versus magnesium at 21° N. 78
2-22 Iron versus manganese at 210 N. 79
2-23 Copper versus magnesium at 210 N. 81
2-24 Zinc versus magnesium at 210 N. 83
2-25 Solubility of quartz as a function of temperature 100 and pressure.
Chapter 3
3-1 Location map for Guaymas. 128
3-2 Dive and vent locations at Guaymas. 129
3-3 Lithium versus magnesium at Guaymas. 137
3-4 Sodium versus magnesium at Guaymas. 139
3-5 Potassium versus magnesium at Guaymas. 140 3-6 Rubidium versus magnesium at Guaymas. 142
3-7 Beryllium versus magnesium at Guaymas. 144
3-8 Calcium versus magnesium at Guaymas. 145
Page Number
3-10 Barium versus magnesium at Guaymas. 150
3-11 Aluminum versus magnesium at Guaymas. 151
3-12 Silica versus magnesium at Guaymas. 152
3-13 pH versus magnesium at Guaymas. 154
3-14 Alkalinity versus magnesium at Guaymas. 155 3-15 Ammonium versus magnesium at Guaymas. 157 3-16 Chloride versus magnesium at Guaymas. 159 3-17 Charge balance sodium versus chloride at Guaymas. 160
3-18 Sulfate versus magnesium at Guaymas. 163
3-19 Hydrogen sulfide at Guaymas. 164
3-20 Manganese versus magnesium at Guaymas. 167
3-21 Iron versus magnesium at Guaymas. 169
3-22 Iron versus manganese at Guaymas. 170
3-23 Zinc versus magnesium at Guaymas. 172
Chapter 4
Appendix 1
Al-1 Titanium water sampler. 207
Appendix 2
LIST OF TABLES Page Number Chapter 1 Chapter 2 2-1 21° N Vent Locations. 24 2-2 SW Vent Descriptions. 26
2-3 Calculated Water/Rock Ratios and Extraction 31 Efficiencies for 21 N.
2-4 Endmember Concentrations - The Alkalis. 39
2-5 Endmember Concentrations - The Alkaline Earths. 48
2-6 Endmember Concentrations. 57
2-7 Sodium versus Chloride - 21° N. 67
2-8 Endmember Concentrations - Sulfur Species. 71
2-9 Total Sulfur Concentration. 73
2-10 Endmember Concentrations - Trace Metals. 77 2-11 Endmember Concentrations - Arsenic and Selenium. 84 2-12 Temperature, Silica and the Depth of Reaction. 98
2-13 Comparison of 21° N to Experiments. 121
2-14 Ratios of Elements to Iron in Metalliferous Sediments 124 and the 210 N Hydrothermal Solutions.
Chapter 3
3-1 A Values for Guaymas Solutions. 136
3-2 Sodium versus Chloride - Guaymas. 161
3-3 Comparison of Guaymas Hydrothermal Solutions and 178 Pore Waters.
Chapter 4
4-1 Comparison of Hydrothermal and River Fluxes. 192
Appendix 1
Al-1 Particle Digestion Analyses. 214
Appendix 2
A2-1 Analytical Determinations and Methods. 216 Appendix 3
A3-1 Major Element Results. 232
CHAPTER 1
Introduction
The existence of oceanic hot springs had been postulated for several years on a geophysical (Elder, 1965) and a geochemical basis (Corliss, 1971) before their discovery in 1977. On a geophysical basis they were postulated to explain the anomalously low conductive heat flow observed on young ocean crust as being due to convective cooling (Wolery and Sleep, 1976). On a geochemical basis they were invoked as being a possible
control on the composition of seawater and sediments, as well as providing the missing source/sink in several elemental mass balance calculations. The metalliferous sediments found on the ocean ridges and as the basal section of the sediment column (Bonatti, 1975) implied that these waters might be an effective medium of metal transfer from basalt to the seafloor
(Corliss, 1971). The ophiolite sections observed on land provided evidence for the hydrothermal alteration of oceanic crust as well as the deposition of massive metal sulfides by these fluids (Coleman, 1977). Further
evidence for pervasive high and low temperature hydrothermal alteration of the oceanic crust came from rocks dredged from the seafloor (Humphris and Thompson, 1978a,b; Delaney et al., 1983). Water column anomalies of helium-3 (Craig and Lupton, 1981) and manganese (Weiss, 1977; Klinkhammer et al., 1977) over the ridge crest implied that an injection process must be active at the present time.
Submarine hot springs were first observed and sampled at the Galapagos Spreading Center (GSC) (0047'N, 86°08'W) (Corliss et al., 1979) . The hot water reached a maximum temperature of 30° C. Various chemical parameters indicated that the water was seawater which had reacted with basalt at
temperatures of ~350° C and then mixed subsurface with ambient seawater resulting in the deposition of metal sulfides and alkaline earth sulfates at depth (Edmond et al., 1979a,b). The chemistry of the hydrothermal water was greatly altered from that of normal seawater. The helium/heat
relationship found in these samples (Jenkins et al., 1978), when combined with the global helium budget implied that these hydrothermal waters have a great influence on the chemistry of seawater. The 350° C endmember had, however, not been observed. The mixing with ambient seawater at depth in the system and resulting oxidation and precipitation reactions precluded
"seeing back" to the original endmember composition for many of the trace metals. The iron, copper, zinc, silver, sulfur, etc. concentrations in the endmember, which are important for the interpretation of massive sulfide deposits in ophiolite and other terrains could not be determined.
Experimental work on seawater-basalt reactions at temperatures in the
300-400 C range suggested that these solutions carried significant amounts of these "ore-forming" species (Bischoff and Dickson, 1975; Hajash, 1975; Seyfried and Bischoff, 1977; Seyfried and Mottl, 1977; Mottl and Holland,
1978; Mottl, Holland and Corr, 1979; Seyfried and Dibble, 1980).
In early 1979 hot springs were found at 210 N on the East Pacific Rise (EPR) with exit temperatures of 380+300 C (RISE Project Group, 1980). In November 1979 in a series of five Alvin dives we sampled these "black smokers" and measured temperatures of 350+50 C. This was a reconnaissance cruise to test sampling schemes and based on this experience we returned to 210 N in 1981 with new sampling equipment. Most of this thesis is based on the 1981 sampling of the hot springs, although occasional reference is made to the 1979 samples. Four vent areas were sampled in 1981: the same three as were sampled in 1979 as well as one newly discovered one. A fuller
description of the sample collection is given in Appendix 1.
The solutions sampled at 21° N do not mix with ambient seawater until they exit on the seafloor. There, as the hot, acid, metal and sulfide rich hydrothermal solution mixes with the cold, alkaline sulfate rich seawater,
sulfides and sulfates are precipitated building large (up to 20 meter) constructional features on the pillow terrain. The buoyant solutions form plumes of "black smoke" (predominately pyrrhotite (FeS) with other metal
sulfides present) as they mix with seawater and these particles are
dispersed through the water column. The hydrothermal solutions are clear until they mix with seawater and with the samplers used in 1981, which
could reach into the "throat" of the vents, the "pure" hydrothermal solution was sampled. This allowed the concentrations of iron, copper, zinc, sulfur, etc. to be measured directly in these solutions.
North of the vent fields at 21 N the East Pacific Rise enters the Gulf of California. The Gulf is the closest western hemisphere analog to the Red Sea and the spreading center is covered by several hundred meters of sediment. Guaymas Basin, located approximately halfway up the Gulf, is divided into a northern and southern trough by a transform fault. This basin was thought to be a present site of hydrothermal activity based on heat flow (Lawver et al., 1975), helium-3 in the water column (Lupton, 1979), deposits sampled by submersible (Lonsdale et al., 1980) and the results of DSDP drilling in the basin (Curray, Moore, et al., 1982).
In January 1982 we sampled the hydrothermal solutions in the Guaymas Basin for the first time. The temperatures were not as high as at 21 N
(315° C was the maximum measured temperature) but the main difference between the two areas is that the solutions at Guaymas must pass through ~500 meters of sediment before they exit (some also as "black smokers") on
the seafloor.
In the spring of 1982 the French found many smokers at 130 N on the East Pacific Rise and sampled several of them (Michard et al., 1983).
Based on water column anomalies of helium-3, manganese and methane there is good evidence that hot springs also exist on the East Pacific Rise at
15-20 S (Lupton and Craig, 1981), although they have not been sampled directly. Similar water column and pictorial evidence exists for hot springs on the Juan de Fuca/Gorda Ridge (Normark et al., 1982) but they have not as yet been sampled directly. The discovery of these other areas suggests that hot springs are a common phenomenon on the intermediate to fast spreading sections of the world ridge crest (Figure 1-1). Additional evidence that this is so comes from the same specialized fauna (+ a few species) found at all these sites, although they are separated by thousands of kilometers.
The main objective of this thesis is to define the chemistry of the hydrothermal solutions at two of these sites: 210 N EPR and Guaymas Basin, Gulf of California, and to evaluate their importance to ocean chemistry and other phenomena such as massive sulfide deposits. These two areas will be compared to the solutions sampled at the GSC. These areas provide examples of three kinds of seafloor hydrothermal activity, although the basic
process occurring at all three is the same. In all cases seawater reacts with basalt at temperatures of >300° C. At GSC the system is "leaky" and the hydrothermal solutions mix with ambient seawater and precipitate below the seafloor. As a result the solutions are relatively cool and depleted in metals and sulfur when they reach the seafloor. At 210 N the system is
"tight" and it is at the seafloor that the hydrothermal solutions mix with ambient seawater and precipitate metal sulfides and sulfates as the
16
a.
..
....
,, ,.
...
·,Jua
a~
a t IIIa 111iiFigure 1-1: Map of discovered submarine hydrothermal systems.
I I I I I I I I I I II I I I I I I I I I I I
constructional "chimneys" and plumes of "black smoke". At Guaymas the hydrothermal solutions react with the sediments through which they pass on
their way to the seafloor, depositing some of their metal sulfides in the sediment column as well as increasing their concentration of other species. These solutions retain enough metals and sulfide to still build chimneys
and be black smokers when they exit on the seafloor. Figure 1-2 is a schematic comparison of these three systems.
It is important to understand what causes the differences in chemistry between these systems, as whether they are low temperature and "leaky" (like GSC), high temperature and "tight" (like 210 N), or sediment covered (like Guaymas) will affect their net input to the ocean. Understanding their chemistry is also important for an understanding of the deposits they can form. The 210 N solutions can be called "ore-forming" based on their solution chemistry but much of this metal content is dispersed in the water column. At Guaymas, the sediment cover provides a trapping mechanism and it may be an example of a sediment-hosted or Besshi-type ore deposit (Franklin et al., 1981) in formation.
Chapter 2 of this thesis contains the results of the major and trace element analyses of the 210 N hydrothermal solutions as well as a
discussion of the data. It addresses the question of what is controlling the solution chemistry. The solution chemistry is also compared to what is known about the alteration assemblages found in oceanic rocks, the
composition of the chimneys at the 210 N site, the composition of massive sulfide deposits in ophiolites, metalliferous sediments, and to the
experimental work on seawater-basalt interaction. Chapter 3 contains the results and discussion of the Guaymas data. It addresses the same
Figure 1-2: Schematic showing a comparison of three hydrothermal systems. Galapagos Spreading Center where seawater mixes with the hydrothermal solutions subsurface leading to the subsurface precipitation of metal sulfides (shown by the ##).
210 North, East Pacific Rise where seawater mixes with the hydrothermal solutions on the seafloor leading to the
precipitation of metal sulfides as chimneys and black smoke. Guaymas Basin, Gulf of California where the hydrothermal
solutions also react with sediments leading to the
precipitation of metal sulfides in the sediments and on the seafloor. Secondary hydrothermal systems driven by dike intrusions also occur in the basin.
Galapagos Spreading Center
Seawater
HEAT'-21'North,
East Pacific Rise
Seawater
Basalt
IHEAT-Guaymas
Basin, Gulf of California
Sea-water
Sediment
Basalt
_ II
I · I-CIY · - --L I I Ill I I I · ~l _11 A9L4FVej
j t L : AT -_is compared to the results of pore water and sediment analyses in DSDP sites 477 and 477A, which were in the Guaymas Basin. Chapter 4 is a comparison of the two systems and in conclusion attempts to access the general importance of seafloor hydrothermal activity to ocean chemistry.
CHAPTER 2
210 N - Results and Discussion
Two major questions need to be addressed with respect to the 21 N solution chemistry. As these were the first high temperature submarine hot springs sampled and as they comprise the most complete data set it is
important to define their composition and the magnitude of variability which exists between vents. To be able to generalize the hot spring
composition in an attempt to define their total input to the oceans it is necessary to understand what is controlling their chemistry. This chapter
is a presentation of the results from 210 N, followed by a discussion of the data. The discussion addresses the question of what is controlling the solution chemistry.
Submarine hydrothermal solutions were postulated to be the source of massive sulfide deposits and metalliferous sediments and to be responsible
for the alteration of seafloor rocks. The final part of this chapter is a comparison of the hot spring chemistry to the chemistry of these other observed phenomenon, in order to set some constraints on whether the hot springs could be responsible and what major disparities exist.
2.1 Sample Setting
At the 21 N site three active vent areas were sampled in 1979 and a fourth area was found and sampled in the 1981 series of ANGUS tows and Alvin dives. The ridge axis here trends N38°E (Ballard et al., 1981) and
the vents occur over a distance of 8.4 km (Figure 2-1). Starting from the north the vent areas are: National Geographic Society (NGS), Ocean Bottom Seismograph (OBS), Southwest (SW) and Hanging Gardens (HG). Their x,y
o
%s,
Po.
---\- ---- \ , \ i N I
(increase in dteptl) TOPOGRAPHIC TICGH) (increase in deptih)
- HG I t
4 ':
"P.lack Smokers
(decrease in exiting temperature) · (increasin g in racturing witlin V
· 5 Zone I votanics)----/. - '\ I I / \ _ . . . I \ \ - -,4 0O 49 /Oc
, o
S.
.
--I 'O',<0,j,
oo0-4Figure 2-1: Simplified geology and vent locations at 210N. From Ballard and Francheteau (1982). The four 21 N vent areas sampled are noted.
%PO
.
locations in the 1981 transponder net as well as their absolute latitude and longitude and distance from each other are given in Table 2-1.
The East Pacific Rise at 210 N has a moderate spreading rate of 6.2 cm/yr (Larson, 1971) and the axial valley averages 5 km in width (Ballard et al., 1981). Ballard et al. (1981) describe in detail the ridge axis at
21 N based on 1979 ANGUS tows and submersible work, as well as earlier results. The HG vent area (the one furthest to the southwest) was not found at the time of that survey but is included in a discussion by Ballard and Francheteau (1982) which includes some of the results of the 1981 cruise. From the 1981 survey Ballard et al. (1981) assigned relative ages to the lava flows on which the vents occur, based on the relative sediment cover. NGS and SW are on the youngest flows while OBS is on a slightly older one (HG was not included in this survey). All four of the vent areas appear to be above eruptive fissures which are presumed to be the source of the lava flows. Ballard and Francheteau (1982) point out that all of the axial springs found to date occur on the topographic high between two fracture zones. At 210 N, NGS, OBS and SW are north of this high while HG is south of it (and separated from SW by 7.2 km) (Figure 2-1). HG is on very young sheet flows, as are the other thrce vent areas, although the flows at HG appear to be fed by a different fissure. At both GSC and 21 N as the distance from this high increases, the temperature of the vents decreases. NGS is the most northerly vent sampled and is cooler. Cooler vents (not black smokers) exist further to the north. The survey with the French submersible Cyana was still further to the north at 21° N and found extinct vents but not active ones (Cyamex Scientific Team, 1981).
At the NGS area two vents exist; both -'re sampld in 1979 while only one was sampled in 1981. The vent sampled in 1981 is the more southerly of
Table 2-1: 21° N Vent Locations
Vent x y Latitude2 Longitude Distance
ml 7320 6973 6626 6618 6562 6616 6606 1720 m 5452 5240 4540 4531 4510 4626 4628 -769 m3 20°50.26 N 20050.47 N 20049.05 N 20049.05 N 20049.82 N 20049.82 N 20047.26 N 109°5.65 W 10905.83 W 109°6.85 W 10906.85 W 10906.40 W 10906.40 W 10908.79 W NGS + OBS OBS + SW 1 + SW 2 + SW 3 + SW 4 + SW 5 SW 1 + HG SW 2 + HG SW 3 + HG SW 4 + HG SW 5 + HG NGS + HG 406 781 793 838 710 714 7229 7217 7163 7287 7280 8370
Ix and y are in meters within the 1981 transponder net. They are the average values based on the coordinates at the times of water sampling. 2Latitude and longitude are from R. Ballard and C. Sheer (personal communication).
3
Distance is in meters. 4
Vents SW 1 and SW 2 are so close to each other that except on dive 1149 when they were both sampled, it is difficult to distinguish which vent was sampled based on the x,y coordinates.
5
For a more complete description of the vent sites at SW see Table 2-2. NGS OBS SW 14,5 2 3 4 5 HG
the two sampled in 1979. No water was exiting from this vent when the submarine first approached it but after excavating it, the chimney began to flow freely and the measured temperature of 273 C was stable over the five days during which this vent was visited three times. In 1979 its measured temperature was 350 C.
Only one active vent was found at the OBS site although the several large extinct chimneys at this site have sometimes caused it to be called the "Black Forest". This vent was a triptych of three approximately three meter high chimneys on top of a large basal mound. The biology at this site is extremely sparse and only a few crabs were observed. Of the four vent areas visited at 21 N it has the largest visible sulfide deposit. The maximum measured temperature was 350° C.
The SW vent has four active black smokers along with several extinct ones and numerous warm vents or seeps between the pillows. At least one of
the vents at SW was extinct and began flowing after the submersible
excavated it. At another extinct chimney, overgrown by tube worms, water of 274 C was found under the worms. The maximum temperature of 3550 C was measured in this area. A fuller description of the vent sites is given in Table 2-2. The vents at SW lie close to the edge of a collapse pit
believed to have been formed by the draining of a lava lake. There is a greater profusion of biological activity at SW than at either NGS or OBS and there are large areas with clams nestled between pillows.
The HG area consists of one mound with several chimneys on it. It also contains a very profuse biological community. The maximum measured temperature was 351 C.
An additional vent was observed north of NGS on dive 915 during the RISE expedition in the spring of 1979. However only extinct chimneys were
Table 2-2: SW Vent Descriptions
Vent Description
SW 1 (x=6626, y=4540) A single vent with three orifices, it was first sampled on dive 1149 (all three orifices). It was also
sampled on dive 1153 and may have been sampled on dives 1150 and 1157.
(Samples 1149-3,4,7,8,9,10,11,12, all 1150?, 1153-5,9,13,14, 1157-2?,4?,7?,8?,9?,13?)
Maximum temperature = 355 C.
SW 2 (x=6618, y=4531) A single vent on a large mound, it was first sampled on dive 1149. It is very close to SW 1 and it is
difficult to discern if SW 1 or SW 2 were sampled on dives 1150 (probably SW 2) and 1157.
(Samples 1149-1,2,6,13, all 1150?, 1157-2?,4?,7?,8?,9?,9?,13?) Maximum temperature = 346° (3500?) C.
SW 3 (x=6562, y=4510) This vent was sampled on dive 1153 and was extinct until it was excavated by the submarine. It is approximately 8.9 m high.
(Samples 1153-6,12,13,18) Maximum temperature = 270 C.
SW 4 (x=6616, y=4626) This vent was sampled on dive 1157. (Samples 1157-6,10,14,15,17,18)
Maximum temperature = 275 C.
SW 5 (x=6606, y=4628) This was an extinct vent buried under tube worms.
(Samples 1153-10,11)
2.2 Solution Chemistry
In very general terms the final hydrothermal solution chemistry is determined by that of the reactants: seawater and basalt. This is complicated by the relative proportions of seawater and basalt reacting (either the composition of the rock or of the seawater may be limiting) as well as by the mineral alteration assemblage formed. A major question in
these systems is whether equilibrium (with potential solubility controls) is achieved or whether the kinetics of the various reactions are most important. The chimneys are disequilibrium assemblages and this may also be true of the alteration assemblages at depth. If kinetics are important the length of time the solutions spend in contact with the rock must be addressed. Time is the parameter for which we have the least information (section 2.5). Laboratory experiments reacting seawater and basalt at elevated temperatures and pressures have shown that a finite amount of time, which varies with the crystallinity of the rock (diabase reacts slower than glass), is required for the reactions to occur. A second important parameter is temperature. From observation we can place some constaints on the temperature of the hydrothermal solutions but little is known about how the inferred reactions will proceed with variations in
temperature. A generalized equation summarizing the above can be written as:
x seawater + y rock + [alteration] + [hydrothermal] + ...
+ [products ]i [solution ]i +
+ [alteration] + [hydrothermal]
+ [products If [solution ]f
where i represents some unknown intermediate assemblage(s) for a given set of conditions
and f represents the final equilibrium assemblage for the same set of conditions.
These assemblages will be influenced by x/y, the water/rock ratio as well as by the differences between the various reaction rate constants. Changes in temperature will affect the reaction rates and products. In a closed system with increasing time this series of reactions and assemblages will proceed to the right (i.e. the reactions should have gone further towards the equilibrium assemblage). The reaction sequence is more complicated in an open system (more representative of the actual case), because new rock surfaces and/or new solutions are continuously available.
The concentration of an individual species can be expressed as: C = (CO + f(Cr) - w)h
where C = concentration in the hydrothermal solution Co = starting concentration in seawater
f(Cr) = some function of the concentration in the rock
w = a removal term which may be related to solubility or the production of alteration phases.
h = hydration factor.
In this expression the water/rock ratio (x/y), time and temperature parameters are included in the f(Cr) term. It is not known how each of these factors will affect the concentration and since they cannot be separated, they are combined in one term. Most of the major elements, excepting magnesium and sulfur, show a net gain as the solutions traverse the hydrothermal system; therefore f(Cr)-w>O.
ENDMEMBER CONCENTRATIONS
As mentioned above, magnesium is lost from seawater during reaction at elevated temperatures with basalt. Experimental work on these systems has shown that the magnesium is essentially quantitatively removed from the seawater at low water/rock ratios as are found at 210 N. (Water/rock ratios will be discussed below.) Bischoff and Dickson (1975) have shown that the magnesium reacts with a silicate species and water to form a
Mg-hydroxy-silicate with a resultant release of protons. These protons then undergo further reaction with silicates, exchanging for cations such as K and Ca2+ and releasing them to solution.
At 210 N, Guaymas and the GSC magnesium decreases in all the vent fields and is assumed to reach zero in the pristine hydrothermal solution. Surface seawater is used to fill the dead volume in the samplers (3.8 out of 755 milliliters - Appendix 1), therefore seawater (and some magnesium)
is present in all the samples. Some ambient seawater may also be entrained during sampling and based on mineralogical evidence the chimneys themselves are somewhat "leaky" to seawater (Haymon and Kastner, 1981; Goldfarb,
1982). The assumption that magnesium is zero in the pure hydrothermal solution can therefore not be proven directly. The magnesium content of a solution is used as a mixing indicator. At 210 N samples with Mg <2.1 mmoles/kg (>96% hydrothermal water) were obtained in all the vent fields. A check that the magnesium is actually a sampling artifact comes from the Mg/SO4 ratio. If this (molar) ratio is equal to the seawater value, both
of these species can be assumed to be from seawater entrainment. The observed Mg/SO4 ratio is close to the seawater value in all of the samples and within a small error they extrapolate to zero together (see sulfur discussion and Table 2-8).
The concentration of the "pure" hydrothermal endmember for a given element is obtained by fitting a least squares line to the data, forcing it through the composition of ambient seawater at the appropriate depth and extrapolating to zero magnesium. These calculated endmember concentrations are the ones given in the tables throughout this chapter. The complete data set is given in Appendix 3.
parameters can be calculated. A simple but important calculation is to find the net addition (6) of an element to the solution and to then
determine what fraction of the original rock composition this represents. The net addition (6) is arrived at by correcting for the water loss due to rock hydration and the amount of the element originally present in the seawater:
C
6 = - - Co = f(Cr) - w. h
The correction for hydration can be made based on either of two parameters. From the 6180-6D results (Craig and Welhan, personal
communication) it appears that the solutions from all of the 210 N vent areas have lost approximately 10% of their water; presumably due to rock hydration. From the chloride data, which only show an increase in the NGS vent, the water loss appears to be 7%. (In the other vents there is a net C1 loss.) To calculate the net additions (6) to the solution given in Table 2-3, all of the solutions are corrected for a 7% loss of water (as the isotopes show the same loss for all the areas) and then corrected for the original composition of the seawater (i.e. assuming w is zero and solving for f(Cr) ). The water loss due to C is used rather than that from the isotopes because the isotopic value is dependent on assumptions about the temperature of reaction and the isotopic fractionation factors which are not well known. If the 7% water loss from C1 is an underestimate
(i.e. a C1 sink is also active at NGS) the 6 values will be too large. The tabulated 6 values can be viewed as an upper limit.
A calculation based on the net addition (6) of an element to seawater can be made to derive the approximate water/rock ratio. If it is assumed that the element of interest is quantitatively leached from the rock
Table 2-3: Calculated Water/Rock Ratios and Extraction Efficiencies for 21 N Element Rock Water/ 6 Rock Extraction Efficiency3 Alkali Extraction Efficiency4 Li NGS OBS SW HG Na NGS OBS SW HG K NGS OBS SW HG Rb NGS OBS SW HG Be NGS OBS SW HG Ca NGS OBS SW HG 1.45Wml,2
0.78JM
24Jm 50W-2.15JM Mg NGS OBS SW HG 1.6 1.8 1.8 1.1 60 1.7 2.0 2.0 1.9 0.29-1.6 0.32-1.8 0.33-1.9 0.27-1.5 2000 3600 5400 4200 230 500 410 3100 0.45 0.39 0.39 0.45 0.012 0.42 0.34 0.34 0.26 0.43-2.5 0.38-2.2 0.37-2.1 0.33-1.9 3.5x10⁻⁴ 2.0x10⁻⁴ 1.3x10⁻⁴ 1.2x10⁻⁴ 0.003 0.001 0.002 1.6x10⁻⁴ 1.1 1.1 1.1 1.7 0.028 - 1 - 1 = 1 = 1 1.0-6.0 1.1-6.3 1.0-6.0 1.2-7.1 8.5x10⁻⁴ 5.6x10⁻⁴ 3.7x10⁻⁴ 4.6x10- 4 7.2x10⁻³ 4.0x10⁻³ 4.9x10⁻³ 6.2x10⁻⁴ 0.7-1.8KHm 3p 230-600-11
-10
-26 0.001-0.003 0.007-0.003 Ba NGS OBS SW HG 0.05-0.07 0.02-0.03 0.03-0.04 0.02-0.03 0. 12-0.17 0.07-0.09 0.09-0.12 0. 09-0.13 937p 805 812 1296 13m -60 -54 -50 14.3m 11.8 11.8 12.5 28p 25 24 30 25n 14 9.3 12 9.2m 4.3 5.3 0.7 -52.7m -52.7 -52.7 -52.7 Sr NGS OBS SW HG 15S 7 9 10 10-14 21-30 17-23 15-21 150-210R~Element Rock C1 NGS OBS SW HG SiO2 NGS OBS SW HG Al NGS OBS SW HG S04 NGS OBS SW HG H2S NGS OBS SW HG As NGS OBS SW HG Water/ 6 Rock Extraction Efficiency3 Alkali Extraction Efficiency4 = Om -84 -77 -77 8.25JM 3.02JM 13Rm 13-27WI 18.0m 16.2 15.9 14.3 3.7p 4.8 4.4 4.2 460 510 520 580 8.2x10⁵ 6.3x10⁵ 6.9x10⁵ 7.2x10⁵ 0.0015 0.0014 0.0013 0.0009 8.6x10⁻⁷ 1. 1x10 - 6 1.0x10- 6 7.0x10⁻⁷ 0.0037 0.0039 0.0039 0.0033 2. 1x10- 6 3.2x10- 6 2.9x10⁻⁶ 2.6x10⁻⁶ -27.9m -27.4 -27.3 -27.5 6.13m 6.81 6.95 7.81 <30n 203 172 393 2.1 1.9 1.9 1.7 64-130 76-160 33-69 0.33 0.37 0.37 0.30 0.005-0.011 0.004-0.009 0.007-0.015 0.80 1.1 1.7 1.1 0.015-0.031 0.013-0.026 0.028-0.057 1.9-2.3KHi 26Jm 1.33JM 0.75KHm <ln 63 63 63 935p 895 652 819 812P 1552 699 2265 21n 199 62 212 30-37 30-37 30-37 28 29 40 32 1600 860 1900 590 36000 3800 12000 3500 0.019-0.023 0.019-0.023 0.014-0.017 0.025 0.024 0.018 0.016 4.3x10⁻⁴ 8.2x10⁻⁵ 3.7x10⁻⁴ 8.5x10⁻⁴ 2.0x10⁻⁵ 1.9x10⁻⁴ 5.8x10⁻⁵ 1.4x10⁻⁴ 0.055-0.066 0.055-0.066 0.052-0.063 0.061 0.069 0.050 0.060 1.0x10⁻³ 2.3x10- 3 1.1x10⁻³ 3.2x10⁻³ 4.8x10⁻⁵ 5.3x10⁻⁴ 1.7x10⁻⁴ 5.4x10⁻⁴ Se NGS OBS SW HG Mn NGS OBS SW HG Fe NGS OBS SW HG Co NGS OBS SW HG
Water/ 6 Rock <130n >7600->38000 <0.02 33 9.0 41 37" 99 83 97 42 160 34 30 11 13 11 Extraction Efficiency3 (9. lx10 - 8 <9. 1x10 - 8 <9. lx10- 8 <6.5x10- 8 0.017 0.005 0.015 0.024 0.063 0.053 0.044 Alkali Extraction Efficiency4 <2.2x10⁻⁷ <2.6x10⁻⁷ <2.6x10⁻⁷ <2.5x10⁻⁷ 0.047 0.013 0.056 0.057 0.18 0.15 0.17 222-417KHn 1. 1K H <ln 35 24 35 15n 155 133 167 170n 287 181 335 6.3-12 9.3-17 6.3-12 73 7.1 8.3 6.6 59 35 55 30 0.059-0.11 0.040-0.076 0.079-0.042 0.010 0.099 0.085 0.076 0.012 0.020 0.013 0.017 0.17-0.32 0.12-0.22 0.16-0.30 0.023 0.28 0.24 0.29 0.029 0.057 0.036 0.064 1Units: M = moles/kg m = millimoles/kg = micromoles/kg n = nanomoles/kg. 2
The superscript denotes the source of the rock data: J = Juteau et al. (1980)
KH = Kay and Hubbard (1978) R = RISE Project Group (1980) W = Wedepohl (1969)
3
The water/rock ratio is assumed to be 0.5 for HG and 0.7 for NGS, OBS and
SW.
4
The water/rock ratio is assumed to be 1.7 for NGS, 1.9 for HG and 2.0 for OBS and SW. Element Ni NGS OBS SW HG Cu NGS OBS SW HG Zn NGS OBS SW HG Rock 1-5KHm 1.4KHm
1.1Hm
Ag NGS OBS SW HG Cd NGS OBS SW HG Pb NGS OBS SW HGdivided by the net addition to the solution is the water/rock ratio: water/rock ratio concentration in the rock/6.
These values are given in Table 2-3. This definition assumes a closed system. A difficulty is knowing the concentration in the rock accurately. The rock values have been taken from a variety of sources. Where possible
the rock concentration data were taken from the RISE Study Group (1980); Juteau et al. (1980); or Moore et al. (1977); all of whom analyzed rocks collected from 21 N on the EPR. Otherwise the values of Kay and Hubbard (1978) were used. If no other data were available the values given in the Handbook of Geochemistry (Wedepohl, 1969) were used. As the alkalis have
been shown to be almost quantitatively leached from the rocks in
experiments (Mottl and Holland, 1978) and to undergo only minor secondary reactions, they are the elements best used to determine the water/rock ratio. Many of the other elements appear to undergo secondary
precipitation reactions and this is apparent from their high calculated water/rock ratios (e.g. Ca and Mn). From the alkali results (Table 2-3) it
can be seen that the 21 N system has a low water/rock ratio of close to 1. This has important implications for the final solution and rock
composition.
A second parameter that can be determined if the water/rock ratio is known is the extraction efficiency:
Extraction - (water/rock ratio) x (net addition 6 to solution) Efficiency initial rock concentration
Based on the water isotopes, Craig and Welhan (personal communication) have calculated that the water/rock ratio is 0.5 at HG and 0.7 at SW, OBS and NGS. As mentioned above their are some difficulties in using the isotopic values. The uncertainities in this case would be much greater if
assumption of total extraction from the rock is an oversimplification. The water/rock ratios of Craig and Welhan have been used to calculate the
extraction efficiency in the fifth column of Table 2-3. The final column, alkali extraction efficiency, is calculated on the basis of potassium, the only alkali for which determinations in 21° N rocks are available.
Potassium is assumed to be quantitatively removed from the rock (extraction efficiency = 1) and the water/rock ratio obtained for each vent area from this calculation is used to calculate the extraction efficiency for the other elements. Values greater than one are physically impossible and are a result of the uncertainities in the calculation.
As the concepts of water/rock ratio and extraction efficiency are important in the following they will be discussed more fully. The
water/rock ratio is a measure of the total transfer of a species from rock to solution. It is often called an effective water/rock ratio (Ohmoto and Rye, 1974) because it is dependent on many factors. Seyfried and Mottl (1982) have defined it as the total mass of water which has passed through a hydrothermal system during its lifetime divided by the mass of altered rock within the system. In the case of 210 N this ratio is dependent on the "freshness" of the rock (i.e. if the rock has been previously altered), the pathlength (i.e. the amount of rock the solution comes in contact with, which may vary between vent areas), the time the solution spends in contact with the rock (presumably longer contact time will result in more being leached into the solution), whether the solution sees a different
temperature history at depth (precipitation or retrograde reactions may occur if the temperature drops or the leaching may be more efficient at a higher temperature). 210 N is also an open system rather than a closed flow system. As all of these complexities are incorporated into the term water/rock ratio it should be kept in mind that it is not truly a physical
"water/rock" ratio, but more a measure of the extent of reaction. The importance of the low water/rock ratios calculated for 21 N are that they
imply that the rock is very "fresh" and has undergone minimal previous alteration and that a small volume of water relative to rock is reacting.
(It also means the degree of reaction is very complete for the alkalis.) A large water/rock ratio may imply that relatively large volumes of water have previously reacted with a given amount of rock (i.e. it is already highly altered and the easily leachable species are gone) and the actual physical water/rock ratio could still be small. Alternatively it may mean that the pathlength is short and the circulation is fast so that the degree of reaction between the solution and solid is very small. A third
possibility is that the element has undergone secondary precipitation. The concept of water/rock ratio is a useful one as long as it is not taken to imply a literal physical parameter.
Extraction efficiency is a better term because it does not imply the physical parameter that water/rock ratio does. Unfortunately to calculate an extraction efficiency it is necessary to use a water/rock ratio. As much of the information to be gained from this parameter is on a
comparative element-to-element basis this is not a great disadvantage. With the attendant uncertainities of the basalt composition this calculation can at best provide a semi-quantitative understanding of whether an element is being quantitatively leached from the rock into solution (i.e. the
elemental composition of the solution is "rock-limited"). MAJOR ELEMENTS
The data are organized into the following groupings: Alkalis (Li, Na, K and Rb); Alkaline Earths (Be, Mg, Ca, Sr and Ba); Aluminum; Silica;
Carbon (pH and Alkalinity); Halogens (F and C1); and Sulfur (SO4 and H2S). The data are presented in both figures and tabular form. Data from the
Galapagos Spreading Center (GSC) hydrothermal solutions (Edmond et al., 1979a,b) are included in the tables of the 210 N and Guaymas data for comparison. All of the tabulated data are of the extrapolated endmember concentrations (Mg = 0, as discussed above). At Guaymas samples with low magnesium were sampled in some but not all of the vent fields and almost
every vent sampled has a different composition. The GSC data are the result of much greater extrapolations as no samples with Mg <50 mmoles/kg (seawater = 53 mmoles/kg) were obtained in this area. Consequently these values have a greater uncertainty.
The data for each element are also presented in a figure. The figures are all of the same form with the element of interest (y-axis) versus Mg (x-axis) and they are mixing lines between the hydrothermal endmember and seawater. These mixing lines are artifacts of the sampling procedure and are only useful for the soluble elements where they can aid in determining endmember composition with more confidence than by analyzing a few endmember samples alone. A discussion on an element by element basis follows.
THE ALKALIS
Lithium, sodium, potassium and rubidium were determined in the hydrothermal solutions.
Lithium: Lithium increases in all four vent areas sampled at 21 N (Figure 2-2). The HG vent area has the highest concentration, 1322
pmoles/kg, NGS is next at 1033 and the SW site at 899 and OBS site at 891 are indistinguishable. These values are comparable to the GSC values (Table 2-4) of 689-1142 pmoles/l, although the HG vent is higher. The lithium concentration in seawater is 26 moles/kg; the vent concentrations represent enrichment factors of up to 50 times the ambient values.
Approximately half of the lithium is removed from the rock (Table 2-3). The water/rock ratio calculated from Li is approximately twice that
0
5 18 15 20 25 35 48 45 50Mg mmoles/kg
Figure 2-2: Lithium versus magnesium at
210 N.
The
plot symbols
distinguish the four vent areas sampled and are as follows for this and all subsequent 210 N data plots:
+ = National Geographic Society (NGS)
= Ocean Bottom Seismograph (OBS)
= Southwest (SW) = Hanging Gardens (HG). 1400 1200 a,
0
E
Mz 1800 608 -~+
X>
+
o
A +
I 0.- I
.,I I I ,
,
p
.-055
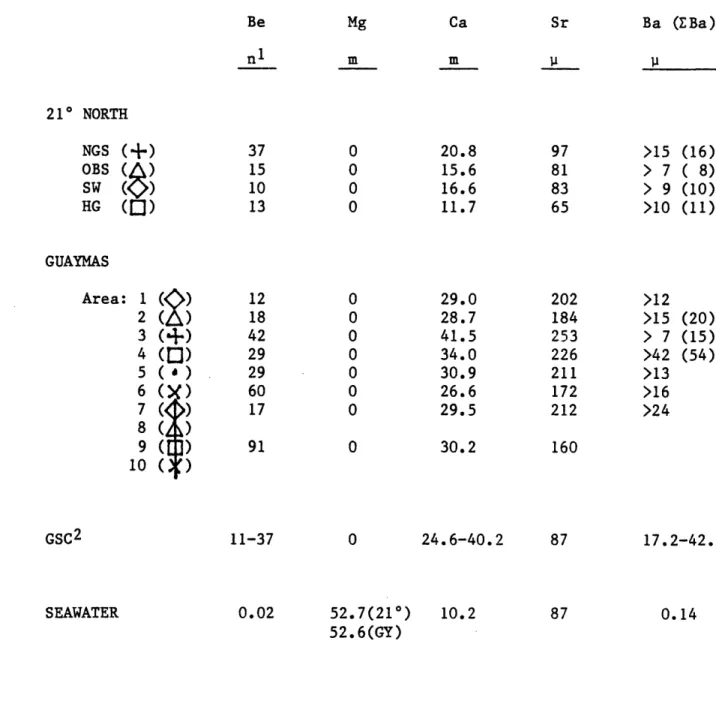
_· __Table 2-4: Endmember Concentrations - The Alkalis Li Na (calc)3 _l m 210 NORTH NGS (4.) 1033 510 OBS (A) 891 432 SW ( ) 899 439 HG ( ) 1322 443 GUAYMAS Area: 1 (C)) 1054 489 2 (z) 954 478 3 (4.) 720 513 4 (0) 873 485 5 ( ) 933 488 6 ( ) 896 475 7 ( ) 1076 490 8 ( ) 9 ( ) 630 480 10 ( ) GSC2 689-1142 26 SEAWATER 18.7-18.8 464(21°) 463(GY) 1Units: = micromoles/kg m = millimoles/kg 2
All GSC data is /liter.
3Sodium calculated from the charge balance.
K m Rb p 25.8 23.2 23.2 23.9 31 28 27 33 48.5 46.3 37.1 40.1 43.1 45.1 49.2 32.5 85 77 57 66 74 74 86 57 13.4-21.2 1.3 9.79
determined from the water isotopes (Craig and Welhan, pers. communication). Sodium: Sodium increases at NGS and decreases in the other three vent areas (Figure 2-3a). Sodium was measured by flame atomic absorption
spectrophotometry but the 2% error precludes separating endmembers in the other three sites. Once all the major species were measured, the charge balance was calculated for all the samples. In almost all cases it was <20 meq/kg (<2% of the total charge) and was randomly distributed between
excess positive and negative charge. It was therefore assumed that no major charged species was missing nor was there a systematic offset in one
or other of the measurements, and sodium was calculated from the charge balance (Figure 2-3b). The charge balance sodiums have greatly reduced scatter and different endmembers can be distinguished. From the ambient value of 464 mmoles/kg sodium increases at the NGS site to 510, while it
decreases to 432 at OBS, 439 at SW and 443 at HG. A more complete
discussion of the sodium will be deferred until after the chloride data (which are more precise) are presented. Both positive and negative trends were also observed at the GSC (Table 2-4). Since sodium and chloride
dominate over all the other charged species by at least an order of
magnitude in concentration, and given the magnitude of the sodium variation they must be tied together to maintain electroneutrality.
The behavior of Na is a result of its high starting concentration in the solution (which is almost the same as that in the rock). This is one of only a few elements which has a sink in the rock (in three vent areas). Na is not conservative with respect to C1 and a small amount may be added from the rock to the solution in the NGS area. Na is probably lost due to the formation of albite from anorthite (albitization):
-460 440 420 400 0 5 10 15 20 25 30 35 40 45 50 55
Mg
mmoles/kg
510 500 490 480 470 450 440 420 410 0 5 10 15 20 25 30 35 40 45 50 55Mg
mmoles/kg
Figure 2-3: Sodium versus magnesium at
210 N.
a. measured sodium.
b. sodium calculated from the charge balance. a)
0
E coz
-10)z
o3Ea <3, +~
++O
°o
+o
C> o o8 tt & A&0~~~~~~~~~~c
O'e~~~~ a A:~ __at depth in the system. This is a typical reaction of greenschist facies metamorphism. (Greenschist facies metamorphism occurs at temperatures of ~250-450° C and moderate to low pressures. The assemblage typically
contains chlorite + albite + epidote + quartz.) The gain of sodium may be due to the conversion of albite to chlorite, which is another mineral
typical of the greenschist facies.
NaAlSi308 + 3Mg2+ + 2Fe2+ + Al(OH)4 - + 6H20
+ Mg3Fe2A12Si03 10(OH)8 + Na+ + 8H+.
The reactions in this section are written for simplicity for the pure endmembers of the albite and anorthite solid solution series. The
composition used for chlorite (which also has a range in composition) is that found by Humphris (1977). Al is written as the Al(OH)4- species which is its dominant form in seawater. Based on thermodynamic modelling Al is probably present as A(OH) 3 at the pH of the hydrothermal solutions. As its speciation at the high temperature and pressure is unknown, although probably still a hydroxy species, the equations are written with A(OH)4-. A different speciation will change the proton balance but will not affect any of the other conclusions.
Potassium: Potassium exhibits a very limited variability between vent fields (Figure 2-4). NGS, at 25.8 mmoles/kg, has the highest potassium
concentration while HG has 23.9 and is just barely resolvable from the OBS and SW sites at 23.2. These values are significantly higher than the
18.7-18.8 mmoles/1 observed at the Galapagos (Table 2-4). The K values are approximately 2.5 times the seawater value of 9.79 mmoles/kg. Potassium,
like Li, has a high extraction efficiency from the rock and its calculated water/rock ratio (Table 2-3) is slightly higher than that of Craig and Welhan. K is assumed to be leached from the rocks by a H+ for K+ exchange.
+ 4
0 &,& 4
o+
+ + A I _I e I I I I 0 5 10 15 20 25 30 35 40 45 50 55Mg mmoles/kg
Figure 2-4: Potassium versus magnesium at 21 N. 26 24
0)
Cn d)0
E
E
18 16 14 12 10 0 _ __ __ + I I I I%;a *
o 0O, _Rubidium: As for potassium, there is very little variability in rubidium concentration in the 21° N vent fields (Figure 2-4). HG contains the most rubidium, 33 imoles/kg, followed by NGS at 31, OBS at 28 and 27 at SW. These values are consistently higher than the GSC values of 13.4-21.2 vmoles/l (Table 2-4). Rubidium and potassium both undergo retrograde reactions and are taken up by basalt during low temperature (<2000 C.) alteration (Hart, 1969). The lower values for both these elements at GSC may indicate that uptake reactions are occurring in that system.
Alternatively the GSC rocks may contain less of these elements due to either their original composition, or they may be more altered and have already had substantial amounts of these elements leached out. The 21 N values £o: rubidium are approximately 25 times the seawater concentrations of 1.3 moles/kg. Rubidium, like Li and K has a very high extraction efficiency . Its implied extraction efficiency may be >1, but this is probably a result of the uncertainty in the rock values.
Li/K is greatest at HG (0.06) and is approximately the same at the other three areas (NGS, OBS, SW = 0.04) (Figure 2-6). This is due to the higher concentration of Li at HG rather than a lower concentration of K. The basalt Li/K = 0.05 implying that the HG solutions may Li-rich and the other three vents Li-poor with respect to basalt. Li is an incompatible element and may be leached more quickly. The higher ratio may imply that HG is "fresher" rock that has undergone less leaching. Alternatively it
could imply a different substrate composition at HG or a higher glass/crystallinity ratio.
The above suggests that the alkalis (except for Na) are almost
quantitatively leached from the rock into the hydrothermal solutions at 210 N. Na is the only alkali which appears to undergo quantitatively important
35 25 15 10 0 0 5 10 15 20 25 30 35 40 45 5 55
Mg mmoles/kg
Rubidium versus magnesium at 21 N.
-, 0
E
c. A + -A$+
2 o
++
~~oo
o
& o
43- * I 1 _ _ _ · _ _ _ _Figure 2-5:
1408 1200 1 Cle C, -3
E
800 480 0 5 10 1 5 20 25 30 35 40 45 51K mmoles/kg
Figure 2-6: Lithium versus potassium at 210 N and Guaymas. All Guaymas vent areas are represented by .,Li/K in tholeiitic basalt is ~0.05 and in marine sediments is -0.01. The 21 N vent areas
range from 0.06 (HG) to 0.04 (NGS, OBS, SW). The Guaymas areas are 0.02.
THE ALKALINE EARTHS
This group of elements (Be, Mg, Ca, Sr and Ba were measured) shows the largest diversity of behavior. Beryllium, calcium and barium all increase in the solutions while Mg decreases and strontium both increases and
decreases.
Beryllium: Beryllium in the 210 N vents is enriched more than a
thousandfold over the ambient seawater concentration of 20 pmoles/kg (Table 2-5). Although Be has a large enrichment in the hydrothermal solutions, it is second only to Al in its low extraction efficiency from the rock (Table 2-3). NGS shows the largest increase to 37 nmoles/kg followed by OBS 15, HG 13 and SW at 10 (Figure 2-7). The same range in concentration is observed at the GSC. Several of the vents at SW were sealed (inactive) until excavated by the submarine. These vents have higher beryllium contents (up to 17 nmoles/kg); second only to NGS. These higher
concentrations may be due to the hot water sitting inside the chimney or rock conduits and "cooking", causing additional leaching of Be into the solutions. This hypothesis cannot at present be proven as too little is known about the geochemistry of this element to postulate possible controls on its solution chemistry.
Magnesium: Magnesium decreases in all the vent fields and is assumed to reach zero in the hydrothermal endmember (Table 2-5) although this
cannot be directly proven. As discussed above, magnesium is used as an indicator of mixing between the hydrothermal solutions and seawater. Magnesium decreases to approximately 1 mmole/kg in all the fields except for NGS where 2.1 mmoles/kg is the minimum value measured. The zero magnesium endmember agrees with the Galapagos extrapolation of zero magnesium at 3440 C. (Edmond et al., 1979a).
Table 2-5: Endmember Concentrations - The Alkaline Earths Be Mg Ca Sr n1 m m P 210 NORTH NGS (+) 37 0 20.8 97 OBS
(I)
15 0 15.6 81 SW (O) 10 0 16.6 83 HG (I0) 13 0 11.7 65 GUAYMAS Area: 1 () 12 0 29.0 20 2 ( ) 18 0 28.7 18 3 (+) 42 0 41.5 25 4 (Q) 29 0 34.0 224 5 () 29 0 30.9 21 6 (X) 60 0 26.6 17 7 (<>) 17 0 29.5 21: 8 ( ) 9 ( ) 91 0 30.2 161 lO ( ) GSC2 11-37 SEAWATER 0.02 0 52.7(210) 52.6(GY) 24.6-40.2 10.2 2 4 3 6 1 2 2 D 87 87 1 Units: n = nanomoles/kg 1 = micromoles/kg m = millimoles/kg 2All GSC data is /liter.
Ba (Ba) 11->15 (16) > 7 ( 8) > 9 (10) >10 (11) >12 >15 (20) > 7 (15) >42 (54) >13 >16 >24 17.2-42.6 0.14
25 20 15 18 5 0 0 5 10 15 20 25
38
35 40 45 50 55Mg mmoles/kg
Figure 2-7: Beryllium versus magnesium at 21 N. 40 a)
0
E
C.
m
O + .T.!-O .A (13 . t J - -- ' , I ,Calcium: Calcium increases by varying amounts in all the vent areas (Figure 2-8). The HG area has the smallest increase to only 11.7 mmoles/kg (seawater contains 10.2 mmoles/kg), while OBS reaches 15.6, SW 16.6 and NGS 20.8. Once a correction is made for water loss due to hydration, HG has only a 0.7 mmole/kg increase (see C1 discussion). These calcium
increases are considerably less than the 24.6-40.2 mmoles/l observed in the GSC vents (Table 2-5). The scatter in the 210 N calcium is greatly reduced when it is examined relative to the sulfate data (Figure 2-9). Apparently anhydrite (CaSO4) particles from the chimneys were entrained in several of
the samples, especially those from the SW vent area, and its dissolution caused anomalously high calcium and sulfate values.
The 210 N calcium concentrations are the lowest observed in any submarine hydrothermal system and this low extraction efficiency (Table 2-5) is probably due to the secondary precipitation of Ca-silicates at depth. Epidote is the most common Ca-silicate mineral found in greenschist facies altered submarine rocks. Epidote was not formed in the experiments
(the reason for this is not clear but may be a nucleation p blem) but other Ca phases were. For the purpose of simplicity Ca will be assumed to enter an epidote phase. Ca may be leached into solution by a H+ exchange
or by albitization of anorthite:
Na+
+ CaA1
2Si
0
2 8+ H4SiO
4 +NaAlSi
3O
8+ Ca
2+ + A(OH)
4-.
It may be lost by the formation of epidote:Ca
2+ + CaA1
2Si
0
2 8+ A(OH)
4+ H
4SiO
4+
Ca
2A1
3Si
0
3 12(OH) + 3H
20 + H
+.
If alteration under the temperature and pressure conditions of greens-hist facies metamorphism continues epidote may be converted to chlorite with a resultant release of Ca:
Ca2A13Si301 2(OH) + 3Mg2+ + 2Fe2+ + 9H20
20 18 16 , 14 12 10 0 5 10 15 20 25 30 35 40 45 50 55
Mg mmoles/kg
Calcium versus magnesium at 21 N.
(a
E
E
0
4-o 4-o
++ +
LO '++ '& A + + 0 Zi 0 o CZE . . .> .. 0 D _ 4p *ACh _ __ __ __ r __ _1 IFigure 2-8:
U 5 10 1 5 20 25 30 3
Mg mmoles/kg
40 45 50 55
Figure 2-9: (Calcium - sulfate) versus magnesium at 21 N.
1 t 15 Co r1: 10 C. ¢C)
0
E: Ei e-5
-15 1% MThe cycle of Ca is therefore complex with numerous source and sink reactions available. Note that the precipitation of calcium, as in an epidote phase causes the release of protons. These reactions may aid in maintaining the acidity of the solutions once the Mg is consumed.
Strontium: Strontium is the only element besides sodium (and chloride) to have both increasing and decreasing trends (Figure 2-10). Like sodium (and chloride), it increases at NGS to 95 moles/kg while
decreasing at HG to 65 moles/kg. It decreases slightly from the seawater concentration of 87 moles/kg to 83 moles/kg at SW and to 81 moles/kg at OBS. The endmember concentration was calculated using only those samples with Mg <5 mmoles/kg as entrainment of anhydrite containing strontium in
the middle (mixed) samples gives artificially high values. Within the resolution of the GSC data, strontium appeared to remain unchanged from the seawater value (Table 2-5), which is consistent with the small
concentration anomalies seen at GSC.
The Sr isotopes vary very slightly between the vents, but with values of 0.703 (T. Trull, unpublished data) they are almost completely exchanged with the basalt.
Strontium has a very low extraction efficiency (Table 2-3) yet the isotopic data show that it. is almost completely exchanged with the basalt. The most likely explanation is either that the small total change in
concentration is just fortuitous or solubility controlled by an unspecified phase, and that it undergoes the same release/precipitation reactions as Ca at depth which allow the isotopes to become completely exchanged. Humphris and T'hompson .(1978a) found enrichments of Sr in epidotes, in support of this hypothesis.