Publisher’s version / Version de l'éditeur:
Journal of applied physics, 107, 12, pp. 123510-1-123510-9, 2010-06-18
READ THESE TERMS AND CONDITIONS CAREFULLY BEFORE USING THIS WEBSITE. https://nrc-publications.canada.ca/eng/copyright
Vous avez des questions? Nous pouvons vous aider. Pour communiquer directement avec un auteur, consultez la première page de la revue dans laquelle son article a été publié afin de trouver ses coordonnées. Si vous n’arrivez pas à les repérer, communiquez avec nous à [email protected].
Questions? Contact the NRC Publications Archive team at
[email protected]. If you wish to email the authors directly, please see the first page of the publication for their contact information.
NRC Publications Archive
Archives des publications du CNRC
This publication could be one of several versions: author’s original, accepted manuscript or the publisher’s version. / La version de cette publication peut être l’une des suivantes : la version prépublication de l’auteur, la version acceptée du manuscrit ou la version de l’éditeur.
For the publisher’s version, please access the DOI link below./ Pour consulter la version de l’éditeur, utilisez le lien DOI ci-dessous.
https://doi.org/10.1063/1.3448232
Access and use of this website and the material on it are subject to the Terms and Conditions set forth at
Surface-directed spinodal decomposition in the pseudobinary alloy
(HfO2)x(SiO2)1−x
Liu, J.; Wu, X.; Lennard, W. N.; Landheer, D.; Dharma-Wardana, M. W. C.
https://publications-cnrc.canada.ca/fra/droits
L’accès à ce site Web et l’utilisation de son contenu sont assujettis aux conditions présentées dans le site LISEZ CES CONDITIONS ATTENTIVEMENT AVANT D’UTILISER CE SITE WEB.
NRC Publications Record / Notice d'Archives des publications de CNRC:
https://nrc-publications.canada.ca/eng/view/object/?id=16c3ff85-c7fa-4ceb-b36a-a96063bb849f https://publications-cnrc.canada.ca/fra/voir/objet/?id=16c3ff85-c7fa-4ceb-b36a-a96063bb849f
Surface-directed spinodal decomposition in the pseudobinary alloy
„HfO
2…
x„SiO
2…
1−xJ. Liu,1,a兲 X. Wu,2W. N. Lennard,1D. Landheer,2and M. W. C. Dharma-Wardana2
1
Department of Physics and Astronomy, University of Western Ontario, London, Ontario N6A 3K7, Canada 2
Institute for Microstructural Sciences, National Research Council of Canada, Ottawa, Ontario K1A 0R6, Canada
共Received 17 March 2010; accepted 14 May 2010; published online 18 June 2010兲
Hf silicate films 共HfO2兲0.25共SiO2兲0.75with thicknesses in the range 4–20 nm were grown on silicon
substrate by atomic layer deposition at 350 ° C. Hf distributions in as-grown and 800 ° C annealed films were investigated by high resolution transmission electron microscopy 共HRTEM兲, angle-resolved x-ray photoelectron spectroscopy 共ARXPS兲, and medium energy ion scattering 共MEIS兲. HRTEM images show a layered structure in films thinner than 8 nm. The ARXPS data also reveal a nonuniform distribution of Hf throughout the film depth. Diffusion of SiO2 to the film
surface after a longer time anneal was observed by MEIS. All these observations provide evidence for surface-directed spinodal decomposition in the pseudobinary 共HfO2兲x共SiO2兲1−xalloy system.
© 2010 American Institute of Physics. 关doi:10.1063/1.3448232兴
I. INTRODUCTION
When an initially homogeneous binary mixture is rap-idly quenched into an unstable state below the critical tem-perature, phase separation occurs via diffusion which results in a composition fluctuation throughout the system. In the bulk mixture where the interfacial and elastic energies can be neglected, the composition fluctuation results in a random isotropic microstructure comprised of phase regions enriched in either component.1,2The single-phase domains then grow with time corresponding to the coarsening of the phase-separated structure.3 This phenomenon has been referred to as spinodal decomposition 共SD兲. In thin films where the translational and rotational symmetries are broken due to the presence of interfaces or free surfaces, SD may interact with wetting phenomena resulting in a very different structure at the film boundaries compared to the bulk behavior, which has been recognized as surface-directed SD 共SDSD兲.4–8 Experiments4–6and simulations7,8have shown that in SDSD, a composition wave normal to the film surface forms at the surface due to the preferential attraction of the surface to one of the two components. This wave then propagates into the film bulk and decays because of thermal noise.9Most experi-mental studies in SDSD have been carried out in polymer mixtures4–6where the associated phase diagrams can be tai-lored and a small self-diffusion coefficient slows the SD dy-namics. While it is predicted that SD could occur in any two-component system whose phase diagram shows a misci-bility gap, such as the ZrO2– SiO2, HfO2– SiO2,
La2O3– SiO2, or Y2O3– SiO2 systems,
10
observations of SDSD in thin solid films have not yet been reported by other groups.
As the size of complementary metal oxide semiconduc-tor 共CMOS兲 transissemiconduc-tors rapidly shrinks, the thickness of the traditional gate dielectrics, i.e., SiO2and SiOxNy, enters into
a subnanometer regime.11 In this thickness range, the
in-crease in direct tunneling current through the gate oxide raises significant power consumption and device reliability issues. In order to reduce the gate leakage current, materials 共so called high兲 with dielectric constants larger than SiO2
have been widely investigated so that a thick dielectric layer could be used as a gate insulator to improve transistor performance.12,13 Pseudobinary alloys 共ZrO2兲x共SiO2兲1−x and
especially 共HfO2兲x共SiO2兲1−x, have been considered as the
most promising candidates to replace SiO2 and SiOxNy in
CMOS technology due to their thermal stability on Si and moderately high dielectric constants.14Amorphous thin films are suitable for CMOS transistors since grain boundaries in polycrystalline structures can introduce conducting paths.15 However, phase separation has been reported in 共ZrO2兲x共SiO2兲1−x and 共HfO2兲x共SiO2兲1−x systems with x
= 0.15– 0.80 at a typical dopant activation temperature with the attendant crystallization of ZrO2 or HfO2.
16,17
Kim and McIntyre10 calculated the metastable extensions of the mis-cibility gap and spinodal for the ZrO2– SiO2system based on
available phase diagrams and predicted that, upon rapid ther-mal annealing at conventional device processing tempera-tures, the 共ZrO2兲x共SiO2兲1−xsystem with a composition in the
spinodal 共x = 0.1− 0.6兲 will separate into two phases having compositions given by such metastable extensions of the miscibility gap. They further simulated the effect of the 共ZrO2兲x共SiO2兲1−x film/Si substrate interface on SD and
pre-dicted a composition wave normal to the substrate surface which decays when propagating into the bulk of the film. It is expected that the 共HfO2兲x共SiO2兲1−x system would
experi-ence the same phase separation during annealing due to the similarity of the chemical properties of Hf and Zr silicates.
Previously, we reported cross-sectional high resolution transmission electron microscopy 共HRTEM兲 and high angle annular dark field scanning transmission electron microscopy 共HAADF-STEM兲 images that showed SDSD in 共HfO2兲0.25共SiO2兲0.75films which were grown by atomic layer
deposition 共ALD兲 at 350 ° C and annealed at 800 ° C.18Here a兲
Electronic mail: [email protected].
we present more experimental evidence of SDSD in these films, i.e., the line intensity profiles extracted from the cross-sectional HRTEM images, the angle-resolved x-ray photo-electron spectroscopy 共ARXPS兲 Hf 4f peaks, medium en-ergy ion scattering 共MEIS兲 measurements and plan-view HRTEM images that show a layered structure for the 共HfO2兲0.25共SiO2兲0.75films and the growth of the composition
wave during a longer time annealing. II. EXPERIMENTS
共HfO2兲0.25共SiO2兲0.75 thin films were grown on p-type
Si共100兲 substrates by ALD using the precursors tetrakis共di-ethylamido兲hafnium and tris共2-methyl-2-butoxy兲silanol. The detailed growth procedure has been described previously.19 ALD utilizes the self-limiting reaction mechanism between gaseous precursors and the surface species to produce a thin film one atomic layer at a time.20 During a growth cycle, each precursor was introduced separately into the deposition chamber. Alternate precursor pulses were separated by an inert gas purge step. The precursor pulse cycles were re-peated until the desired film thickness was achieved. Prior to deposition, the substrate was heated to 500 ° C for 300 s in an O2 environment to oxidize the H-terminated surface. In situXPS data showed that the oxidation process resulted in a ⬍0.5 nm Si thermal oxide. Films with thicknesses in the range 4–20 nm were grown while the substrates were held at 350 ° C. An ex situ rapid thermal anneal 共RTA兲 was subse-quently performed in N2 at 800 ° C for 6 s. In order to
in-vestigate the Hf depth profiles in both the as-grown and an-nealed films, 具011典 cross-sectional TEM samples were prepared using standard dimpling and ion milling procedures and subsequently characterized by HRTEM and HAADF-STEM in a JEOL JEM-2100F TEM operating at 200 kV. The HRTEM and HAADF-STEM images are referred to as bright field 共BF兲 and dark field 共DF兲 images, respectively. The film composition variation with depth was also investigated by ARXPS using monochromatic Al K␣x rays. The MEIS tech-nique was also used to study Hf profiles in the as-grown and annealed thin films. MEIS experiments were performed us-ing incident 95 keV hydrogen ions wherein a double align-ment 共channeling/blocking兲 geometry 共具101典in and 具101¯典out兲
was employed to collect the scattered ions in a two-dimensional detector. The equipment description and experi-mental setup are described in detail in Kim et al.21
III. RESULTS AND DISCUSSION
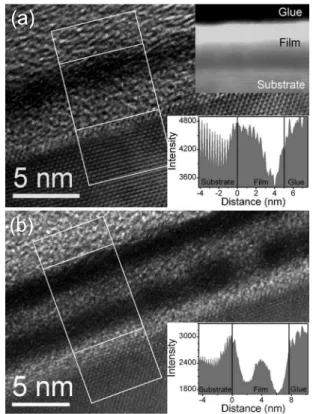
Figure 1共a兲 shows the BF image of a 5 nm as-grown film. The darker area near the surface indicates a region of higher Hf concentration relative to the brighter area close to the substrate. The upper inset of Fig. 1共a兲 shows the DF image of the 5 nm film. The contrast in the DF image is reversed relative to the BF image such that the DF image is more sensitive to the atomic number of the constituent at-oms. Both images confirm the Hf-rich top region and the Hf-deficient 共i.e., Si-rich兲 bottom region of the film. The lower inset of Fig.1共a兲shows the line intensity profile inte-grated over the width of the rectangle shown in the BF im-age. This profile represents the Hf distribution in the
direc-tion normal to the substrate surface. A lower intensity region corresponds to a higher Hf concentration. The line intensity profile clearly shows a wavelike Hf distribution throughout the film. The 5 nm film separates into two layers with the layer closer to the substrate Si-rich and the layer closer to the surface Hf-rich. The TEM images of thinner as-grown films 共4 nm兲 show a similar structure, see Fig.1共b兲.
Figure 1共c兲 shows the BF and DF images and the line
FIG. 1. BF images of as-grown films: 共a兲 5 nm; 共b兲 4 nm; 共c兲 6.4 nm; and 共d兲 12 nm. The upper insets show the corresponding DF images and the lower insets show the line intensity profiles integrated over the width of rectangles in the BF images.
intensity profile of a 6.4 nm grown film. The 6.4 nm as-grown film is comprised of four layers starting from the sub-strate: Si-rich, Hf-rich, Si-rich, and Hf-rich layers. The line intensity profile for this film 关Fig. 1共c兲, lower inset兴 shows that the Hf-rich layer closer to the substrate has a lower Hf concentration than the Hf-rich layer closer to the film sur-face. The Hf concentration difference in these two layers cannot be resolved in the DF image 关Fig.1共c兲, upper inset兴. As the film thickness increases to 12 nm, the layered structure can hardly be identified in the BF image 关Fig.1共d兲兴. The line intensity profile 关Fig.1共d兲, lower inset兴 shows that there are Hf-rich layers close to both the surface and inter-face. The DF image of this film 关Fig. 1共d兲, upper inset兴 shows that there is a Si-rich layer on the substrate. This layer is followed by a Hf-rich layer. In the center of the film, Hf-rich clusters are mixed with Si-rich clusters.
The distances of the centers of the first Hf-rich layers from the substrates for the 4 nm, 5 nm, 6.4 nm, and 12 nm films are 2.8 nm, 3.5 nm, 1.7 nm, and 1.4 nm, respectively. It can be concluded that as the film thickens beyond 5 nm in the film deposition process, some of the Hf atoms in the Hf-rich layer closer to the film surface diffuse towards the substrate. As already specified, the interface Si thermal oxide is ⬍0.5 nm thick. Therefore, the Hf-deficient layer close to the substrate in Figs. 1共a兲 and 1共b兲 is not all thermal SiO2
since its thickness is too large, i.e., significantly ⬎0.5 nm, and it is a Si-rich layer of the film.
Figure2共a兲shows the BF image of the 5 nm film shown in Fig. 1共a兲after RTA. The thickness of this film decreases slightly after annealing due to the densification that occurs during annealing. The film is still comprised of two layers with the layer closer to the substrate Si-rich. The line inten-sity profile 关Fig.2共a兲, lower inset兴 shows a change in the Hf distribution with respect to the profile shown in the lower inset of Fig. 1共a兲for the as-grown film, indicating an inter-diffusion of the Hf and Si atoms during the annealing pro-cess. This interdiffusion was confirmed by the binding en-ergy 共BE兲 shift in the Hf 4f ARXPS peaks.
Figure3 shows the Si 2p, Hf 4f, and O 1s XPS peaks at a photoelectron takeoff angle,, of 75° and 45° for the 5 nm film before and after RTA. The Si 2p3/2 peak from the
substrate at 99.3 eV is used as a reference. The BEs and intensities of the Si 2p peaks from the film for both photo-electron takeoff angles barely changed before and after RTA 关Fig. 3共a兲兴. The BE of the Hf 4f7/2 peak for the as-grown
film shifts to higher energy by 0.27 eV as increases from 45° to 75°, indicating a higher Si concentration in the film layer closer to the substrate since the ARXPS signal is more surface sensitive at lower and a higher Hf concentration in Hf silicate films results in a shift in BE to lower energy.22 This observation is in accord with the HRTEM images of Fig. 1共a兲. The intensity of the Hf 4f peak at = 45° de-creases after RTA, suggesting a diffusion of Hf atoms to-wards the substrate which results in an increase in Hf con-centration in the film layer closer to the substrate, and therefore a shift 共0.14 eV兲 in the Hf 4f peak to lower BE at
= 75° after RTA. The area of the O 1s peak corresponding to the Si–O–Hf bond component 关Fig. 3共c兲, as-grown 45°兴
also decreases after RTA, which is in agreement with the observed decrease in the Hf 4f peak intensity at= 45° after RTA.
Figure 2共b兲 shows the BF and DF images and the line intensity profile for the 6.4 nm film after RTA. Comparing Fig. 2共b兲 to Fig. 1共c兲, it can be concluded that after RTA, some of the Hf atoms in the Hf-rich layer closer to the film surface diffuse to the Hf-rich layer closer to the substrate and
FIG. 2. BF images of 共a兲 5 nm; 共b兲 6.4 nm; 共c兲 8 nm; and 共d兲 12 nm films after RTA. The upper insets show the corresponding DF images and the lower insets show the line intensity profiles integrated over the width of rectangles in the BF images.
the distance between the first Hf-rich layer and the substrate decreases. After RTA, the 6.4 nm film separates into three layers: a Si-rich layer sandwiched between two Hf-rich lay-ers. It is believed that the 0.5 nm thick interface layer in Fig.
2共b兲 is Si thermal oxide formed during the substrate oxida-tion process before film deposioxida-tion.
Figures2共c兲shows the BF and DF images and the cor-responding line intensity profile for a film after RTA. This film is 7 nm thick after RTA—1 nm thicker than the film shown in Fig. 2共b兲—and it consists of four layers starting from the substrate: Si-rich, Hf-rich, Si-rich, and Hf-rich lay-ers.
The layered structure can hardly be identified in the BF image of the 12 nm film after RTA 关Fig. 2共d兲兴. The line intensity profile of this film 关Fig. 2共d兲, lower inset兴 shows that the Hf concentration near the surface and interface is slightly higher than that in the film. The DF image of this film 关Fig.2共d兲, upper inset兴 shows that there is a Si-rich layer close to the substrate, which is followed by a Hf-rich layer. Above these two layers, Hf-rich domains are mixed with Si-rich domains.
The above shown TEM images strongly suggest that the structure of these 共HfO2兲0.25共SiO2兲0.75 films is caused by
SDSD. A composition wave normal to the substrate surface is observed. If the composition wavelength, C, is defined as
the distance between the centers of two successive Hf-rich layers, then C measured from the TEM images 关Figs.2共b兲
and 2共c兲兴 is ⬃4 nm. If the film is thinner than 8 nm 共i.e., 2C兲, a layered structure is observed via TEM throughout the
entire film: the surface layer is Hf rich and the layer closest to the interface Si oxide can be Si rich or Hf rich depending on the film thickness. If the film thickness is Cor 2C, the
layer closest to the interface is Si rich. If the film thickness is 1.5C, the layer closest to the interface is Hf rich. This result
is rather surprising because the 共HfO2兲0.25共SiO2兲0.75 films
were grown on a very thin layer of Si thermal oxide. The Si-rich component in these films should have a lower inter-face energy with the interfacial Si thermal oxide layer. Therefore, it was to be expected that the film layer closest to the interface should always be a Si-rich layer. As the film thickens to ⬎2C, a Si-rich layer followed by a Hf-rich layer
is observed at the film/Si interface 关Fig.2共d兲兴 and there is no continuous Hf-rich layer in the center of the film, indicating a tendency for decay of the composition wave.
To further study the effect of film thickness on the film structure, dilute HF 共0.4%兲 was used to etch back the 6.4 and
12 nm films. Before etching, the 共HfO2兲0.25共SiO2兲0.75 films
were subjected to the usual RTA process to reduce the etch-ing rate23and to achieve the layered structure shown in Fig.
2共b兲 for the 6.4 nm film. After etching, the RTA step was repeated. Spectroscopic ellipsometry was used to monitor the etching rate, 共i.e., the film thickness was measured after ev-ery 4 s etch兲. For the 6.4 nm film, XPS was also used to measure film thickness24before and after etching.
Figure 4共a兲 shows the BF and DF images and the line intensity profile for the 6.4 nm film after RTA, HF etch, and RTA. A layer of 2 nm film was removed after the HF etch, i.e., the top Hf-rich layer in Fig. 2共b兲 was removed. The Hf-rich layer closest to the substrate in Fig.2共b兲has diffused to the top of the film after the HF etch and following the second RTA, resulting in a structure similar to that in Fig.
2共a兲, which corresponds to a 5 nm film 共annealed兲 on a Si substrate. The thickness of the film after RTA shown in Fig.
FIG. 3. 共Color online兲 ARXPS peaks for the 5 nm film before and after RTA at= 45° and 75°: 共a兲 Si 2p; 共b兲 Hf 4f; and 共c兲 O 1s.
FIG. 4. BF images of 共a兲 6.4 nm and 共b兲 12 nm films after RTA, HF etch, and RTA. The upper inset in 共a兲 shows the corresponding DF image and the lower insets in 共a兲 and 共b兲 show the line intensity profiles integrated over the width of rectangles in the BF images.
4共a兲 is 1 nm greater than expected after HF etching, which can likely be explained by oxidation of the Si substrate dur-ing the annealdur-ing process via water molecules absorbed in the film during the HF etching process.
Figure4共b兲shows the BF image and the corresponding line intensity profile for the 12 nm film after RTA, HF etch 共removing ⬃6 nm兲, and RTA. The Si-rich layer closest to the substrate is probably thermal SiO2formed after HF
etch-ing and the second RTA. The line intensity profile shown in the lower inset of Fig.4共b兲reveals a wavelike distribution of Hf atoms in the direction perpendicular to the substrate sur-face. The predominantly layered structure, which was not observed for the 12 nm film 关Figs. 1共d兲 and 2共d兲兴, appears when the film thickness is reduced to a value in the region of ⱗ2C.
According to the theory and simulation of SDSD, the single-phase domain, and therefore the composition wave-length in thin films, will increase as the annealing time in-creases, which corresponds to a coarsening of the phase-separated structures.7,10 In order to search for this phenomenon in Hf silicate films, longer time anneals were performed for the 6.4 and 12 nm films. Figure5共a兲shows the BF and DF images and the line intensity profile for the 6.4 nm film after a 600 s anneal at 800 ° C in N2. Only one
Hf-rich layer and one Si-rich layer are observed indicating a growth of single-phase regions during a longer time anneal. The thickness of this film has increased by ⬃1 nm com-pared to the thickness after RTA 关Fig. 2共b兲兴 as a result of diffusion of the O2 impurity in N2 to the interface where
oxidation of the substrate occurs.25
The plan-view BF images presented in Figs. 6共a兲 and
6共b兲 show the 6.4 nm film after RTA and 600 s anneal at 800 ° C in N2, respectively. These images also indicate a
growth of either the Hf-rich or Si-rich domains 共i.e., either the dark or the bright areas兲 in the plane of the film during a longer time anneal.
Figure7shows the Hf 4f ARXPS peaks 共at= 45° and 75°兲 for the 6.4 nm as-grown film, and for the same film after RTA and 600 s anneal at 800 ° C in N2. For the as-grown and
RTA films from the surface to 4 nm depth, the 6.4 nm film 关Figs.1共c兲and2共b兲兴 has a similar structure as the 5 nm film 关Figs. 1共a兲 and 2共a兲兴, i.e., a Hf-rich layer near the surface followed by a Si-rich layer. The number of photoelectrons that escape from the film decreases exponentially with depth. The contribution to the XPS peak from the Hf-rich layer closest to the substrate 关Figs. 1共c兲 and 2共b兲兴 is negligible compared with the contribution from the layers above. It is therefore not surprising that Hf 4f peaks from the 6.4 nm film have similar shifts as those peaks from the 5 nm film when changes from 45° to 75° before and after RTA. For the as-grown film, the Hf 4f7/2peak shifts to higher energy
by 0.23 eV as increases from 45° to 75°. At = 75°, the Hf 4f7/2peak shifts 0.08 eV to lower energy after RTA
com-pared with the as-grown film. After a 600 s anneal, the Hf 4f7/2peaks shift to a higher BE for both= 45° and 75°,
indicating that the Hf-rich phase in the film after a longer time anneal has a lower Hf concentration than that in the
FIG. 5. BF images of 共a兲 6.4 nm and 共b兲 12 nm films after a 600 s anneal at 800 ° C in N2. The upper insets show the corresponding DF images and the
lower inset in 共a兲 shows the line intensity profile integrated over the width of rectangle in the BF image. Some of the crystalline HfO2 regions are
encircled.
FIG. 6. Plan-view BF images of the 6.4 nm film after 共a兲 RTA and 共b兲 600 s anneal at 800 ° C in N2.
FIG. 7. 共Color online兲 ARXPS Hf 4f peaks for the 6.4 nm as-grown film, and for the same film after RTA and 600 s anneal at 800 ° C in N2.
as-grown film or in the film after RTA. However, the Hf 4f7/2
peak after 600 s anneal shifts to higher BE by 0.15 eV as
increases from 45° to 75°, still indicating a higher Hf con-centration in the film layer closer to the surface, which is in agreement with the TEM image 关Fig.5共a兲兴. The intensities of these Hf peaks cannot be compared directly because they are not aligned to a reference.
Figure5共b兲shows the BF and DF images for the 12 nm films after a 600 s anneal at 800 ° C in N2. Comparing to the
film thickness after RTA 关Fig.2共d兲兴, it can be concluded that a ⬃2 nm thick layer of thermal SiO2, i.e., almost all the
Si-rich layer close to the substrate in Fig. 5共b兲, has grown during the 600 s anneal. HfO2 crystallites were observed in
this film indicating that nucleation and growth of HfO2
oc-curred after SD during the annealing process. The DF image of this film 关Fig. 5共b兲, upper inset兴 is similar to Fig. 2共d兲: there is a Si-rich layer on the substrate with a ⬃2 nm Hf-rich layer on top; above these two layers, Hf-Hf-rich clusters are mixed with Si-rich clusters. HfO2 crystallites are not
ob-served for films thinner than 12 nm even after an anneal at 800 ° C in N2 for 600 s, which is not surprising since the
onset of crystallization of HfO2 in Hf silicate films depends
on both film composition26and thickness.27
In the nucleation and growth mechanism, for a nucleus to be stable with respect to further growth, it must reach a critical size. Smaller nuclei are unstable and may dissolve because of surface energy effects and their large surface to volume ratio.28Therefore the nucleation and growth process is suppressed in thinner films and a higher temperature is needed for crystallization to occur.27 In contrast, HfO2
crys-tallites with dimension of 5–8 nm were observed in a 20 nm as-grown film 共Fig. 8兲, which suggests that the nucleation and growth mechanism follows the SD during the film depo-sition process at 350 ° C.
From those cross section TEM images, e.g., Figs.1,2,4, and 5, it seems that the film layer closest to the surface is always a Hf-rich layer. However, if a Si-rich layer is on the surface, it is difficult to resolve this layer from the glue that is used to prepare the TEM sample. In order to examine the film composition as a function of film depth, Hf/ 共Hf+ Si兲 values were extracted from ARXPS measurements and the results are presented in TableIfor various values. The Hf concentration, which is proportional to the Hf/ 共Hf+ Si兲 ratio, decreases towards the surface for all films 共therefore imply-ing an increase in the Si concentration兲. Comparimply-ing the Hf
concentration in the as-grown and annealed films at= 10°, more SiO2 is observed to diffuse to the film surface during
annealing which suggests a wetting of the film surface by the SiO2-rich component. Previously, simulation results showed
that the Si-rich phase contains ⬎98 mol % SiO2 in the
共ZrO2兲x共SiO2兲1−x system after phase separation during
900 ° C anneals.10 Assuming that the Si-rich phase in the 共HfO2兲0.25共SiO2兲0.75 films is pure SiO2, then the thickness of
the surface layer of the films can be estimated. The escape depth 共e兲 of Si 2p photoelectrons excited by Al K␣x rays
in SiO2is 3 nm,
24
which should be a reasonable estimate as well for Hf silicate films. The sampling depth then varies from 9 nm 共3e兲 at = 90° to 1.6 nm at = 10°. Assuming
that the film composition determined at = 75° corresponds to the average composition, then the thickness of the surface SiO2layer is estimated to be ⬃0.4– 0.7 nm, i.e., equivalent
to 1–2 layers of SiO2.
MEIS measurements were also performed to study the film composition and the Hf depth profile for the 6.4 nm film. Figure 9 shows the MEIS spectra for the 6.4 nm as-grown film and for the same film after RTA and a 600 s anneal at 800 ° C in N2. The MEIS spectra are aligned to the
O edge. As can be seen, the Si edges of the three spectra are also aligned. The Hf edge shifts slightly to lower energy after RTA, indicating a diffusion of the HfO2 component to the
substrate or a diffusion of SiO2 to the film surface. After a
600 s anneal, the Hf edge shifts to lower energy by 120 eV. If the density of the surface SiO2 layer is assumed to be
2.2 g / cm3, then this energy shift corresponds to a diffusion
of 0.35 nm SiO2 to the film surface during the 600 s anneal
FIG. 8. BF images of a 20 nm as-grown films. Some of the crystalline HfO2
regions are encircled.
TABLE I. Hf concentration extracted from ARXPS peak intensities.is the photoelectron takeoff angle.
Film thickness 共nm兲 Film description Hf/ 共Hf+ Si兲 75° 45° 10° 5 As-grown 0.262 0.261 0.249 5 RTA 0.260 0.249 0.225 6.4 As-grown 0.242 0.246 0.228 6.4 RTA 0.225 0.236 0.198 6.4 600 s anneal 0.220 0.223 0.189 12 600 s anneal 0.239 0.235 0.178 12 RTA, HF etch, RTA 0.222 0.212 0.140
FIG. 9. 共Color online兲 MEIS spectra of the 6.4 nm film: as-grown, after RTA and after 600 s anneal at 800 ° C in N2.
process. This result is in good agreement with the estimate of the surface SiO2 layer thicknesses from ARXPS data and
confirms that the film surface is wetted by the SiO2 layer
after anneal. Compared to the as-grown film, the Si and O peaks are obviously wider after a 600 s anneal, which is due to the oxidation of the substrate by O2 impurities in N2, as
mentioned earlier. The slight increase in the O and Si areas after RTA probably results from the same process. It should be pointed out that the MEIS technique measures absolute areal density 共i.e., the productt,is the film density, and t is the film thickness兲 for the atomic constituents of a film. Therefore, MEIS cannot determine the film thickness with-out a knowledge 共or assumption兲 of the film density. The MEIS data are unable to resolve the layered structures shown in Figs.1共c兲 and2共b兲, since the ion beam extent in any di-rection 共0.1–1 mm兲 in MEIS experiments is much larger than the composition wavelength observed for these Hf silicate films.
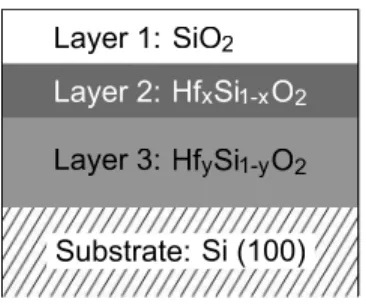
The film compositions 共Table I兲 calculated from the ARXPS peak intensities show that the 5 nm as-grown film has the same Hf concentration at= 45° and 75°. However, Fig. 3共b兲 shows that the Hf 4f peaks of this film shift to higher energy as increases from 45° to 75°, indicating a lower Hf concentration in the film layer closer to the sub-strate. This apparent discrepancy can be explained using a simplified schematic for the Hf concentration gradient across the film depth as shown in Fig.10. Layer 1 is SiO2and Layer
2 共HfxSi1−xO2兲 has a higher Hf concentration than Layer 3
共HfySi1−yO2兲, i.e., x ⬎ y. The average composition of Layers
1 and 2 is the same as the composition of Layer 3. When the XPS measurements are taken at = 45°, most of the signal intensity comes from Layers 1 and 2. Asincreases to 75°, the contribution of photoelectrons excited in Layer 3 in-creases significantly; therefore the Hf 4f peak will shift to higher energy since Layer 3 has a lower Hf concentration than Layer 2. However, the film composition calculated from the XPS peak intensities will not change since Layer 3 has the average composition of Layers 1 and 2. The layered structure shown in Fig. 10 agrees with the HRTEM image shown in Fig.1共a兲.
Using grazing-incidence small angle x-ray scattering 共GISAXS兲, Stemmer et al.17 observed interference peaks in the horizontal cuts of their two-dimensional GISAXS inten-sity distribution, which correspond to a Hf concentration fluctuation in the plane of the film with C-values of 5 nm in
the 4 nm 共HfO2兲x共SiO2兲1−x films 共x = 0.4兲 after 1000 ° C
an-nealing. This observation was confirmed by their plan-view TEM image, which showed interconnected Hf-rich and
Si-rich regions. However, these authors did not try to interpret vertical cuts of their GISAXS data but still concluded that their observations were inconsistent with SDSD. In contrast, the TEM images reported here always show a layered struc-ture for post-annealed films of thickness ⬍8 nm, which is consistent with SDSD.
A crucial observation revealed from the present study is the effect of restricted dimensionality on SD of HfO2– SiO2
systems. In effect, when the region available for phase sepa-ration is a two-dimensional film in the x − y plane with a restricted thickness w in the z direction, the w parameter controls the ensuing structure. This can be understood by looking at the free-energy of the system which consists of species i = 1 , 2 , ¯ with crystal structures i, i, ¯. The free energy consists of a configurational energy E共c1, c2, ¯兲
based on the possible crystal structures c1, c2, ¯ and an
entropy component S共c1, c2, ¯兲. Thus, the total free
en-ergy can be written as
F共c1,c2, ¯兲 = E共c1,c2, ¯兲 − TS共c1,c2, ¯兲,
where T is the temperature. The free energy analysis gives the equilibrium state and becomes strictly valid if the spin-odal structures are the ground state of the system. If such structures result from a kinetic process 共i.e., if they are meta-stable structures兲, the free energies must be replaced by en-ergies corresponding to quasistationary states. However, the present analysis is adequate to understand the observed ef-fects.
In a thick film containing two species 共e.g., SiO2 and
HfO2兲, the energetically favourable total nanostructure is
made up of the bulk crystal structures which we denote by
c1band c2b. Here, if species 1 is HfO2, then c1b共i.e., the bulk
HfO2structure of large grains兲 is the monoclinic structure.
29
If the second material is Si the bulk structure is cubic, while in the case of SiO2 we may take it to be the crystalobite
structure or some modification thereof, as needed for surface films.30We need to consider the situation where both Si at-oms and Hf atat-oms may compete for bonding with O atat-oms. If thin films are formed on a substrate, then we have to deal with possible spinodals based on the bulk structures and the crystal structures manifested by vanishingly thin films. Let us denote the crystal structures found in vanishingly thin films by c1f and c2f. The thinnest HfO2 films tend to form
orthorhombic structures,29 while the structure of very thin SiO2 layers on Si substrates tend to be quasicrystalline or
amorphous modifications of the crystalobite structures.30 When the thickness w of the film is extremely small, e.g., less than a nanometer, bonds involving only a single binary species are possible in the x − y plane but the z direc-tion thickness w would only allow a monolayer or two of a single 共binary兲 species such as HfO2. Our experiments show
the formation of a Hf-rich surface layer whose structure can be interpreted starting from an orthorhombic disposition of the Hf–O bonds but taking account of their termination at the surface. When the thickness w of the deposited layer is in-creased, inner layers face competition, forcing them towards the bulk crystal structure c1b, which in this case is
mono-clinic. A similar competitive process involving the crystal structures of species 2, i.e., SiO2, also occurs. Bonds may
also be formed between the common element 共oxygen兲 with Hf or Si. However, there is not enough volume in a thin film to achieve the full configurational entropy of each species by full phase separation. Thus a compromise is achieved by SDSD. This compromise itself depends on the film thickness, partly because the limiting structures ciband cifare different
in each species. Other factors which may come into play are effects associated with crystal growth kinetics 共i.e., nonequi-librium effects兲. However, such effects are, in our view, un-important in this problem as the effects can be explained via a model which assumes local thermodynamic equilibrium.
The validity of the above picture is evident on a quali-tative basis. A more detailed quantiquali-tative evaluation is not considered here since simulation of SiO2/HfO2structures
us-ing first principles density functional methods30 or tight-binding methods31is beyond the scope of the present study.
IV. CONCLUSIONS
SDSD in Hf silicate films during the film growth and annealing process can be envisioned from the above obser-vations. In the as-grown film, there is always a very thin layer of SiO2共⬃monolayer of SiO2兲 at the film surface.
Be-neath this layer is a Hf-rich layer. When the film thickness is ⬍5 nm, Hf atoms diffuse towards the film surface as the film thickness increases, resulting in a Hf-rich layer closer to the film surface and a Si-rich layer closer to the substrate. As the film thickness increases to values ⬎5 nm, some of the Hf atoms in the Hf-rich layer closer to the film surface dif-fuse towards the substrate. If the thickness is 1.5C, the film
separates into three layers after RTA: a Si-rich layer sand-wiched between two Hf-rich layers. If the film thickness is ⬃2C, the film has a four-layer structure starting from the
substrate surface: Si-rich, Hf-rich, Si-rich, and Hf-rich. As the thickness increases to ⬎2C, the film loses its layered
structure in the center of the film. After a longer time anneal, the layered structure coarsens and the composition wave grows. Crystallization of HfO2was observed in a 12 nm film
after 600 s anneal at 800 ° C and in a 20 nm as-grown film, indicating that nucleation and growth of HfO2 follows SD
during the annealing or film deposition process.
The configurations in as-grown and annealed 共HfO2兲0.25共SiO2兲0.75films are qualitatively in agreement with
the theory of SDSD, i.e., composition waves were observed normal to the film surface. The observation that the compo-sition of the film layer in contact with the substrate can be affected by film thickness has never been predicted by any SDSD simulation. Presumably, theoretical studies of SDSD could be modified to accommodate these experimental re-sults. At this time, it is difficult to study SDSD in 共HfO2兲0.25共SiO2兲0.75films to determine whether the
composi-tion wave obeys the growth law, i.e., C⬃ t1/3, 6
because: 共i兲 TEM is a qualitative technique concerning atomic composi-tion; 共ii兲 SD in oxide systems is not easily controlled since the process occurs during the film deposition process; 共iii兲 an alternative kinetic process, viz., nucleation and growth, can impede SD during the late stages of phase separation; and 共iv兲 any O2 impurity in the annealing N2ambient may also
diffuse through the film and oxidize the substrate. Although
GISAXS is a powerful tool to characterize composition fluc-tuations in thin films,17,32caution has to be taken when using this technique to study SDSD in Hf silicate films since HfO2
crystallizes at a relatively low temperature in thick films, as seen in the 20 nm as-grown film. While SDSD in the 共HfO2兲0.25共SiO2兲0.75 thin films has been confirmed, the
com-position range for which 共HfO2兲x共SiO2兲1−x films experience
SD and the resultant compositions of the phase-separated domains are still open questions.
The present observation of SDSD in 共HfO2兲x共SiO2兲1−x
films may present significant device performance and reli-ability challenges for high- gate dielectric applications of pseudobinary alloy systems such as ZrO2– SiO2,
Y2O3– SiO2, La2O3– SiO2, etc.,
10
and have effects on thin film applications for any two-component system whose phase diagram shows a miscibility gap. The ALD growth mechanism for two-component films could also be influ-enced by SDSD if the film surface is preferentially attracted to one of the two components.
ACKNOWLEDGMENTS
The authors are grateful for the technical assistance of L. Lebrun, G. Parent, and S. Moisa at NRCC and J. Hendriks at UWO. Financial assistance to W.N.L. was provided by NSERC 共Canada兲 共Grant No. RGPIN 9384-2006兲.
1
J. W. Cahn, Trans. Metall. Soc. AIME 242, 166 共1968兲.
2
J. W. Cahn,J. Chem. Phys.42, 93 共1965兲.
3
F. S. Bates and P. Wiltzius,J. Chem. Phys.91, 3258 共1989兲.
4
R. A. L. Jones, L. J. Norton, E. J. Kramer, F. S. Bates, and P. Wiltzius,
Phys. Rev. Lett.66, 1326 共1991兲.
5
F. Bruder and R. Brenn,Phys. Rev. Lett.69, 624 共1992兲.
6
G. Krausch, C.-A. Dai, E. J. Kramer, and F. S. Bates,Phys. Rev. Lett.71,
3669 共1993兲.
7
S. Puri and K. Binder,Phys. Rev. E49, 5359 共1994兲.
8
S. K. Das, S. Puri, J. Horback, and K. Binder,Phys. Rev. E72, 061603
共2005兲.
9
M. Geoghegan and G. Krausch,Prog. Polym. Sci.28, 261 共2003兲.
10
H. Kim and P. C. McIntyre,J. Appl. Phys.92, 5094 共2002兲.
11
P. A. Packan,Science285, 2079 共1999兲.
12
G. D. Wilk, R. M. Wallace, and J. M. Anthony,J. Appl. Phys.89, 5243
共2001兲.
13
J. Robertson,Rep. Prog. Phys.69, 327 共2006兲.
14
G. D. Wilk, R. M. Wallace, and J. M. Anthony,J. Appl. Phys.87, 484
共2000兲.
15
M. A. Quevedo-Lopez, M. R. Visokay, J. J. Chambers, M. J. Bevan, A. LiFatou, L. Colombo, M. J. Kim, B. E. Gnade, and R. M. Wallace,J. Appl. Phys.97, 043508 共2005兲.
16
D. A. Neumayer and E. Cartier,J. Appl. Phys.90, 1801 共2001兲.
17
S. Stemmer, Y. Li, B. Foran, P. S. Lysaght, S. K. Streiffer, P. Fuoss, and S. Seifert,Appl. Phys. Lett.83, 3141 共2003兲.
18
J. Liu, X. Wu, W. N. Lennard, and D. Landheer, Phys. Rev. B 80,
041403共R兲 共2009兲.
19
J. Liu, W. N. Lennard, L. V. Goncharova, D. Landheer, X. Wu, S. A. Rushworth, and A. C. Jones,J. Electrochem. Soc.156, G89 共2009兲.
20
T. Suntola,Mater. Sci. Rep.4, 261 共1989兲.
21
J. Kim, W. N. Lennard, C. P. McNorgan, J. Hendriks, I. V. Mitchell, D. Landheer, and J. Gredley,Curr. Appl. Phys.3, 75 共2003兲.
22
M. D. Ulrich, J. G. Hong, J. E. Rowe, G. Lucovsky, A. S.-Y. Chan, and T. E. Madey,J. Vac. Sci. Technol. B21, 1777 共2003兲.
23
J. Chen, W. J. Yoo, and D. S. H. Chan,J. Electrochem. Soc.153, G483
共2006兲.
24
Z. H. Lu, J. P. McCaffrey, B. Brar, G. D. Wilk, R. M. Wallace, L. C. Feldman, and S. P. Tay,Appl. Phys. Lett.71, 2764 共1997兲.
25
J.-P. Maria, D. Wicaksana, A. I. Kingon, B. Busch, H. Schulte, E. Gar-funkel, and T. Gustafsson,J. Appl. Phys.90, 3476 共2001兲.
26
S. Stemmer, Z. Chen, C. G. Levi, P. S. Lysaght, B. Foran, J. A. Gisby, and 123510-8 Liu et al. J. Appl. Phys. 107, 123510 共2010兲
J. R. Taylor,Jpn. J. Appl. Phys., Part 142, 3593 共2003兲.
27
G. Pant, A. Gnade, M. J. Kim, R. M. Wallace, B. E. Gnade, M. A. Quevedo-Lopez, and P. D. Kirsch,Appl. Phys. Lett.88, 032901 共2006兲.
28
P. S. Lysaght, J. C. Woicik, M. Alper Sahiner, B.-H. Lee, and R. Jammy,
J. Non-Cryst. Solids354, 399 共2008兲.
29
M. C. Cheynet, S. Pokrant, F. D. Tichelaar, and J.-L. Rouvière,J. Appl.
Phys.101, 054101 共2007兲.
30
P. Carrier, L. J. Lewis, and M. W. C. Dharma-Wardana,Phys. Rev. B65,
165339 共2002兲.
31
N. Tit and M. W. C. Dharma-Wardana,J. Appl. Phys.86, 387 共1999兲.
32
J. R. Levine, J. B. Cohen, Y. W. Chung, and P. Georgopoulos,J. Appl. Crystallogr.22, 528 共1989兲.