Coherence in Nanostructured Excitons
by
Dylan H. Arias
B.S. Chemistry, University of California, Berkeley 2007
Submitted to the Department of Chemistry
in partial fulfillment of the requirements for the degree of
Doctor of Philosophy
at the
MASSACHUSETTS INSTITUTE OF TECHNOLOGY
MASSACHUSETTS INST E OF TECHNOLOGY
JUL 0 1 2013
LIBRARIES
June 2013
@
Massachusetts Institute of Technology 2013. All rights reserved.
A u th o r ...
. .T ...
...
Department of Chemistry
May 7, 2013
Certified by...
..
Keith A. Nelson
Professor of Chemistry
Thesis Supervisor
/n AAccepted by. ...
Robert W. Field
Chairman, Department Committee on Graduate Theses
This doctoral thesis has been examined by a Committee of the
Department of Chemistry as follows:
Professor Robert G. Griffin ...
:
.
Cha' rson
Professor K eith A . N elson...
Thesis Supervisor
Professor Moungi G. Bawendi...
VCoherence in Nanostructured Excitons
by
Dylan H. Arias
Submitted to the Department of Chemistry on May 7, 2013, in partial fulfillment of the
requirements for the degree of Doctor of Philosophy
Abstract
Nanotechnology and optoelectronics have the potential to revolutionize the medicine, communications, and energy industries, with applications utilizing nanotechnology beginning to appear. However, there are still fundamental questions about optoelec-tronic devices incorporating nanotechnology. In particular, how do nanometer-scale materials affect potential functionality, and how can we take advantage of this scale to design nanomaterials for applications?
Natural light harvesting systems in bacteria and plants provide exquisite exam-ples of nanomaterial design, featuring remarkably efficient light harvesting antennas. Sunlight absorption first creates excitons. Complex antenna architectures control the excitons, directing them to reaction centers for conversion to chemical energy. Recently, studies found that excitonic interactions play a significant role in control-ling antennas' light harvesting abilities, and that coherence may greatly affect energy transport efficiencies. While these studies have propelled our understanding of exci-tons in these systems, it is desirable to extend our expertise to artificial systems. In this thesis I describe experiments uncovering many fundamental properties of excitons in various nanostructured materials, relating physical structure to excitonic structure and perhaps to subsequent function in an excitonic device.
Nonlinear spectroscopy offers distinct possibilities for detailed exploration of ex-citonic properties and processes in nanomaterials. Transient grating experiments are sensitive to population dynamics and energy transport, while multi-dimensional spectroscopy clearly reveals excitonic interactions, correlations, and coherence. In this thesis, these techniques are performed with a unique multi-dimensional spectrometer using femtosecond pulse shaping.
I present results on two classes of artificial nanostructures: supramolecular
J-aggregates and semiconductor quantum wells. In J-aggregate thin films I determined that coherence is controlled by thermal dephasing rather than film inhomogeneities, even at cryogenic temperatures. Tubular J-aggregates in solution undergo morpho-logical rearrangement while maintaining a common sub-unit that remains relatively intact both structurally and excitonically. In semiconductor quantum wells, many-body correlations among excitons were shown to decay on the timescale picoseconds,
depending on the exciton density and therefore revealing of high-order correlations. These insights into coherence and excitonic structure are important in determining the origin and strength of coherence in excitonic systems, potentially leading toward methods to alter or control exciton dynamics and toward possible novel application of coherence in optoelectronic devices.
Thesis Supervisor: Keith A. Nelson Title: Professor of Chemistry
Acknowledgments
This thesis is the culmination of a dream, lived and breathed every day alongside my wife.
Learning, inquiry, and people are the foundation for this dream. It began in second grade when my teacher, Mrs. Youngs, had us discuss what we thought "science" was, what is a hypothesis, what does it mean to "test" a hypothesis. We put our ideas into practice with memorable experiments involving two rats that lived in a cage in the classroom. We would give them a series of challenges and see how completed them. I serendipitously found myself in Mrs. Youngs class again in fourth grade and our explorations into the scientific method continued. However, this time we came up with our own hypotheses and tests. I enjoyed the field of optics, although I didn't know it as such at the time, and chose to figure out how optical illusions work. I created a series of illusions, based on those I found in books from the library, and asked people what they saw when looking at the different illusions, and why they thought the illusions worked or didn't work.
This enjoyment of inquiry-based exploration did not develop significantly further until I attended high school, when I began taking chemistry, physics, and calculus. Mr. Dempsey, my calculus teacher who by coincidence graduated from MIT, stands out as prominently altering my world view with mathematics. In addition, he amaz-ingly gave a book to each and every student tailored to their own curiosity; my book was "Four Great Ideas in Physics" and covered quantum mechanics, energy conser-vation, the second law of thermodynamics, and relativity. This singular action had a profound effect upon me: I wanted to be a scientist.
The dream continued into college, where I studied chemistry at UC Berkeley. My first graduate student instructor, Delphine Farmer, and my first chemistry professor, Ron Cohen, introduced me to the world of studying chemistry and physics for the benefit of people, to figure out solutions to immense problems. My phsyics professor Dunghai Lee led me through the mathematical complexity that is quantum mechanics. At this point, I knew I wanted to use quantum mechanics to study problems that
affect many people, specifically focusing on energy and the environment.
I entered graduate school with the plan of using spectroscopy to study quantum
mechanical systems. I am grateful to my ever-energetic advisor with boundless en-thusiasm, Keith Nelson. He gave me the platform for launching into projects that I desired, and the freedom to pursue them with all the gusto I could muster. Kathy Stone, Duffy Turner, and Kenan Gundogdu were the initial people working in my sub-group, who taught me everything practical in terms of being a scientist: how do to do science in the lab every day, how to think like a scientist every day.
Patrick Wen joined the Nelson group the same time I did, and we have had such an adventure that he deserves his own paragraph.
The people that fill my everyday life make working in science possible. Steph, forever to my left with a glare and smile; OGW, ever ready for a furious round of insults; Colby, my eager, incredibly thoughtful, and spectacularly capable greenhorn; Sharly, with his constant threatening and posturing; Kit, an endless source of rules and workplace-appropriate humor; Kara, the enthusiastic bike-ready explorer; Jeff, our 6'-8" champion of champions; and Harold, the whiskey-loving fountain of great ideas.
The entirety of the Nelson group, both past and present (including Raoul), made graduate school a thoroughly transformative and amazing experience, both profes-sionally and personally, and I can't thank them enough.
I must acknowledge all my wonderful collaborators as well, it could not have
and would not have happened without you. Yaakov Tischler, Gleb Akselrod and Vladimir from the Bulovid group, Joel and Alan from the Aspuru-Guzik group, and D6rthe Eisele and Moungi from the Bawendi group. D6rthe in particular, your joyful, enthusiastic outlook is inspiring and unquenchable.
My parents started the dream. To my mom, who gave me the drive and desire to
accomplish. To my dad, who gave me the humor and happiness to survive. To you both, who gave me the resilience, ability, and well-being to become who I am.
Elizabeth Louise Lemon, while we may not be driving around in a van solving mysteries, every day I dream a little dream of you.
Contents
1 Introduction 2 Spectroscopy
2.1 The Semi-Classical Description of Spectroscopy 2.1.1 Macroscopic Polarization . . . . 2.1.2 Light-Matter Interaction . . . . 2.2 Linear Spectroscopy . . . .
2.2.1 Response Function Formalism . . . .
2.3 Coherence and Dephasing . . . .
2.4 Nonlinear Spectroscopy . . . . 2.4.1 Diagrammatic Perturbation Theory . . . .
2.4.2 Phase-Matching . . . .
2.5 Nonlinear Techniques . . . . 2.5.1 Pump-Probe and Transient Grating . . . . 2.5.2 Photon Echo Spectroscopy . . . .
2.5.3 Two-Quantum Spectroscopy . . . . 2.5.4 Multi-Dimensional Spectroscopy . . . .
2.6 Detection Methodology for Nonlinear Experiments
2.6.1 2.6.2
Heterodyne Detection and Spectral Interfer Rotating Frame Detection . . . .
19 23 23 . . . . 24 . . . . 2 5 . . . . 2 7 . . . . 27 . . . . 29 . . . . 3 2 . . . . 33 . . . . 35 . . . . 35 . . . . 35 . . . . 38 . . . . 3 9 . . . . 39 . . . . 43 ometry . . . . 44 . . . . 46 3 Experimental Setup
3.1 Ultrafast laser system . . . .
47
3.2 Noncollinear Optical Parametric Amplifier . . . . 47
3.3 Pulse Shaping . . . . 49
3.3.1 Beam Pattern Generation . . . . 49
3.3.2 Temporal Pulse Shaping . . . . 50
3.3.3 Wavevector Shaping . . . . 52
3.3.4 Diffraction-Based Pulse Shaping . . . . 52
3.4 Pulse Shaping Calibrations . . . . 54
3.4.1 Phase to Grayscale . . . . 55
3.4.2 Pixel to Wavelength . . . . 56
3.4.3 Temporal Distortions . . . . 56
3.4.4 Carrier Frequency . . . . 57
3.5 Transient Grating Spectroscopy . . . . 58
4 J-Aggregates 61 4.1 Linear J-aggregate Model . . . . 62
4.1.1 Frenkel Exciton Hamiltonian . . . . 62
4.1.2 Idealized Many-Site Model . . . . 63
4.2 Disordered Aggregate Model . . . . 66
4.2.1 Static Disorder . . . . 67
4.2.2 Exciton-Phonon Interactions . . . . 70
4.3 Two-Exciton States . . . . 74
4.4 Tubular J-aggregates . . . . 75
5 Exciton Delocalization in Superradiant Molecular 5.1 Motivation and Background . . . . 5.2 Nonlinear Spectroscopy Applied to J-aggregates . . 5.3 Experimental Details . . . . 5.4 Theoretical Description . . . . 5.4.1 Excitons in One Dimension . . . . 5.4.2 Excitons in Two Dimensions . . . . 5.5 Exciton Coherence Lengths and Dephasing . . . . . Aggregate Films 81 . . . . 81 . . . . 83 . . . . 85 . . . . 87 . . . . 87 . . . . 90 . . . . 91
5.6 Conclusions . . . .
6 Morphology and Excitonics in Supramolecular 6.1 Introduction . . . . 6.2 Electron Microscopy and Linear Spectroscopy . 6.2.1 TEM of Supramolecular Nanotubes . . .
6.2.2 Polarized Linear Spectroscopy . . . .
6.3 2D Spectroscopy of Nanotubes . . . .
6.4 Microscopic Model for Isolated Inner Wall . . .
6.5 Conclusions . . . .
Nanotubes
7 Quantum Process Tomography of Supramolecular Excitons 7.1 Quantum Process Tomography Methodology . . . .
7.1.1 Basic M ethod . . . .
7.1.2 Example V-Level Excitonic System . . . .
7.2 QPT of Nanotubular Excitons . . . . 7.2.1 Experimental Parameters . . . . 7.2.2 Transient Grating Results . . . .
7.2.3 QPT Results . . . . 7.3 Conclusions . . . .
8 Many-Body Effects in Quantum Wells 8.1 Semiconductor Quantum Wells ...
8.2 Experimental Details ...
8.3 2D Spectra and Analysis . . . .. 8.3.1 2D Correlation Spectra . . . .. 8.3.2 Lineshape Analysis . . . . 8.4 Excitonic Many-Body Interactions . . .
8.5 Conclusions . . . .
9 Conclusions and Outlook
96 99 . . . . 100 . . . . 102 . . . . 102 . . . . 103 . . . . 106 . . . . 113 . . . . 115 117 . . . . 118 . . . . 118 . . . . 122 . . . . 130 . . . . 130 . . . . 130 . . . . 134 . . . . 138 139 140 142 143 143 145 147 149 151
List of Figures
2-1 Absorption of a Two-Level System 2-2 Interference of Sinusoids . . . . .
2-3 Feynman Diagrams . . . . 2-4 Phase-Matching Conditions . . . 2-5 Time-Domain Photon Echo . . . 2-6 Two-Dimensional Photon Echo
2-7 Correlation Spectrum . . . . 2-8 Three-Level System . . . . 3-1 3-2 3-3 3-4 3-5 4-1 4-2 4-3 4-4 4-5 4-6 4-7 4-8 4-9
NOPA Optical Design . . . .
Pulse Shaping Optical Design . . .
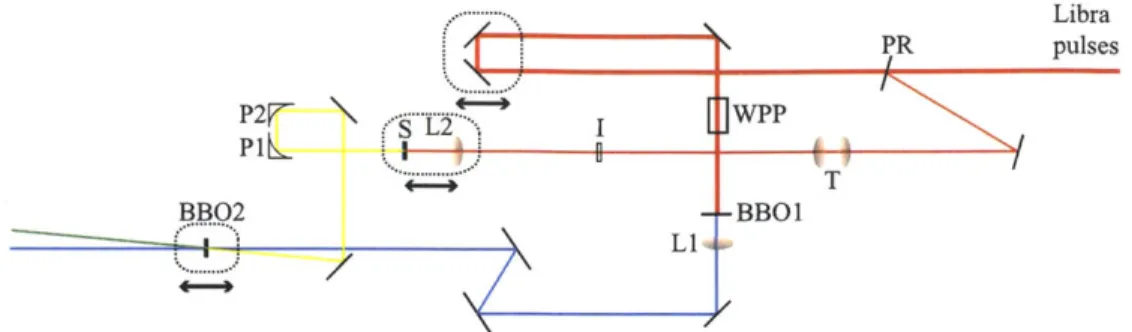
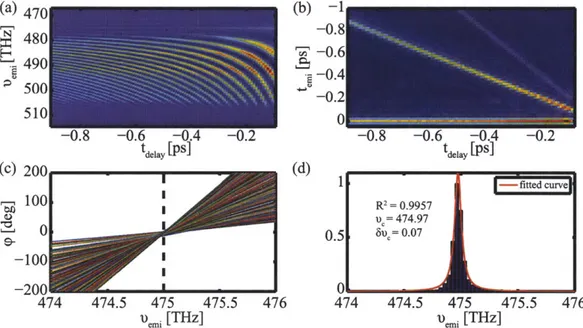
Multi-Dimensional Spectrometer . . Carrier Frequency Calibration . . .
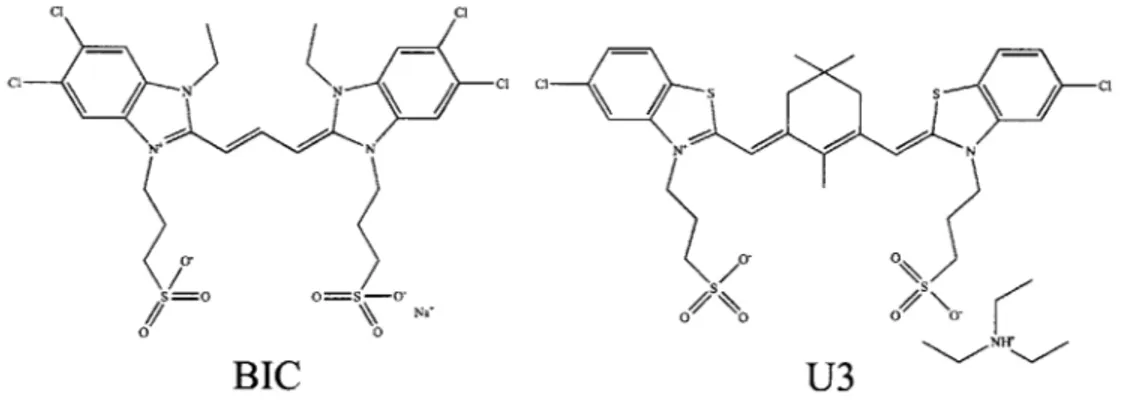
Transient Grating Setup . . . . BIC and U3 Cyanine Dye Molecular Dimeric Energetics and Dipoles . . Many-Site Aggregate . . . . Homogeneous Aggregate Properties
Structure
Homogeneous Aggregate Absorption Spectrum Disordered Aggregate Properties . . . . Disordered Aggregate Absorption Spectrum .
Aggregate Absorption Spectrum . . . .
C8S3 Cyanine Dye Nanotubes . . . .
. . . . 2 8 30 34 36 40 41 42 43 48 50 55 57 58 61 63 63 65 66 68 69 74 76
.. .. . .. . .. .
.. .. . .. .. . .
.
.
. . . .
. . . .
4-10 C8S3 Dye and Nanotube Optical Spectra . . . 4-11 Nanotube Geometrical Model . . . .
. . . . 77
. . . . 79
Exciton Delocalization Experiment . . . . . Thin Film J-aggregate Correlation Spectra Temperature-Dependent Coherence Length Thin Film J-aggregate Photon Echoes . . . Temperature-Dependent Exciton Dephasing Dephasing-Controlled Exciton Delocalization 84 92 94 95 95 96 Nanotubular J-aggregate System . . . . 101
Nanotube Morphology . . . . 104
Nanotube Linear Dichroism . . . . 105
2D ES Polarization Schemes . . . . 107
HHHH Feynman Diagrams . . . . 108
HHVV Feynman Diagrams . . . . 109
Bundled 2D ES HHVV Feynman Diagrams . . . . 110
Nanotubular 2D ES . . . 111
Optical Spectroscopy of Clusters and Isolated Nanotubes . . . . 113
Optical Spectrum and Model of Single-wall Nanotube . . . . 114
Nanotubular Morphological Change . . . . 115
QPT and Feynman Diagrams . . . . 121
V-Level Excitonic System and QPT Experiment . . . . 122
QPT Feynman Diagrams . . . . 124
QPT Transfer Feynman Diagrams . . . . 125
Linear Absorption and Pulses for QPT . . . . 131
Nonlinear Spectroscopy QPT . . . . 132
Nonlinear experiment IO . . . . 133
Process Matrix Elements . . . . 135
Calculated Nanotube Populations . . . . 136 5-1 5-2 5-3 5-4 5-5 5-6 6-1 6-2 6-3 6-4 6-5 6-6 6-7 6-8 6-9 6-10 6-11 7-1 7-2 7-3 7-4 7-5 7-6 7-7 7-8 7-9
8-1 Quantum Well Experiment ... 142
8-2 Quantum Well Correlation Spectra . . . . 144
8-3 Many-Body Interaction Time Dependence . . . . 146
8-4 Excitonic Scattering . . . . 148
A-1 QPT Population Feynman Diagrams . . . . 156
List of Tables
Chapter 1
Introduction
Nanotechnology and optoelectronic devices have revolutionized the world of commu-nications and hold great promise for the development of energy and medical tech-nologies from photovoltaic cells to optical computing and biomedical imaging [1, 2].
The full potential of these technologies can only be realized if we understand both the optical and electronic components. Excitons are the fundamental unit of electronic excitation in many of the nanomaterial systems, typically created via absorption of a photon [3, 4]. Therefore, the study of excitons is vitally important to understanding, controlling, and designing optoelectronic device functionality for novel applications.
Control of nanoscale structure and morphology grants unprecedented control of ex-citonic properties in both organic and inorganic systems [5, 6]. Exciton wavefunctions, dynamics, and interactions can be engineered using quantum confinement effects, di-mensionality, and geometry [7, 8, 9]. Exciton-exciton interactions and correlations
lead to effects such as coherence, supertransfer, and enhanced nonlinearities; while exciton interactions with the environment are important for energy and coherence dissipation [5, 101. Of particular interest are natural light harvesting antenna com-plexes, optimized through billions of years of evolution to take advantage of nanoscale effects for highly efficient and highly robust light harvesting and energy conversion in plants and bacteria [11, 12, 13, 14]. An artificial photosynthetic system with the ability to efficiently capture sunlight and cheaply convert it into usable electrical en-ergy or storable fuels would cause a significant transformation of the field of enen-ergy
technology with wide ranging implications for society as a whole.
A complete understanding of natural photosynthesis would immensely benefit our
efforts toward an artificial system [15, 13, 14]. However, this understanding remains elusive due to the complexity and scale of the complete photosynthetic cycle, which covers many orders of magnitude in both size and duration [12, 16]. On the shortest length scales (nanometers) and time scales (femtoseconds), on which the initial steps in photosynthesis occur, individual chromophore molecules are arranged into absorb-ing antenna complexes with a few to a few hundred thousand molecules per antenna
[17, 18]. The interactions among the chromophores and their interactions with the
surrounding environment determine the optical properties, e.g. the absorption spec-trum, and exciton dynamics. Typically the antennas are treated as excitonic systems weakly coupled to the environment. There are several examples of light harvesting antenna complexes with a determined structure, allowing optical spectroscopy exper-iments to probe the excitonic band structure and dynamics in a meaningful way and provide insight on the exciton-environment interactions that determine the efficien-cies of the complexes [17, 19, 20, 21, 22]. For example, the Fenna-Matthews-Olson complex has been studied as a model antenna complex that acts as a quantum wire that may utilize excitonic coherence to quickly transport energy to a reaction center
[23, 20].
In the last few decades nonlinear optical spectroscopy has emerged as the technique of choice for studying exciton properties and dynamics [24, 25, 26, 27, 28, 29, 19, 30,
31]. Pump-probe, transient grating, and photon echo spectroscopy began to reveal the
relationship between excitons and the environment, the types of solvent modes inter-acting with the excitons, and the strength of those interactions [25, 26, 32, 33]. Coher-ent spectroscopy, notably multi-dimensional photon echo spectroscopy and multiple-quantum spectroscopy, has led efforts to disentangle coherence and correlations among excitons from population effects as well as the role they may play in guiding transport and enhancing energy transfer efficiency [20, 34, 21, 35, 31, 22].
The insights gained from these advanced characterization techniques have greatly benefited efforts to construct artificial light harvesting complexes and other
optoelec-tronic structures using advanced materials and geometrical architectures [36, 7, 37,
13, 14]. Supramolecular J-aggregates, initially discovered in the 1930s [38, 39, 40],
self-assemble from different types of chromophore dye molecules and resemble some natural light harvesting systems [41, 40, 42]. New morphologies continue to be de-veloped including tubular structures [43, 44, 45, 46, 47, 48], oriented and mono-layer thin films [49, 50, 51, 52], and aggregates electrostatically linked to quan-tum dots and semiconductor nanowires [53, 54, 55, 56]. Nonlinear optical tech-niques including transient grating, photon echo, and multi-dimensional spectroscopy have been applied to various J-aggregate morphologies to study the exciton dynam-ics and interactions and have elucidated the nature of coherence in these systems
[57, 58, 59, 60, 61, 62, 63, 64, 65, 66, 67, 68, 69, 70]. This insight has benefited their
use in potential applications such as polariton lasers and ultrafast optical switches
[71, 72, 73, 74, 75].
Excitons in inorganic semiconductors, termed Wannier excitons, provide a con-trasting set of physical properties for developing excitonic devices [6]. Weak dielectric screening and the support for high carrier concentrations lead to possibilities for sev-eral applications [5]. In addition, semiconductor architectures typically do not suffer from the drawbacks of structural and morphological inhomogeneity and are much more photostable, although they may be more expensive and energy intensive to produce. Still, they have found widespread use in e.g. photovoltaics, communica-tions, and computing. Nonlinear spectroscopy techniques have also been applied to semiconductors to explore exciton dynamics and correlations [76, 77, 6, 78]. Those studies yield different yet complementary insight to the nature of excitonic coherence and interactions in nanostructured materials.
This thesis is organized in the following fashion. First I introduce linear and non-linear spectroscopy in Chapter 2. Then I develop the background and methodology of our experimental apparatus, beginning with the Coherent Libra amplifier laser system and ending with a description of the multi-dimensional spectrometer and the transient grating setup. Next I give a brief overview of J-aggregates with descrip-tions of delocalized Frenkel excitons and their properties. In Chapter 5 I present
the temperature-dependence of exciton delocalization in thin films of J-aggregates. Chapter 6 continues with J-aggregates of the tubular variety. Exciton interactions and coherence in these self-assembled supramolecular nanotubes are determined via multi-dimensional spectroscopy, and the correlation between excitonic changes and morphological rearrangement is determined with a combination of electron microscopy and linear and nonlinear spectroscopy. Results on quantum process tomography are presented in the next chapter as examples of a new methodology for interpreting non-linear spectroscopy experiments. In Chapter 8 I discuss a different class of excitons, in Gallium Arsenide semiconductor quantum wells, determining the time-dependence of many-body effects using multi-dimensional spectroscopy. Finally, I conclude with a brief reflection on the work that comprises this thesis as well as future directions for these projects and others.
Chapter 2
Spectroscopy
Spectroscopy is the science of understanding matter using light. It ranges across the electromagnetic spectrum from radio waves to gamma rays including many tech-niques from time-resolved microwave conductivity to Raman spectroscopy to X-ray diffraction. The experiments described in this thesis aim to understand how electrons behave when excited. The techniques used fall into the general category of resonant electronic spectroscopy which I describe in the following chapter.
I begin by describing the interaction between light and matter using a semi-classical approach. I then introduce the methodology used to understand both linear and nonlinear spectroscopy and how different physical phenomena manifest in an op-tical spectrum. Next, I go through several nonlinear spectroscopy techniques used to separate and quantify those phenomena. Finally, I describe multi-dimensional elec-tronic spectroscopy and the technical challenges associated with performing multi-dimensional spectroscopy experiments. For an excellent in-depth tutorial on most of the topics covered in this chapter see Andrei Tokmakoff's Nonlinear Spectroscopy notes [79].
2.1
The Semi-Classical Description of Spectroscopy
In classical electricity and magnetism, electromagnetic waves (light) pass through and interact with matter according to Maxwell's Equations [80, 811. The light waves
generate a macroscopic polarization that depends only on the average (ensemble) properties of the material without requiring a detailed description of the microscopic basis for the ensemble properties. The semi-classical approach attempts to bridge the macro- and microscopic worlds by treating the material on a microscopic, perturbative and fully quantum mechanical level; while leaving the light waves as classical fields essentially unchanged by the quantum system [82, 25].
2.1.1
Macroscopic Polarization
I start with the classical description of the macroscopic response of the system to an
incident light wave, the polarization [80]. The simplest case is when the polarization P is linearly proportional to the incident light field E,
P (k, W) = X(W)$ E k, w). (2.1)
As indicated in Equation 2.1 the polarization and linear susceptibility are functions of light frequency w and direction (wavevector k). In Maxwell's Equations, P acts as a source term for the output light wave
Sout,
leading to a dependence ofSost
on P,Zout
(, w) = Z27rwl P(k,
w) sinc Ak ei/2, (2.2) where 1 is the system length, n is the index of refraction, c the speed of light, and Ak the directional (wavevector) mismatch. For large wavevector mismatch, Eout vanishes. To first order this requires the output electric field to travel in the same direction as the input electric field for the linear macroscopic response.In general the polarization is not linearly proportional to the electric field and contains both linear and nonlinear components,
This thesis utilizes two of the nonlinear terms: X(2
gen-eration and parametric scattering) are used in the NOPA as described in Section 3.2 while the experiments themselves are derived from X(3
) processes. We can explore the
x(3) processes in further detail, approximating the electric fields as envelopes a, (t)
times carrier waves, En
(,
w) = an(t)e kn -wnt)+c.c., and expanding the third-order term,P(3)
_ (3)(w) X aia2aei(+k2+k3)±r-i(w1+w2+w3)t +a~a2asei(-k+2+3)r-i--wi+w2+w3)t +
aia*a3 eC (k-k 2+k3). r-i(wi-w2+w3)t +
aia2a*ei(k1+k2-k3).riwi+w2-w3)t + c.c. (2.4)
From Equation 2.4 it is clear that several signals are generated during the nonlinear process. According to the phase-matching condition Ak = 0 from Equation 2.2, the
signals propagate in well-defined directions allowing for spatial selection of the signal of interest.
2.1.2
Light-Matter Interaction
In the semi-classical approach the material of interest and the light-matter interaction are quantum mechanical [79, 25]. The Hamiltonian takes the form
H(t) = Ho + V(t) = Ho - 1. $(t), (2.5)
where HO is the material Hamiltonian and V(t) =
-E
- $(t) is the light-matter interaction potential consisting of the dipole operatorf
dotted with the electric field. Using the density matrix p(t) = 1*) (0 | as opposed to wavefunctions 1$) [83] simplifies the derivation and manipulation of the equations for nonlinear spectroscopy. The Schr6dinger equation becomes the Liouville-Von Neumann equation for the time-dependence of the density matrix,S
Z[H,p].
(2.6)at h
The interaction picture removes the dependence on the material Hamiltonian Ho and isolates the light-matter interaction. In the interaction picture, p, = UfpUo and V1(t) = UtV(t)Uo with the time propagator Uo = exp+(~-
f
Ho(t') dt'). TheLiouville-Von Neumann equation becomes
- [V(t ), pi]. (2.7)
Equation 2.7 can be integrated to obtain
p1(t) = pi(to) - - J[V(t'), p,(t')] dt'. (2.8)
tto
Substituting this equation into itself gives a perturbation expansion series, of which the first- and third-order terms most relevant to the spectroscopy in this thesis are
p)(t) =- [V(t1),iPeq]dt1. (2.9)
3 PI
8
tP1 (t) = (h dts _ dt2 _0dt1 [V(ts, [V(t2), [V(t1), peq] ]] . (2.10)
The macroscopic polarization is obtained directly from the density matrix and dipole operator, P(t) = Tr (p(t)p1(t)), and each perturbative term in p, leads to a
corresponding term in the series expansion of the polarization in Equation 2.3,
P - p(l) + p(2) + p(3) + ... = Tr(p1p + Tr(jp +Tr(p1p?3 )+... (2.11)
In the next several sections I describe the results for the first-order and third-order polarizations and how we use them to interpret various linear and nonlinear opti-cal spectroscopy experiments. In addition, I show how physiopti-cal phenomena such as
dephasing dynamics and absorption and dispersion manifest in experiments.
2.2
Linear Spectroscopy
Materials that have a dipole-allowed transition from the ground state to an excited state will enact frequency-dependent changes upon an input light wave. Linear changes in the phase (dispersion) and amplitude (absorption) of the light map to the real and imaginary parts, respectively, of the index of refraction and are directly related to the linear susceptibility (Equation 2.1). With some manipulations we can re-write the polarization in terms of the input electric field and a response function which we can use to find the linear susceptibility. The linear polarization is deter-mined by the light-matter interaction potential and the density matrix,
PM (t) = - Tr (I [V(t1), Peq]) dt1. (2.12)
Rearranging Equation 2.12 and using V1(t) = -pj - E(t) leads to
P(1)(t) = 00 E(t - r)Tr ([p1(rT), pI(O)]peq) dT. (2.13)
Equation 2.13 resembles linear response theory, where an output response, P(') (t), lin-early depends on the input driving force, E(t - T), with the response function R (t) the proportionality constant. From Equation 2.13, R(')(t) = Tr ([p1(r), pI(O)]Peq). Comparing Equations 2.13 and 2.1 it is clear that RM(t) and xM(W) are related by a Fourier transform. Thus, by finding the response of the system using the dipole operator and the density matrix we can simply do a Fourier transform to find the frequency-dependent dispersion and absorption spectrum, related to the real and imaginary parts of X((w), respectively.
2.2.1
Response Function Formalism
In this section I use a simple example, a two-level system, to demonstrate how the response function R)(t) translates to absorption and dispersion spectra. The
two-(a)
e) (b)
pol)(t) (c) real X (O)imag
time - "eg freq
Figure 2-1: Linear absorption example. (a) Two-level system. (b) Time domain polarization. (c) Frequency domain susceptibility, with real (blue) and imaginary (green) components.
level system has a ground state, 1g), and an excited state, le), accessible by light absorption (Figure 2-1(a)). RC'(t) for this system is calculated using the two-level Hamiltonian HO, time propagator Uo, and the transition dipole moment P which connects |g) and
le),
Ho =
Egjg)(g|
+cele)(el,
Uo = exp(iHot/h),
p(t) = Ut y UO, P = pge1g)(el + pegIe)(gL (2.14)
Combining the equation for R('(t) and Equation 2.14 leads to
R()(t) = |peg|2 sin(wegt) (2.15)
with w eg=
(l
).
Furthermore, using a 6-pulse, adding a phenomenological damp-ing parameter (discussed further in Section 2.3), and combindamp-ing Equation 2.15 with Equation 2.13 leads to,P(1)(t) oc R(1)(t)
= |peg|2 sin(wegt)ee t. (2.16)
This result is plotted in Figure 2-1(b). The Fourier transform of the damped oscil-lating signal has both real and imaginary parts, corresponding to the dispersive and
absorptive responses, respectively (Figure 2-1(c)). The absorptive part is peaked at the energy difference, Weg, reflecting the resonant nature of the interaction with light.
2.3
Coherence and Dephasing
There are multiple ways to interpret the oscillating polarization in Figure 2-1(b). In the classical and possibly more intuitive picture, the polarization results from spatially-dependent oscillations in the system of interest. In the case of molecules it is easy to picture bonds vibrating or twisting giving rise to infrared radiation and vibrational spectroscopy; or electron clouds oscillating across the relatively fixed backbone of nuclei leading to electronic spectroscopy. The process of absorption occurs when an oscillating electric field polarizes the charge density of the system. The charge density (or polarization) oscillates at the resonant frequency and emits an oscillating electric field exactly out of phase with the incoming electric field, causing destructive interference and therefore net absorption.
Quantum mechanics offers a similar picture but with perhaps less intuitive lan-guage. When calculating the polarization, the density matrix and transition dipole operator act in conjunction. The elements of the density matrix simply describe the wavefunction of the system: diagonal terms relate to the population in different eigenstates whereas off-diagonal terms relate to coherences, i.e. superpositions, among eigenstates. The light-matter interaction requires the density matrix to contain off-diagonal amplitude in order to create a polarization, meaning that a superposition of eigenfunctions must exist in the system, that the system exists in a coherence. The coherent superposition state is responsible for driving the polarization and eventually emitting photons.
Creating a coherence is different than changing the population in the system eigenstates (diagonal density matrix elements). Whereas creating a coherence requires a single electric field interaction, transferring population between eigenstates requires two electric field interactions because both the bra and ket of the density matrix (p = 10)(,01 must change from the initial to final state, whereas a coherence only
S(t) S(t) S(t)
time -> time -* time
S(o) ((co)
oo freq-. co freq-+ o freq-+
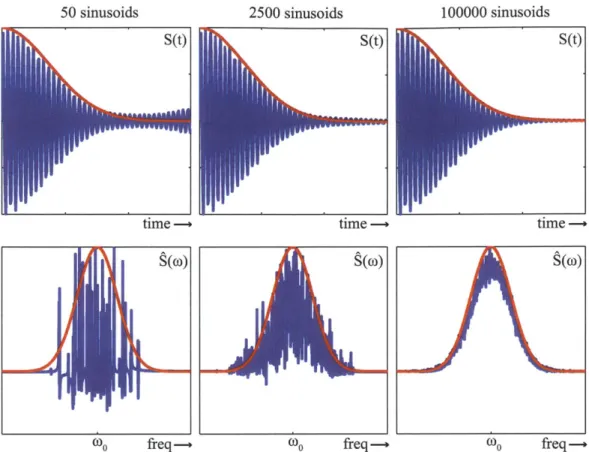
Figure 2-2: Addition of undamped sinusoidal functions with the frequencies taken from a gaussian distribution, demonstrating inhomogeneous dephasing. Going from left to right there are an increasing number of time-domain sinusoids added together, increasing the destructive interference at longer times. Top panels show the resulting time domain signal S(t), bottom panels show the Fourier transform of the time domain signal,S(w). In red are the analytical gaussian functions.
requires one to change.
The connection between the classical description and quantum mechanical coher-ence is the fact that eigenstates are stationary states with a static wavefunction. In quantum mechanics any motion, spatial or otherwise, is a direct result of coherence among multiple eigenstates. For example, a vibrating bond may be composed of several eigenstates whose superposition leads to an oscillating nuclear wavefunction. Similarly, an electron cloud oscillating across a molecule is composed of a coherence among electronic eigenstates that leads to an oscillating electronic wavefunction.
There are two main classes of damping (or decoherence) that reduce the coherence, 100000 sinusoids
and therefore the polarization, after creation. The first is irreversible and ubiquitous, termed homogeneous dephasing or dynamic dephasing. The system, whether it be vibrations, excitons, electrons, etc., is always coupled to a fluctuating environment and always exhibits homogeneous dephasing. This disorder causes fluctuations in the system, e.g. nuclear positions, atomic/molecular energies, which cause random and time-dependent phase changes in the wavefunctions and therefore in the coherences. This manifests in spectroscopy as exponential damping of coherent oscillations (see Figure 2-1(b)).
Inhomogeneous dephasing is the second class of dephasing. If there is a separation of fluctuation timescales, then the fast fluctuations lead to homogeneous dephasing and the slow fluctuations lead to inhomogeneous dephasing. The slow fluctuations appear as static disorder, such as the different configurations of a protein affecting vibrational frequencies or variability in the sizes of semiconductor nanocrystal quan-tum dots leading to a distribution of exciton energies. For systems exhibiting small homogeneous dephasing the polarizations and coherences can still decay very quickly because oscillations with a distribution of frequencies interfere destructively to re-duce the signal. The signals in Figure 2-2, composed by the addition of sine waves of varying frequencies, demonstrate this effect . The frequencies are taken from a gaussian distribution, simulating a random distribution of frequencies. Even for 50 sine waves (left panels) the coherence damps fairly quickly, however a clear temporal revival occurs at the edge of the panel. The Fourier transform (bottom left panel) shows the different frequencies of the sine waves. For 2500 sine waves (middle pan-els), the revival is greatly reduced and the Fourier transform resembles the original gaussian distribution. The time domain and frequency domain signals from 100, 000 sine waves (right panels) follow the analytical gaussian distribution very closely.
There are many different models to include both homogeneous and inhomogeneous dephasing. Many of the models culminate in a description of the lineshape function, g(t); for the two-level model above g(t) = --yet. In general, the lineshape function
P(1) (t) oc |peg 2 sin(wegt)e-g(t). (2.17
For systems that exhibit the effects of homogeneous and inhomogeneous dephasing simultaneously the linear polarization and linear spectroscopy in general is insuffi-cient to separate the magnitudes of either or to determine the mechanism. The next sections describe nonlinear spectroscopy techniques specifically designed to examine directly homogeneous versus inhomogeneous dephasing, energy transfer dynamics, and coherence and correlations in general.
2.4
Nonlinear Spectroscopy
Nonlinear spectroscopy is the study of light-matter interactions when the system response and polarization depend on many electric field interactions. In this section I extend the analysis from Section 2.1.2 to the nonlinear polarization, specifically P(3
), using Equations 2.10 and 2.11. p(3) is obtained using similar substitutions as for the
linear polarization, leading to
P(3)(t) =
j
dr3 d72j
dr1R( (T3, -2, T1)E 3(t - T3)E2(t - -3 -r
2)E1(t
- T3 - r2 - i) (2.18)R (3)(-r3, r2, T1) = - Tr ([[[pr(7r3 + T2 + T1), PI(72 + 71i], PI(rih], Pr(0)]peg)
(2.19)
Expanding the commutators and rearranging several terms leads to a simplified form for R(3
R(3)(r3, T2, T1) = R(, -T2, TI) - R* (T3, T2, 7i) (2.20)
R1 = Tr (/q (T3 + -2 + 1) p,1(r2 + 71) Ip(r) p,(0)pe )
R2 = Tr (Mi1(T3 + T2 + T1)p1(T1)PeqI(0)pI(2 + 71))
R3 = Tr (/1'(r3 + T2 + 71)Ip1(T2 + T1)PeqlI(0)ip1(T1))
R4 = Tr (p1i(T3 + 72 + T1)pI(O)Peq1I(r1)p1I(72 + T1)) (2.21)
The four terms R1 to R4 correspond to ket/ket/ket, bra/ket/bra, bra/bra/ket, and
ket/bra/bra interactions, respectively, based on how the transition dipole moment operator acts on the density matrix.
2.4.1
Diagrammatic Perturbation Theory
A useful method for understanding and keeping track of the Ra terms' contributions to
a particular experiment are Feynman diagrams [79, 25, 80]. Each diagram represents a specific pathway that contributes to the signal, and by adding all the pathways together a complete nonlinear signal is generated. Each R, has a particular diagram or set of diagrams associated with it, depending on the system. For clarity I will continue with the example of the two-level system, showing the contribution from each R,.
In each Feynman diagram (see Figure 2-3) time increases from bottom to top. The relevant density matrix element for each pathway is listed in between the vertical lines. Each arrow represents a single light-matter interaction, causing a transition on either the bra or ket side of the density matrix. The strength of the transition is directly weighted by the transition dipole moment. After each interaction, the density matrix propagates via the appropriate time propagator. For all of the R, diagrams, the system exists in a coherent superposition between the ground and excited state after the first interaction, a population after the second interaction, and a final coherence that emits the signal field after the third interaction. Using these principles, the
R,: ket/ket/ket
IgXgI
e)(g|
T3 e)(g T,IgXgI
COsig 1 2 3 kig =k,-k 2+k3 R2: bra/ket/bra le)gl g)(e sig 1 2 3 ksi =-k,- k2+k3 R 3. bra/bra/ketIg)(g|
|e)(g| 1g)(eIg9Xg I
sig 1 2 3 k =-k,-k2+k R4: ket/bra/bra le)(gl e)(g|IgXgI
sig 1 2 3 kSig =k,-k 2+k3Figure 2-3: Pathways for the R0 contributions to third-order signal.
signals for R2 and R4 are
R2= Ieg14 exp(-ieg (T3 - T1) - yeg (71 + T3) -e T2)
R4= I peg 14 exp (-iweg(-3 + Ti) - 7yeg(ri + T3) - Fe -2) (2.22)
The main difference between R2 and R4 is the accumulation of phase during the initial
and final coherence times. For R2, the phase is reversed between the first and final
times whereas for R4 the phase accumulates further. Therefore, when 73 = 71 for R2
(and R3) there is a rephasing in that the phase is fully reversed. This is the basis for
the photon echo, which will be further discussed in Section 2.5.2.
While the Feynman diagram approach is quite useful, it does not completely recover the dynamics and interactions in many systems. Many-body interactions in
semiconductors, e.g. excitation-induced effects, Coulomb correlations, and exciton-free-carrier scattering, lead to nonlinear signals and yet are not captured by the Feynman diagrams approach because Feynman diagrams specifically deals with eigenstates of the material Hamiltonian [84, 85, 86, 87, 88, 89, 90]. Theoretical and experimen-tal methods to identify and quantify these effects are discussed in further detail in Chapter 8.
2.4.2
Phase-Matching
When applying the additional action of the electric fields to the response function to generate the polarization, the wavevectors of the electric fields add and subtract depending on if the light-matter interaction was on the bra or ket side in the Feynman diagram. The generated signal wavevectors, kig, are listed at the bottom of Figure
2-3 for each R,. Based on the phase-matching condition Zk = 0, it is clear that
R1 and R4 co-propagate and that R2 and R3 co-propagate. However, each pair of
contributions propagates in a unique direction. The first two signals are termed non-rephasing while the last two are non-rephasing or photon echo signals. These signals and several others are discussed in the next section.
2.5
Nonlinear Techniques
The experiments described in later chapters in this thesis take advantage of several nonlinear spectroscopy techniques that have been utilized and expanded upon for many years. Those first described are experiments designed to examine population dynamics [91, 82, 92]. The next technique is the photon echo, specifically aimed at disentangling coherence and dephasing dynamics [93, 82, 32, 94]. Two-quantum experiments are described next, specifically looking for correlations and interactions between excitations. Finally I describe multi-dimensional spectroscopy, an extension of all the previous methods that disentangles dynamics and correlations by spreading the spectral information into multiple dimensions.
2.5.1
Pump-Probe and Transient Grating
Pump-probe or transient absorption spectroscopy is a widespread technique used for monitoring the dynamics of excited states in many systems. A pump pulse excites the system and the change in absorption over time is monitored with a time-delayed probe pulse. While transient absorption can be described classically in terms of the third-order polarization and kinetics, the Feynman pathways approach allows for
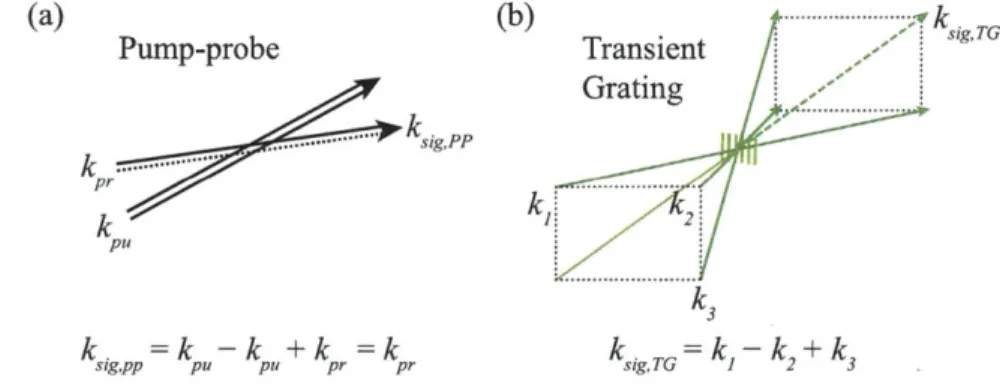
straightforward interpretation and calculation of the spectral changes and dynamics. The geometry of a pump-probe experiment is shown in Figure 2-4(a). The pump pulse interacts twice with the system, creating excited state population. After a time delay the probe interrogates the state of the system. The phase-matching condition requires the third-order signal to co-propagate with the probe pulse. The interference between the signal and probe is the reason the probe sees increased absorption or transmission. However, transient absorption experiments only monitor the imaginary part of the response: only changes in absorption are detected by the experiment.
(a) (b) - - . k.
Pump-probe Transient sig,TG
Grating .... ... ...-- - sigPP pr k Pu k3 k. sig,pp =k -k pu pU +k pr =k pr k sig,TG =k -k +k1 2 3
Figure 2-4: Phase-matching conditions for third-order spectroscopy. (a) Phase-matching geometry for pump-probe spectroscopy. (b) BOXCARS phase-Phase-matching geometry for transient grating.
The transient grating is a natural extension of transient absorption. Two different pulses with different wavevectors ki and k2 are time-coincident on a sample, interfering
in a periodic fashion (Figure 2-4(b)). The interference pattern creates a periodic change in the index of refraction with spacing d = A/2 sin(6/2), potentially in both the real and imaginary components. A third pulse with wavevector k3 is focused to
the same grating and upon seeing a periodically varying index of refraction diffracts into the phase-matched direction ksig,TG = k1 - k2 + k3. If the grating contains both
real and imaginary components then the signal will have both real and imaginary parts. The imaginary part is exactly the same as in transient absorption. However, the real part contains information pertaining to non-resonant effects, e.g. coherent acoustic waves, thermal heating, and the dispersion associated with the absorption peak (see Figure 2-1).
The transient grating technique is also highly sensitive to transport [95, 91, 96,
97, 981. The probe diffraction efficiency depends on the depth of the grating AN, i.e.
the contrast between the peaks and nulls of the grating. Diffusion of e.g. acoustic waves or excitons will lower the contrast in tandem with the decay of the excitation due to its finite lifetime. A simple model for the transient grating decay uses the one-dimensional diffusion equation
8N(x, t) 92 N(x, t)
(t = D
8t
8x
2 -92 FN (x, t)N(x, t) = e-"[1 + exp(-A 2Dt) cos(Ax)]/2. (2.23)
where D is the diffusion constant, F is the excitation decay rate, and the grating wavevector A = L. The grating depth and decay rate are
AN = N(x = 0, t) - N(d/2, t) = exp(-Kt/2)
K = 2(A 2D + F). (2.24)
A series of experiments with varied angles between the excitation beams changes
the rate of decay due to diffusion while leaving the decay due to the finite lifetime unchanged, allowing separation of the diffusive and lifetime effects on the grating signal.
Both transient absorption and transient grating typically monitor excited-state dynamics. However, there are a couple of disadvantages. The first is that all of the information content from R1 through R4 is contained in the signal; both rephasing and nonrephasing signals contribute. This means it is impossible to isolate dephasing dynamics in these experiments. The second disadvantage is the trade off between frequency selectivity in the pump and time resolution. In order to know exactly which excitation was pumped, a narrowband frequency-selective pump must be used. However, a frequency-selective narrowband spectrum leads to a long pulse in the time
domain, leading to a minimum time that can be resolved in the experiment. This deficiency is overcome by multi-dimensional spectroscopy as described in Section 2.5.4.
2.5.2
Photon Echo Spectroscopy
Photon echo spectroscopy is another extension of the previously mentioned tech-niques, performed by using the BOXCARS geometry and changing the time-ordering of the pulses in the transient grating experiment [32, 94]. When the pulse with the negative wavevector contribution (the conjugate pulse) arrives first, as discussed pre-viously for R2 and R3, a rephasing occurs when the final coherence time is equal to
the initial coherence time. This is because of the phase reversal during those two time periods. This is extremely useful when significant inhomogeneous broadening affects the system. For the two-level system, setting -r2 = 0 in R2 and R3 and including appropriate lineshape functions for homogeneous and inhomogeneous broadening [25] in the derivation for the nonlinear polarization leads to
R(3) = peg
'
exp(-i(eg)(73 - 71) - 7eg(Ti + T3) - (73 -- 1) 2
A2/2), (2.25)
where (weg) is the average frequency and A is the width of the frequency distribution. From Equation 2.25 it is clear that for T3 = r1 the only decay remaining is due to the
homogeneous dephasing, yeg. The standard experimental setup uses an integrating detector, e.g. photodiode, which for highly inhomogeneous systems (A > Yeg leads to
Ieig (ri) oc e- (2.26)
The inhomogeneous component no longer contributes to the signal decay due to the rephasing. The factor of four reflects the homogenous dephasing over two time periods and the fact that the integrating detector doubles the decay rate.
2.5.3
Two-Quantum Spectroscopy
Two-quantum (2Q) experiments involve the same geometry and phase-matching as an echo but the pulse time-ordering is switched: the conjugate pulse is the third pulse in the sequence. Thus, 2Q experiments are also referred to as S3 experiments. Similarly, photon echoes are S1 experiments and non-rephasing are S2. Because the S3 is specific to multiple excitations and their interactions, the simple two-level system example produces identically zero signal for S3. A higher-lying excited state accessible from the first excited state must exist. Vibrational overtones are directly probed in S3 IR measurements and anharmonicity is readily apparent [99]. In molecules the excitation of both electrons from the HOMO to the LUMO leads to S3 signals [100, 101, 102,
103], whereas in excitonic systems it is the excitation of multiple excitons across
multiple atoms in inorganic semiconductors [104, 105, 106, 107, 108, 109, 110, 111] or molecules in organic semiconductors [35, 112, 70]. In gas phase atoms, S3 signals can be generated due to excited atoms producing a local electric field (weak dipole-dipole interaction) that influences the neighboring atoms, coupling the excitations together to form a correlated doubly-excited state [113].
In a 2Q experiment, the first two pulses create a coherence between the doubly-excited state and the ground state, giving insight to its energy and lifetime. For example, the dephasing time is directly related to the correlation time for local field effects. The energy of the doubly-excited state reports on the binding or anti-binding between quasi-particles, as occurs when hydrogen-like excitons bind to form biexci-tons.
2.5.4
Multi-Dimensional Spectroscopy
The third-order polarization contains information about many processes occurring in the systems across three different time periods. To gain maximum knowledge of these processes would require three-dimensional spectroscopy. While that has been accomplished for some systems and under certain conditions [114, 115, 107, 116, 117], three-dimensional spectroscopy is somewhat impractical and time consuming due to
technical limitations. However, many research groups are adopting the more tractable two-dimensional spectroscopy (2DS) [118, 29, 119, 120]. This typically involves setting one of the time delays in the third-order polarization to zero. The experiments in this thesis are comprised almost entirely of 2DS experiments.
2DS offers many unique advantages compared to traditional one-dimensional
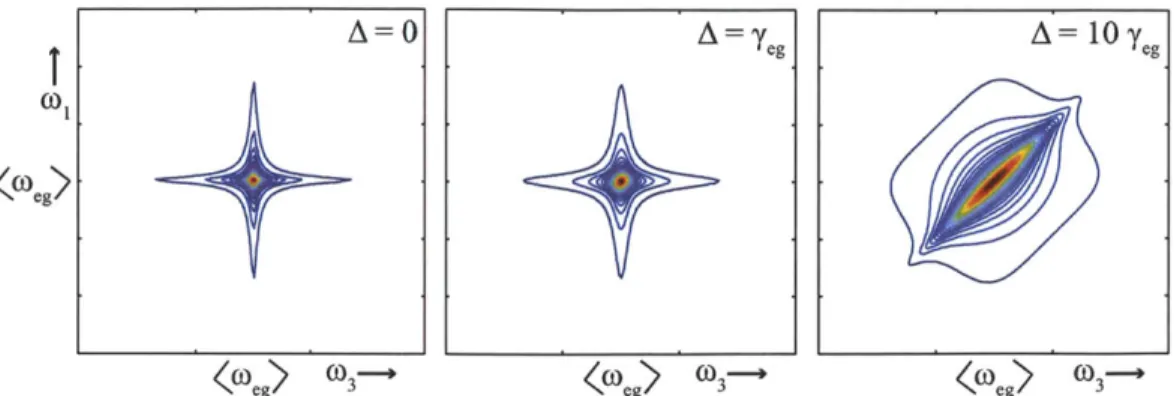
spec-troscopies like linear absorption, pump-probe and transient grating, and 1D photon echoes. Spreading the information content of the polarization out over multiple di-mensions disentangles different types of dephasing, coupling and interactions, and dynamics. This is illustrated in Figure 2-5 for the photon echo. On the left is the case with A = 0, showing uniform homogeneous damping. A increases moving left
to right, showing that with large inhomogeneous broadening, rephasing occurs along
T3 = T1 diagonal. The decay along the diagonal is determined primarily by
homoge-neous dephasing (and is the same magnitude as that in the left panel) whereas the anti-diagonal decay is primarily governed by inhomogeneous dephasing.
A
=0
A
=g yA= 1 0Y eTI
T3 3 3
Figure 2-5: Time-domain photon echo. Going from left to right displays signals with increasing inhomogeneity (A), showing the interplay between inhomogeneous and homogeneous dephasing.
A double Fourier transform of the time-domain photon echo in Figure 2-5 separates
the inhomogeneous and homogeneous lineshapes into two dimensions (Figure 2-6), clarifying the quantity of each present in the system. The anti-diagonal linewidth is related to the amount of homogeneous dephasing and for inhomogeneous systems the diagonal lineshape reflects the degree of inhomogeneity.
19eg)
0K eg) C 3~ -
eOg)
(03 K] g) (3kFigure 2-6: Frequency-domain two-dimensional photon echo. Going from left to right displays signals with increasing inhomogeneity (A), showing the increasing broad-ening along the diagonal frequency while maintaining a narrow linewidth along the anti-diagonal.
lineshapes, the imaginary and real parts of the echo signal do not correspond to the absorptive and dispersive components, respectively. Pump-probes and transient grating signals are directly related to absorptive and dispersive lineshapes because, as mentioned in Section 2.5.1, they contain all four Feynman diagrams R1 - R4. When extracting the susceptibility and the absorption spectrum from P(l) (t) a full Fourier transform is performed. For the photon echo and non-rephasing signals only a half-sided Fourier transform is performed with respect to Ti. This is due to restrictions
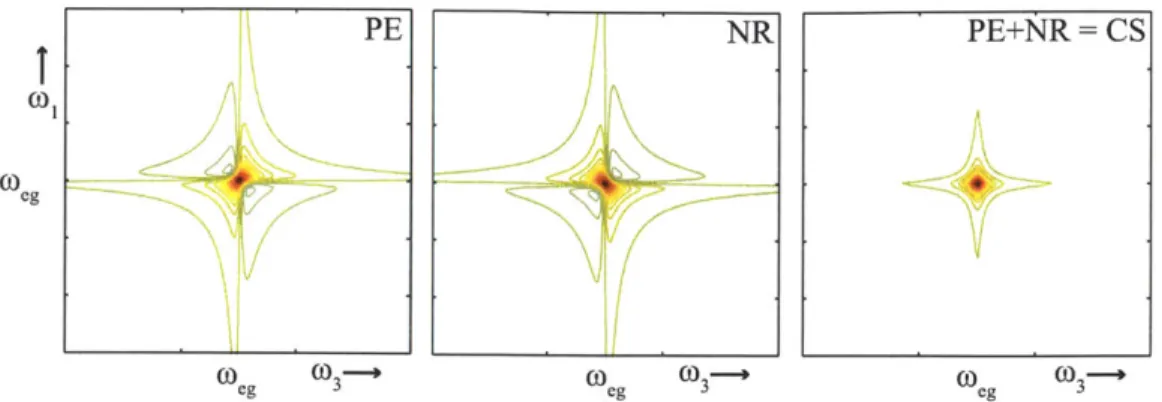
imposed by pulse-ordering: in the echo the conjugate pulse comes first, in the non-rephasing experiment the conjugate pulse comes second. This leads to phase twist in the real and imaginary components of Si and S2 signals [121, 122]. Adding the rephasing and non-rephasing spectra together forms correlation spectra with no phase twist and purely absorptive and dispersive components. This is demonstrated in Figure ?? for the two-level system example from previous sections. The left and middle panels show the imaginary components of the rephasing and non-rephasing signals. In a pump-probe experiment only stimulated emission and ground state bleaching terms appear, leading to a purely negative signal. The rephasing and non-rephasing signals have both positive and negative parts, whereas the correlation spectrum is purely negative.
Another unique advantage of 2DS is its direct sensitivity to coupling among
ex-.A = Y A = 10 y A =O0
eg
COeg 0)3 0Oeg CO 3 CO 3eg 3
Figure 2-7: Imaginary components of 2D spectra. Addition of photon echo (PE, left) and non-rephasing (NR, middle) 2D spectra lead to correlation spectra (CS, right) with purely absorptive lineshapes in the imaginary component.
citations. When a broadband laser pulse excites the sample, coupled transitions will cause additional signals compared to the uncoupled case in the 2DS spectrum. The physical mechanism generating the new signals involves polarizations coupling to one another. A light-matter interaction involving one transition leads to a polarization.
If the excited transition is coupled to a second transition, the excited polarization
acts as a source for a polarization involving the second transition. This is illustrated
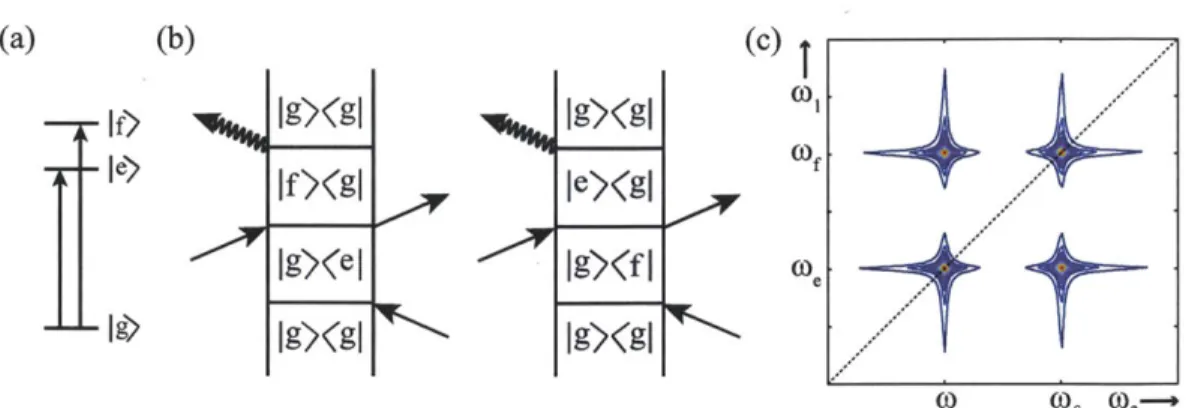
by the Feynman diagrams in Figure 2-8(b). The signals caused by coupling manifest
in a 2DS spectrum as crosspeaks (Figure 2-8(c)), indicating that excitation at one frequency leads to emission at another, even with r2 = 0. This is due to delocalizaiton
of the wavefunction across the two states.
Scanning T2 allows for population and coherent dynamics to occur, same as in a
pump-probe or transient grating measurement. However, the high frequency resolu-tion in the absorpresolu-tion and emission dimensions is maintained, allowing for the full recovery of coherent and energy transfer dynamics. For example, the crosspeaks in Figure 2-8(c) will oscillate because the system wavefunction is in a coherent superpo-sition between states