HAL Id: hal-01847666
https://hal.archives-ouvertes.fr/hal-01847666
Submitted on 23 Jul 2018HAL is a multi-disciplinary open access archive for the deposit and dissemination of sci-entific research documents, whether they are pub-lished or not. The documents may come from teaching and research institutions in France or abroad, or from public or private research centers.
L’archive ouverte pluridisciplinaire HAL, est destinée au dépôt et à la diffusion de documents scientifiques de niveau recherche, publiés ou non, émanant des établissements d’enseignement et de recherche français ou étrangers, des laboratoires publics ou privés.
Sources and spatial distribution of dissolved aliphatic
and polycyclic aromatic hydrocarbons in surface coastal
waters of the Gulf of Gabès (Tunisia, Southern
Mediterranean Sea)
Rania Fourati, Marc Tedetti, Catherine Guigue, Madeleine Goutx, Nicole
Garcia, Hatem Zaghden, Sami Sayadi, Boubaker Elleuch
To cite this version:
Rania Fourati, Marc Tedetti, Catherine Guigue, Madeleine Goutx, Nicole Garcia, et al.. Sources and spatial distribution of dissolved aliphatic and polycyclic aromatic hydrocarbons in surface coastal waters of the Gulf of Gabès (Tunisia, Southern Mediterranean Sea). Progress in Oceanography, Elsevier, 2018, 163, pp.232-247. �10.1016/j.pocean.2017.02.001�. �hal-01847666�
1
Sources and spatial distribution of dissolved aliphatic and polycyclic aromatic
1
hydrocarbons in surface coastal waters of the Gulf of Gabès (Tunisia, Southern
2
Mediterranean Sea)
3
4
Rania Fourati1, Marc Tedetti2*, Catherine Guigue2, Madeleine Goutx2, Nicole Garcia2, Hatem 5
Zaghden3, Sami Sayadi3, Boubaker Elleuch1 6
7 1
Laboratoire Eau-Energie et Environnement, ENIS, Université de Sfax, BP 1173, 3038 Sfax, 8
Tunisie 9
2
Aix Marseille Université, CNRS/INSU, Université de Toulon, IRD, Mediterranean Institute 10
of Oceanography (MIO) UM 110, 13288, Marseille, France 11
3
Laboratoire des Bioprocédés Environnementaux, Centre de Biotechnologie de Sfax, Route 12
de Sidi Mansour km 6, PO Box 1177, 3018 Sfax, Tunisie 13
14 *
Corresponding author: marc.tedetti@mio.osupytheas.fr; Phone: + 33 (0)4 86 09 05 27; 15
Fax: + 33 (0)4 91 82 96 41 16
17
For submission to Progress in Oceanography to the special issue MERMEX as a full research 18 article 19 20 Revised version 21 29 January 2017 22 23 24 25
2
Abstract
26
The goal of this work is to investigate the spatial distribution and sources of dissolved 27
aliphatic and polycyclic aromatic hydrocarbons (AHs and PAHs), as well as their 28
relationships with a series of biogeochemical parameters (total chlorophyll a, phaeopigment 29
a, suspended particulate matter, particulate and dissolved organic carbon, and nutrients), in 30
surface coastal waters of the Gulf of Gabès (Tunisia, Southern Mediterranean Sea). Samples 31
were collected off the Northern and Southern coasts of Sfax city, as well as in the Gabès-32
Ghannouch area, from October-November 2014 and in March 2015. Total dissolved AH and 33
PAH concentrationsranged from 0.02 to 6.3 µg L-1 and from 8.9 to 197.8 ng L-1, respectively. 34
These data suggest that this area has been moderate-to-highly impacted by hydrocarbons 35
compared to other Mediterranean coastal environments. The highest AH concentrations were 36
measured off of the Sfax Northern coast (near Ezzit wadi) and in the Gabès-Ghannouch area, 37
whereas the highest PAH concentrations were recorded in the Sfax Southern coast (near 38
commercial and fishing harbours and the Sidi Salem channel). Analysis of the AH molecular 39
patterns reveals that low molecular weight (LMW) compounds in these samples are 40
dominated by n-C16, n-C17 and n-C18, which suggests that these samples feature high biogenic 41
activity (in the form of bacteria or algae), and that high molecular weight (HMW) compounds 42
display monomodal distributions centred on n-C25 and n-C26, which can be attributed to 43
petrogenic inputs. The PAH molecular patterns are characterized by the dominance of LMW 44
(2-3 rings) compounds and their alkylated homologues, which account for 90 ± 7% of total 45
PAHs. The observed PAH distribution and isomer ratios thus indicate the presence of major 46
petrogenic contaminations. The concentrations of AHs, PAHs and dissolved organic carbon 47
(DOC) do not correlate with each other, thus demonstrating that these three pools likely 48
originated from different sources and subsequently underwent different processes in the Gulf 49
of Gabès. 50
3 51
Keywords: Aliphatic hydrocarbons, polycyclic aromatic hydrocarbons, Gulf of Gabès,
52
Mediterranean Sea, anthropogenic signatures, biogenic inputs. 53
54
1. Introduction
55
56
Hydrocarbons, including aliphatic hydrocarbons (AHs) and polycyclic aromatic 57
hydrocarbons (PAHs), are among the most ubiquitous organic compounds in marine 58
environments (Lipiatou and Saliot, 1991a; Roose and Brinkman, 2005; Dachs and Méjanelle, 59
2010). AHs, which may be defined as straight chained, branched, or cyclic non-aromatic, are 60
herein considered to be comprise a series of resolved compounds (R), including linear n-61
alkanes (n-Cx) and two branched n-alkanes (isoprenoids), pristane (Pr) and phytane (Phy), as 62
well as unresolved complex mixture (UCM). While AHs have several biogenic sources, 63
including higher plant waxes, marine phyto- and zoo-plankton, bacteria and diagenetic 64
transformations (Cripps, 1989; Rieley et al., 1991; Volkman et al., 1992; Wang et al., 1999), 65
their anthropogenic sources mainly comprise unburned petroleum/oils (Mazurek and 66
Simoneit, 1984; Bouloubassi and Saliot, 1993; Wang et al., 1997; Readman et al., 2002). 67
PAHs consist of two or more fused benzene rings and are composed of parent 68
compounds and their alkylated homologues. They are synthesized during the formation of oil 69
(petrogenic PAHs), during the incomplete combustion of fossil fuels and biomass (pyrogenic 70
PAHs) (Wang et al., 1999; Wurl and Obbard, 2004; Pampanin and Sydnes, 2013), and 71
biologically produced in soils by woody plants and termites or in oceanic environments 72
through microbial degradation of organic matter (Chen et al., 1998; Wilcke et al., 2002). 73
Petrogenic PAHs encompass low molecular weight (LMW) 2-3 ring compounds and their 74
alkylated homologues, whereas pyrogenic PAHs encompass high molecular weight (HMW) 75
4
4-6 ring compounds with a low proportion of alkylated derivatives (Neff, 1979; Wang et al., 76
1999). PAHs, which are deleterious to living organisms (Kennish, 1992; Samanta et al., 77
2002), have long been recognized as high-priority contaminants by both the European Union 78
(Official Journal of the EU 24/08/2013, Directive 2013/39/EU) and the United States 79
Environmental Protection Agency (US EPA, 40 CFR Part 423, Appendix A to Part 423). 80
The Mediterranean Sea has long been considered to be one of the most polluted seas in 81
the world (Hinrichsen, 1990; UNEP/MAP, 2012). It is believed that anthropogenic AHs and 82
PAHs released from urban, industrial, and agricultural activities may enter Mediterranean 83
waters through rivers (Lipiatou and Saliot, 1991b; Tolosa et al., 1996), surface runoffs, 84
effluents (Guigue et al., 2011), atmospheric deposition (Castro-Jiménez et al., 2012) and sea-85
based or shipping-related activities (Tsapakis et al., 2010; Tornero and Hanke, 2016). Because 86
of their low solubility in water, AHs and PAHs are considered to be preferentially associated 87
with particles in coastal marine waters (May et al., 1978; Gustafsson et al., 1997; Adhikari et 88
al., 2015). Therefore, most of studies dealing with hydrocarbons in the Mediterranean Sea 89
have focused on sediments and particles, whereas relatively little work has studied the 90
dissolved phase of the water column (Dachs and Méjanelle, 2010; The Mermex group, 2011). 91
However, the dissolved phase is considered as a significant compartment for 92
hydrocarbon dynamics in the ocean. First, some studies have shown that the concentrations of 93
hydrocarbons, mostly PAHs, in the dissolved phase are equal to or higher than those in the 94
particulate phase of coastal and open ocean waters (Bouloubassi and Saliot, 1991; Tedetti et 95
al., 2010; Berrojalbiz et al., 2011; Guigue et al., 2011; 2015). Second, dissolved PAHs in 96
surface waters represent a relevant compartment to investigate the dynamics of air-water 97
fluxes (González-Gaya et al., 2016). Third, dissolved hydrocarbons become bioconcentrated 98
by passive diffusion and respiration and are thus more bioavailable for marine biota than are 99
particulate hydrocarbons, for which bioaccumulation by ingestion occurs within a smaller 100
5
variety of organisms (i.e. filter feeders) (Tilseth et al., 1984; Akkanen et al., 2012). Finally, in 101
the dissolved phase, hydrocarbons are subjected to a variety of processes, such as 102
volatilization (via air-water gas exchanges) (Guitart et al., 2010; González-Gaya et al., 2016), 103
biodegradation (Jiménez et al., 2011; Sauret et al., 2016), phototransformation (Al-Lihaibi, 104
2003; King et al., 2014) and complexation with dissolved organic matter (DOM) (Sabbah et 105
al., 2004; Kim and Kwon, 2010), which may in turn modify their bioavailability and thus 106
modify their fate in marine waters (Berrojalbiz et al., 2011; Adhikari et al., 2015). 107
The Gulf of Gabès (Southeastern Tunisia) is one of the most productive ecosystems of 108
the Mediterranean Sea and is the main fishing area of Tunisia (Jabeur et al., 2000; Bel Hassen 109
et al., 2009; D’Ortenzio and Ribera d’Alcalà, 2009; The Mermex group, 2011). At the same 110
time, the coastal zone of the Gulf of Gabès has been strongly affected by anthropogenic 111
activity due to the recent significant expansion of the population and the intensification of 112
industrial and agricultural activities. These anthropogenic inputs can be attributed to 113
contributions from great urban centres (i.e., Sfax and Gabès cities), fishing and commercial 114
harbours, several phosphoric acid production plants, municipal landfills and wastewater 115
effluents, and industrial and agricultural waste issued from the production and storage of olive 116
oil, chemical products, textiles, soap and paint (Aloulou et al., 2012). The Gulf of Gabès has 117
thus recently become a site of growing interest for investigations of contaminants. Numerous 118
studies have reported the levels of hydrocarbons in sediments (Aloulou et al., 2010; Amorri et 119
al., 2011; Louati et al., 2001; Zaghden et al., 2005; 2007; 2014). Nonetheless, to our 120
knowledge, no data concerning the distribution of dissolved hydrocarbons in surface waters of 121
this ecosystem currently exist. Therefore, the overall objective of this work is to evaluate, for 122
the first time, the origins and spatial distributions of dissolved AHs and PAHs, along with 123
several biogeochemical parameters, in the surface waters of the Sfax and Gabès coastal areas. 124
6 126
2. Materials and Methods
127
128
2.1. Study area
129
The Gulf of Gabès, located in the Southeastern region of Tunisia (within the Southern 130
Mediterranean Sea), extends from the city of Chebba (35°14’N, 11°09’E) to the Tunisian-131
Libyan border (33°10’N, 11°34’E) and encompasses the Kerkennah and Djerba islands (Fig. 132
1). It is characterized by several unique geomorphologic, climatic and oceanographic 133
conditions. First, the tidal range is one of the highest within the Mediterranean Sea, due to the 134
width (~ 250 km) and very low slope of its continental shelf (Sammari et al., 2006; Hattour et 135
al., 2010). Second its basin is very shallow: in some areas, the water depth does not exceed a 136
few meters over a distance of several kilometres, thus making the Gulf of Gabès very 137
sensitive to atmospheric changes (Hattab et al., 2013) and inducing weak currents, high 138
temperatures (14-29 °C) and high salinities (38-40) in surface waters (Hamdi et al., 2015). 139
The climate in the Gulf of Gabès is arid to semiarid (i.e., dry and sunny) with strong easterly 140
winds (INM, 2008), resulting in severe aeolian erosion and the transportation of Saharan dusts 141
into the sea (Jedoui, 1980; Bouaziz et al., 2003). Finally, the Gulf of Gabès is one of the most 142
productive areas of the Mediterranean Sea [with a total chlorophyll a concentration (TChl a) 143
that can reach 20 µg L-1] and accounts for 65% of all Tunisian fish production (Jabeur et al., 144
2000; Bel Hassen et al., 2009; D’Ortenzio and Ribera d’Alcalà, 2009; DGPA, 2010; The 145
Mermex group, 2011). Because the Gulf of Gabès is an essential region for the Tunisian 146
economy, this coastal area has been strongly influenced by anthropogenic activity from 147
various urban, industrial and agricultural outputs for many decades. These activities are 148
particularly pronounced in the two largest cities of the Gulf, Sfax and Gabès (Fig. 1). 149
7
Sfax (34°43’N, 10°46’E; Fig. 1) is the second-largest city in Tunisia (with 730,000 150
inhabitants) and represents its economic centre. The Sfax Northern coast (which extends from 151
the commercial harbour to Ezzit wadi and beyond; Fig. 1) was recently restored through the 152
Taparura project. This area features the outlet of the rainwater drain channel (“PK4”), the 153
outlet of the Ezzit wadi, and the “Poudrière” industrial zone (Fig. 1). The Sfax Southern coast 154
extends from the commercial harbour to the southern boundary of the Salina/Thyna 155
agglomeration and containts the “SIAPE” phosphoric acid industry (Fig. 1). Near this industry 156
are also the Thyna municipal landfill and the “ONAS” wastewater treatment plant (WWTP). 157
SIAPE washing water, the WWTP effluent, and the municipal landfill leaching waters are 158
released into the sea through a channel that joins the El Hakmouni wadi eastward of the 159
WWTP. Moreover, the Sfax Southern coast encompasses several industrial zones, including 160
“Madagascar”, the fishing harbour and “Sidi Salem” (Fig. 1). 161
The Gabès-Ghannouch area (33°56’N, 10°03’E; Fig. 1) contains approximately 130,000 162
inhabitants and is characterized by important industrial and harbour activities. The “GCT-163
Gabès” phosphoric acid industry is situated along the commercial harbour. This area also 164
houses a thermal power plant in the commercial harbour zone, petrochemical and off-shore 165
petroleum infrastructures, and industries related to agribusiness, building materials, energy 166
production and textiles. The El-Tine and Gabès wadis receive a variety of urban, industrial 167
and agricultural wastes (Fig. 1) (see Text S1 for complete description of Sfax and Gabès 168 coastal areas). 169 170 2.2. Sampling 171
Thirty-six stations were sampled in the coastal areas of Sfax (October 2014 and March 172
2015) and Gabès cities (November 2014) (Fig. 1; Table 1). For each transect, the most coastal 173
station was located approximately 100 m (S1, S5, S8, S14, S15, S19) or 300 m (S12, S16, 174
8
S22, S25, S27, S30, S33, S35) from land. With the exception of S1-S2, S5-S6, and S8-S9, 175
which were sampled from a distance of 200 m, all stations were located at 1000 m intervals 176
along each transect (Fig. 1; Table 1). Sampling was performed on board the vessel 177
“Taparura” between 10:30 am and 3:30 pm (18 and 23 October 2014), 8:30 am and 12:30 pm 178
(13 November 2014), and 14 pm and 16.30 pm (8 March 2015). This sampling occurred 179
around high tide and under calm sea and sunny conditions (18 and 23 October, 13 November 180
2014) or in cloudy weather (8 March 2015). Seawater samples were collected at a depth of ~ 181
0.1 m using 4-L Nalgene® polycarbonate bottles (ThermoFisher Scientific, Waltham, USA), 182
which were opened below the water surface to avoid sampling of the surface microlayer. 183
Before their use, these bottles were extensively washed with 1 M hydrochloric acid (HCl) and 184
ultrapure water (i.e., Milli-Q water from Millipore system, final resistivity: 18.2 MΩ cm-1). 185
They were then rinsed three times with each respective sample before being filled and placed 186
in a cold and dark area after collection. On board, in situ measurements of temperature, 187
salinity and pH were obtained using measuring cellswith the TetraCon® 4-electrode system 188
and a refractometer (WTW, Weilheim, Germany). Temperature and salinity data are not 189
available for stations S1, S5, S8, S14, S15 and S19 (see data in Table 2). 190
191
2.3. Filtration, handling and storage of samples
192
Once in the laboratory, samples were immediately filtered under low vacuum conditions 193
(< 50 mm Hg) through pre-combusted (500 °C, 4 h) GF/F (~ 0.7 µm) glass fibre filters (25 or 194
47 mm diameter, Whatman, Fisher Scientific, Illkirch, France) using glassware filtration 195
systems. To analyse dissolved hydrocarbons (AHs and PAHs), 2 L of samples were filtered 196
through 47-mm diameter GF/F filters. Filtered samples were then stored in 2.5 L amber glass 197
bottles with 50 mL of dichloromethane (CH2Cl2) at 4 °C, in the dark, before undergoing 198
solvent extraction (see §2.4). It should be noted that these filters were also used for particulate 199
9
hydrocarbon analyses, but these results are not presented in this study. For analyses of TChl a 200
and phaeopigment a (Phaeo a), 250-300 mL of samples were filtered through 25-mm 201
diameter GF/F filters. Filters were stored in Nunc® cryogenic vials (Dutscher, Brumath, 202
France) at -20 °C until analysis. For analyses of suspended particulate matter (SPM) and 203
particulate organic carbon (POC), between 250 and 1100 mL of sample, depending on their 204
station of origin, were both filtered with pre-weighted 25-mm diameter GF/F filters. After this 205
filtration, filters were dried at 60 °C for 24 h and stored in Petrislides MilliPore® (Saint-Louis, 206
USA) until analysis. Filtered seawater issued from this SPM and POC filtration was 207
transferred in 100-mL Schott® glass bottles (Fisher Scientific) and in 60-mL HDPE bottles for 208
nutrient and dissolved organic carbon (DOC) analyses, respectively. Glass and HDPE bottles 209
were stored at -20 °C until analysis. Nutrient, TChl a, Phaeo a, SPM, and POC analyses were 210
not conducted for samples obtained from S1, S5, S8, S14, S15 and S19, whereas DOC 211
analyses were not performed on samples from stations S1, S5 and S14 (see analytical 212
procedures in § 2.7 and data in Table 2). 213
214
2.4. Hydrocarbon extraction, purification and instrumental analysis
215
Dissolved hydrocarbons in the < 0.7 µm size fraction were extracted from seawater 216
using liquid-liquid extraction with CH2Cl2 (2 x 50 mL per litre), according to the procedure of 217
Guigue et al. (2011; 2014; 2015). These extracts were then concentrated by using a rotary 218
evaporator before changing the solvent to n-hexane. Hexane extracts were then purified to 219
separate the hydrocarbon fraction from more polar compounds. Extracts were fractionated 220
within a 500 mg silica column (Silica gel extra pure, Merck, Darmstadt, Germany), which had 221
previously been activated at 500 °C for 4 h and then partially deactivated with ultrapure water 222
(2% w/w). AHs and PAHs were eluted together using 2 mL of n-hexane followed by 3 mL of 223
10
n-hexane/CH2Cl2 (3:1 v/v) (Guigue et al., 2014; 2015). All solvents were of organic trace 224
analysis quality (Rathburn Chemicals Ltd, Walkerburn, Scotland). 225
Purified hydrocarbon fractions (AHs + PAHs) were analysed by a gas chromatograph-226
mass spectrometer (GC-MS) (5977A Series GC/MSD System, Agilent Technologies, Santa 227
Clara, USA) running at an ionization energy of 70 eV for a m/z range of 50-400, and using 228
the selected ion monitoring (SIM) mode. The GC-MS used helium at a flow rate of 1.2 229
mL/min as a carrier gas and an HP-5 MS column (30 m x 0.25 mm x 0.25 µm, J&W 230
Scientific, Agilent Technologies). The injector (used in splitless mode) and detector 231
temperatures were set at 270 and 320 °C, respectively. The non-linear temperature program 232
used for the column was as follow: 70 °C for 3 min, 15 °C/min (ramp 1) to 150 °C, and then 7 233
°C/min (ramp 2) to a final temperature of 320 °C, held for 10 min. The identification and 234
quantification of hydrocarbons in samples and calibrations were performed in SIM mode 235
(Guigue et al., 2014; 2015). 236
237
2.5. Quality assurance/Quality control
238
During the experiments and analyses, gloves were worn and care was taken to avoid 239
contamination. All the glassware was washed with 1 M HCl and ultrapure water before being 240
baked at 500 °C for 4 h. All materials that could not be baked were washed with 1 M HCl and 241
ultrapure water and dried at room temperature. 242
AH and PAH external calibration standards (04071, Fluka and 47543-U, Supelco, 243
among others,purchased from Sigma-Aldrich) were run for peak identification, and sample 244
quantifications were processed using internal standards. Deuterated standard mixtures, which 245
were introduced in samples prior to extraction (n-C16-d34, n-C24-d50, n-C36-d74 for AHs, and 246
Naph-d8, Phe-d10, Per-d12 for PAHs) and prior to injection (Ace-d10, Flu-d10 and Chrys-d12), 247
were used to determine procedural recoveries and to quantify hydrocarbons in samples. 248
11
Average recoveries of n-C16-d34, n-C24-d50 and n-C36-d74 were 93% for each standard, while 249
those of Naph-d8, Phe-d10, Per-d12 were 51, 71, and 84%, respectively. These procedural 250
recoveries, which include the processes of extraction, evaporation, and purification, do not 251
take into account the potential losses of HMW dissolved hydrocarbons by sorption onto 252
polycarbonate bottles during the few hours between the sampling and filtration steps, which 253
are very difficult to quantify in natural samples (Delle Site, 2001). Blanks were run for the 254
entire procedure, including extraction, solvent concentration, and purification. The total mass 255
of all AH and PAH compounds measured in these procedural blanks represented on average 256
19 and 4% of the total mass of all AH and PAH compounds measured in these samples, 257
respectively. For AHs, the procedural blank was mainly due to n-C23, n-C24, n-C30, and n-C32. 258
All concentration values were blank- and recovery-corrected. Detection limits of the method 259
used for individual compounds varied from 1 to 30 pg L-1 in water. 260
261
2.6. Determination of hydrocarbon indices and ratios
262
For AHs, we determined the concentration of resolved compounds (R) (i.e., n-alkanes 263
from n-C15 to n-C40, including Pr and Phy) and the concentration of the UCM by integrating 264
the hump (if present) using the mean response factors of the resolved compounds.Biogenic 265
AHs were distinguished from petrogenic AHs mainly by relying on their molecular pattern 266
distribution and then by determining several ratios and indices. First, we used the R/UCM 267
ratio as an indicator of recent petroleum contamination (when > 0.3) or severe degraded 268
petroleum contamination (when < 0.05) (Simoneit and Mazurek, 1982; Commendatore and 269
Esteves, 2004; Asia et al., 2009; Commendatore et al., 2012). We also used the Pr/Phy ratio 270
as an indicator of biogenic AHs (when > 1) (Cripps, 1989; Commendatore and Esteves, 2004; 271
Cincinelli et al., 2008). However, due to the controversial origin of these isoprenoids, it is not 272
relevant to employ this ratio as an indicator of petrogenic AHs (when it is < 1). Finally, we 273
12
used the carbon preference index (CPI15-40), computed as the odd/even ratio in the n-C 15–n-274
C40 range, as an indicator of biogenic AHs (CPI15-40 > 1 or < 1) or AHs issued from petroleum 275
contaminations (CPI15-40 ~ 1) (Commendatore et al., 2012). 276
We quantified 29 PAH compounds (∑29 PAHs-P+A) in these samples. These include 19 277
parent PAHs (PAHs-P), which are naphthalene (Naph), acenaphthylene (Acy), acenaphthene 278
(Ace), fluorene (Flu), dibenzothiophene (DBT), phenanthrene (Phe), anthracene (Ant), 279
fluoranthene (Flt), pyrene (Pyr), benz[a]anthracene [BaA], chrysene (Chr), 280
benzo[b]fluoranthene [BbF], benzo[k]fluoranthene [BkF], benzo[a]pyrene [BaP], 281
benzo[e]pyrene [BeP], perylene (Per), dibenzo[a,h]anthracene [DA], benzo[g,h,i]perylene 282
[BP] and indeno[1,2,3-cd]pyrene [IP]. We also quantified 10 alkylated homologues (PAHs-A), 283
including methyl (C1), dimethyl (C2) and trimethyl (C3) of Naph and Phe, and C1 and C2 of 284
Flu and Pyr. Petrogenic and pyrogenic PAHs were discriminated mainly by relying on their 285
molecular pattern distribution and then by determining selected ratios (Lipiatou and Saliot, 286
1991; Budzinski et al., 1997; Mille et al., 2007). First, we usedthe ratio between alkylated 287
homologues and parent compounds (Alk/Par); generally, petrogenic PAHs are characterized 288
by the dominance of alkylated homologues over their parent compounds (Alk/Par > 1), 289
whereas the inverse pattern is observed for pyrogenic PAHs (Youngblood and Blumer, 1975). 290
Second, we used the Ant/(Ant + Phe) and Flt/(Flt + Pyr) ratios, as indicators of pyrogenic (> 291
0.1 and > 0.5, respectively) or petrogenic PAHs (< 0.1 and < 0.4, respectively) (Budzinski et 292
al., 1997; Yunker et al., 2002; Asia et al., 2009; Li et al., 2015). It is worth noting that all 293
these ratios and indices have to be used with precaution since hydrocarbon presence patterns 294
may be substantially modified by many processes. 295
296
2.7. Biogeochemical analyses
13
Nutrients, such as nitrites (NO2-), nitrates (NO3-), phosphates (PO43-), and silicates 298
[Si(OH)4] were analysed using the automated colorimetric method described in Aminot and 299
Kérouel (2007). To obtain reproducible nutrient measurements, we used standards and 300
compared their results to those of commercial products (OSIL Ltd, Havant, UK). The 301
detection limits of NO2-, NO3-, and PO43- were 0.05, 0.05, and 0.02 μM, respectively. 302
TChl a and Phaeo a were analysed using the fluorescence method following a methanol 303
extraction (Raimbault et al., 2004). Five mL of methanol (RP Prolabo, VWR France, 304
Fontenay sous Bois, France) were added to the filter, and, after 30 minutes of extraction in the 305
dark at 4 °C, a fluorescence measurement was performed using a fluorometer from model 10 306
Turner Designs (Sunnyvale, USA) equipped with the Welschmeyer kit to avoid Chl b 307
interference (Welschmeyer, 1994). As the monochromatic fluorescence method cannot 308
separate divinyl chlorophyll from chlorophyll, results are given in terms of total Chl a (TChl 309
a) concentrations, representing the sum of Chl a and divinyl Chl a. The blank “methanol + 310
filter” was close to zero, yielding a very low detection limit of approximately 0.01 μg L-1 . 311
Calibrations were made using a pure Sigma Chl a standard. We applied the acidification 312
method to determine Phaeo a concentrations (Raimbault et al., 2004). 313
After spending 24 h in the desiccator, filters were reweighed on the same balance, and 314
the SPM concentration was calculated as the difference between the filter weight before and 315
after sample filtration, normalised to the filtration volume (Neukermans et al., 2012). POC 316
was then determined with an AutoAnalyser II Technicon (New York, USA) using the wet-317
oxidation procedure established by Raimbault et al. (1999). The POC detection limit was 0.50 318
µM. 319
To determine DOC, samples were acidified with orthophosphoric acid and analysed 320
using a TOC-5000 total carbon analyser (Shimadzu, Kyoto, Japan) (Sohrin and Sempéré, 321
2005). Average TOC concentrations in Deep Atlantic Water and low carbon water reference 322
14
standards were 43 ± 2 µM C, n = 24 and 1 ± 0.3 µM C, n = 24, respectively. The analytical 323
precision of the procedure was ≤ 2%. 324
325
2.8. Statistical treatment
326
Colour maps of dissolved AH and PAH concentrations were performed using Ocean 327
Data View (ODV) software version 4.6.5 (Schlitzer, R., http://odv.awi.de, 2014.). The spatial 328
interpolation/gridding of data was conducted using Data-Interpolating Variational Analysis 329
(DIVA) (Barth et al., 2010; Troupin et al., 2012). Because all variables (except pH) displayed 330
non-normal distributions and high-amplitude values (Joliffe, 1986), it was preferable to use 331
Spearman’s rank-order correlation over Pearson’s correlation. Hierarchical ascendant 332
classification (HAC) was used to find homogenous groups of individuals (stations) within the 333
dataset, with respect to selected variables. These groups (or clusters) present a low within-334
variability and are different than others (displaying high between-variability). The 335
dissimilarity measurement between clusters was based on Ward’s method, which uses squared 336
Euclidean distance. Variable values were centred and reduced beforehand. Two different 337
HAC were then applied: one on physical and biogeochemical parameters (i.e., T, salinity, pH, 338
NO2-, NO3-, PO43-, Si(OH)4, TChl a, Phaeo a, SPM, POC, DOC) and the other one on selected 339
hydrocarbon parameters (i.e., R, Pr/Phy, CPI15-40, for AHs, ∑29 PAHs-P+A, Alk/Par, Flt/(Flt + 340
Pyr) for PAHs). Clusters (groups) issued from these HAC were represented in the form of 341
box-and-whisker plots. Principal component analysis (PCA) was also applied to these 342
hydrocarbon variables, based on Spearman’s rank-order correlation matrix. Normality tests 343
(including Shapiro-Wilk, Jarque-Bera and Kolmogorov-Smirnov tests), Spearman’s rank-344
order correlation matrices, HAC, and PCA were performed using XLSTAT 2013.5.01 (a 345
Microsoft Excel add-in program), while box-and-whisker plots were completed with 346
15
StatView 5.0. The significance threshold for these different analyses and tests was set at p < 347 0.05. 348 349 3. Results 350 351
3.1. Spatial distribution of physical and biogeochemical parameters
352
Physical and biogeochemical parameters are reported in Table 2. Applying HAC to this 353
dataset reveals the presence of six groups of stations (G1-G6; Fig. 1; Fig. 2a-i). The first 354
group (G1) includes stations S2 and S6, which are located on the Sfax Northern coast, in front 355
of Ezzit wadi and between Ezzit wadi and PK4 channel, respectively (Fig. 1). These stations 356
are characterized by the highest observed POC (245 and 208 µM, respectively; Fig. 2h) and 357
SPM concentrations (44 and 59 mg L-1, respectively; Fig. 2i), as well as the highest measured 358
salinity values (~ 42.0), and high TChl a (16 µg L-1 in S2; Fig. 2e), Phaeo a (3.5 µg L-1 in S6; 359
Fig. 2f) and DOC concentrations (181 µM in S2; Fig. 2g) (Table 2). G2 includes all other 360
stations from the Sfax Northern coast (S3, S4, S7, S9-S13) as well as station S35 from the 361
Gabès-Ghannouch area (Fig. 1). This group is marked by the lowest observed PO43- (10.4 ± 362
2.3 µM; Fig. 2c), TChl a (3.7± 1.4 µg L-1; Fig. 2e), and Phaeo a concentrations (1.3 ± 0.6 µg 363
L-1; Fig. 2f) (Table 2). G3 encompasses stations S16 (in front of the fishing harbour), S20 (in 364
front of the Sidi Salem channel) and S22 (in front of the El Maou wadi) on the Sfax Southern 365
coast (Fig. 1). These stations yield the highest measured concentrations of NO2- (0.8 ± 0.1 366
µM; Fig. 2a), PO43- (107.5 ± 22.0 µM; Fig. 2c), TChl a (27.8 ± 13.5 µg L-1; Fig. 2e), Phaeo a 367
(6.8 ± 3.4 µg L-1; Fig. 2f), and DOC (194.8 ± 10.7 µM; Fig. 2g), as well as high 368
concentrations of NO3-, POC, and SPM (Fig. 2b, h, i; Table 2). Therefore, it is likely that 369
these three stations were subjected to intense eutrophication. G4 includes the remaining 370
stations from the Sfax Southern coast (S17, S18, S21, S23-S26) (Fig. 1), which are marked by 371
16
the lowest concentrations of Si(OH)4 (3.1 ± 1.4 µM; Fig. 2d), POC (30.7 ± 12.8 µM; Fig. 2h), 372
and SPM (10.2 ± 1.7 mg L-1; Fig. 2i), the highest T values (26.8 ± 0.3 °C), and the lowest pH 373
values (8.0 ± 0.05) (Table 2). G5 comprises stations from the Gabès-Ghannouch area (S27-374
S32, S36) (Fig. 1), which are characterized by the lowest NO2- concentrations (~ 0. µM; Fig. 375
2a), the lowest salinity values (34.7 ± 2.4), and high DOC concentrations, with the highest 376
value for S30 (217.6 µM; Fig. 2g) (Table 2). Finally, G6 includes stations S33 and S34, which 377
are located between the fishing and commercial harbours of the Gabès-Ghannouch area (Fig. 378
1). They record the highest concentrations of Si(OH)4 (27.6-33.4 µM; Fig. 2d) and NO3- (3.2-379
4.0 µM; Fig. 2b), as well as high concentrations of PO43- (35.9-42.0 µM; Fig. 2c) and TChl a 380
(7.7-8.7 µg L-1; Fig. 2e) (Table 2). 381
382
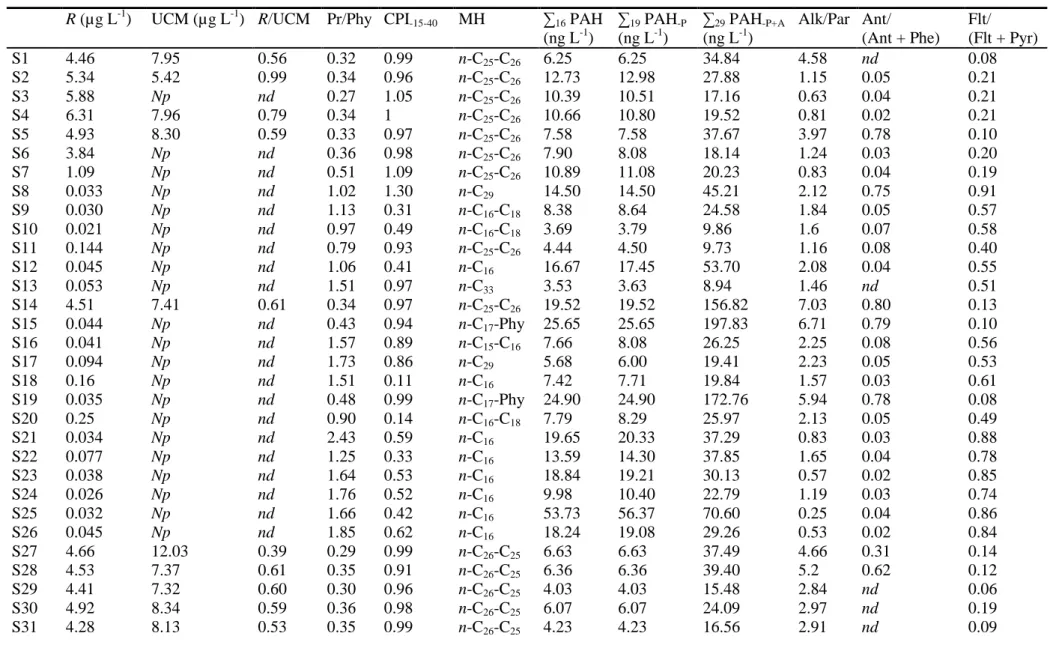
3.2. Spatial distribution of dissolved hydrocarbons
383
Dissolved total AH and PAH concentrations and ratios are reported in Table 3. HAC 384
and PCA applied to the main hydrocarbon variables from these tables reveal the presence of 385
three groups of stations (G’1-G’3). These three groups are represented by PCA (Fig. 3) (HAC 386
dendrogram not shown), in the form of box-and-whisker plots (Fig. 4) and colour maps (Fig. 387
5). AH and PAH molecular profiles are shown in Fig. 6 and Fig. 7, respectively. Stations 388
displaying similar molecular profiles were grouped together. Below, we describe the 389
hydrocarbon content of each of these three HAC/PCA groups. 390
391
3.2.1. Group G’1
392
Group G’1 includes the northernmost stations of Sfax (S1-S6) and all stations from the 393
Gabès-Ghannouch region (S27-S36) (Fig. 1, 3, 5). These stations are characterized by the 394
highest R concentrations, including Pr and Phy, with an average of 4.7 ± 0.7 µg L-1 (Table 3; 395
Fig. 3, 4a, 5). UCM is present in all stations, except S3 and S6, with concentrations varying 396
17
from 5.42 (S2) to 14 µg L-1 (S34), representing 63.4 ± 5.7% of the total AH pool (Table 3). 397
When present, R/UCM values are all > 0.30 (Table 3). This group exhibits the lowest Pr/Phy 398
ratios, which vary from 0.27 (S3) to 0.36 (S30, S33) (Table 3; Fig. 4b). AH molecular profiles 399
display monomodal distributions centred on n-C25–n-C26 compounds (Fig. 6a). An equal 400
amount of even and odd carbon numbered n-alkanes is also observed, resulting in CPI15-40 401
values close to 1 (Table 3; Fig. 4c). 402
Concentration of ∑29 PAHs-P+A was 29.7 ± 12.1 ng L-1 (Table 3; Fig. 3, 4d, 5). Alk/Par 403
ratios range from 0.6 (S3) to 5.5 (S33) but are mainly > 2 (Table 3; Fig. 4e). PAHs-P+A pattern 404
distributions are marked by the dominance of LMW compounds (2-3 rings) over HMW 405
compounds (≥ 4 rings) (Fig. 7a, f), the former representing 88 ± 4% of total PAHs. 406
Naphthalenes (C2-Naph > Naph > C3-Naph > C1-Naph) represent the major compounds, 407
followed by phenanthrenes (C1-Phe > C2-Phe > Phe > C3-Phe). Nevertheless, the heavy 408
compounds C1-Pyr and Pyr are also present in significant proportions in these stations (6.4 ± 409
4.8 and 3.8 ± 3.9%, respectively) (Fig. 7a, f). The Flt/(Flt + Pyr) ratios range from 0.08 to 410 0.38 (Table 3; Fig. 4f). 411 412 3.2.2. Group G’2 413
Group G’2 contains the southernmost stations of the Sfax North coast (S7-S13) as well 414
as most stations from the Sfax Southern coast (S16-S18, S20-S26) (Fig. 1, 3, 5). These 415
stations are distinguished by the lowest R concentrations (0.13 ± 0.25 µg L-1) and the absence 416
of UCM (Table 3; Fig. 3, 4a, 5). Pr/Phy ratios vary from 0.51 (S7) to 2.43 (S21) but are 417
mainly > 1 (Table 3; Fig. 4b). AH molecular profiles also vary within this group. S7 and S11 418
reveal distributions similar to those of G’1 stations (i.e., monomodal distribution centred on 419
the n-C25–n-C26 range) (Fig. 6a) and do not display any odd-to-even carbon-numbered 420
dominance (CPI15-40 ~1) (Fig. 3, 4c). The molecular profiles of S8 and S17 are marked by a 421
18
regular distribution of n-alkanes in the n-C15–n-C38 range, with the maximal abundance of n-422
C29 (Fig. 6c) resulting in a slight odd-to-even carbon-numbered predominance (CPI15-40 = 1.3 423
and ~1, respectively) (Fig. 3, 4c). A bimodal distribution of n-alkanes is observed at S26 and 424
S13, in which light compounds are centred on n-C16 (S26) or n-C15 (S13) and heavy 425
compounds are centred on n-C28 (S26) or n-C33 (S13) (Fig. 6d,e). In contrast, the molecular 426
profiles of stations S9, S10, S12, S16, S18 and S20-S25 also display monomodal distributions 427
but feature a strong even-to-odd predominance within the n-C16–n-C22 range (Fig. 6f). This 428
trend results in low CPI15-40 values (0.11-0.89), with n-C16 being the major compound, 429
followed by n-C18 (Table 3; Fig. 3, 4c). Globally, CPI15-40 values for this group are < 1 (Table 430
3, Fig. 4c). 431
G’2 stations record PAH concentrations similar to those of G’1 stations, with ∑29 PAHs -432
P+A of 28.9 ± 16.2 ng L-1 (Table 3; Fig. 3, 4d, 5). Alk/Par ratios are lowest in G’2, ranging 433
from 0.25 to 2.25 (but mainly falling between 1 and 2) (Table 3; Fig. 3, 4e). PAH molecular 434
profiles reveal the predominance of LMW compounds (Fig. 7a-e), as LMW compounds 435
represent 89.2 ± 8.2% of all total PAHs. Naphthalenes are the dominant compounds, followed 436
by phenanthrenes (Fig. 7a-e). Heavy compounds are also present in these stations, with C1 -437
Pyr and Pyr in S7, Flt in S8, Flt and Chr in S21-S26 (Fig. 7a, b, e). Flt/(Flt + Pyr) ratios are 438
the highest in this group, with values exceeding 0.5, except at S7 and S11 (Table 3; Fig. 3, 439 4f). 440 441 3.2.3. Group G’3 442
Group G’3 comprises only three stations from the Sfax Southern coast: S14, S15 and 443
S19 (Fig. 1, 3, 5). R concentration is high in S14 (4.5 µg L-1) and low in S15 and S19 (0.04 444
and 0.03 µg L-1, respectively) (Table 3; Fig. 3, 4a, 5). S14 displays a molecular distribution 445
similar to those of G’1 stations (i.e., monomodal distribution centred on the n-C25–n-C26 446
19
range), with UCM present at a concentration of 7.4 µg L-1, representing 62.2% of total AHs 447
(Table 3; Fig. 6a). Stations S15 and S19 exhibit different molecular profiles, with an almost 448
regular distribution from n-C15 to n-C36 and the slight emergence of n-C17 and Phy (Table 3; 449
Fig. 3, 6b). Within these three stations, Pr/Phy are low (0.34-0.48) and equal amounts of 450
even- and odd-carbon-numbered n-alkanes can be found (CPI ~1) (Table 3; Fig. 4b, c). 451
These stations contain the highest recorded PAH concentrations, with 175.8 ± 20.7 ng 452
L-1 (Table 3; Fig. 3, 4d, 5). Molecular profile of the PAHs reveals the predominance of LMW 453
compounds (Fig. 7d), as inferred by the presence of the highest Alk/Par ratios (6.6 ± 0.6) 454
(Table 3; Fig. 3, 4e). The LMW compounds represent 97.6 ± 0.3% of all total PAHs. 455
Naphthalenes are the dominant compounds, followed by phenanthrenes and fluorenes, 456
whereas the HMW compounds are almost undetectable (Fig. 7d). The Flt/(Flt + Pyr) ratios are 457
among the lowest measured values (0.08-0.13; Table 3; Fig. 3, 4f). 458
Additionally, we can also use the cross plot of Ant/(Ant + Phe) versus Flt/(Flt + Pyr) 459
ratios to distinguish different origins of PAHs (Yunker et al., 2002, 2015), as shown in Fig. 8. 460
Most stations reveal mixed origins of PAHs. All stations in G’3 and G’1 yield Ant/(Ant + 461
Phe) > 0.1 and Flt/(Flt + Pyr) < 0.4 (mixed origin), except S2, S3, S4, S6, which are strictly of 462
petrogenic origin. In contrast, G’2 stations record Ant/(Ant + Phe) < 0.1 and Flt/(Flt + Pyr) > 463
0.5 (mixed origin), except S8, which has a pyrogenic origin, and S7 and S11, which are 464
strictly of petrogenic origin. Therefore, the clustering of the highly contaminated G’1 + G’3 465
stations in an area where Flt/(Flt + Pyr) < 0.4 along with the clustering of the less 466
contaminated G’2 group (displaying more degraded hydrocarbons) in an area where 467
Ant/Ant+Phe < 0.1, very likely suggests that PAHs have different origins in G’1 + G’3 than 468
they do in G’2. 469
470
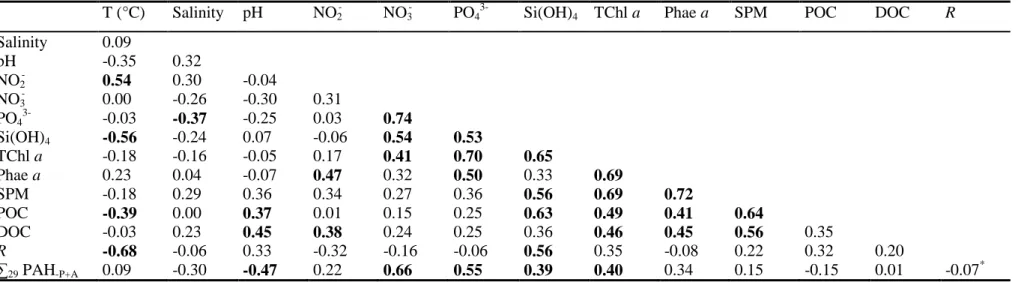
3.3. Correlation between biogeochemical parameters and dissolved hydrocarbons
20
Table 4 displays the Spearman’s rank-order correlation matrix for biogeochemical 472
parameters and dissolved hydrocarbons. R concentration is significantly negatively correlated 473
with T (r = -0.68, n = 30, p < 0.05) and significantly positively correlated with Si(OH)4 474
concentration (r = 0.56, n = 30, p < 0.05). The concentration of ∑29 PAHs-P+A shows a 475
significant negative correlation with pH (r = -0.47, n = 30, p < 0.05) and significant positive 476
correlation with concentrations of NO3-, PO43-, Si(OH)4 and TChl a (r = 0.39-0.66, n = 30, p < 477
0.05). Neither R concentrations nor ∑29 PAHs-P+A concentrations are correlated to DOC 478
concentrations (r = 0.01-0.20, n = 30, p > 0.05). No significant relationship was found 479
between R and ∑29 PAHs-P+A concentrations (r = -0.07, n = 36, p > 0.05), suggesting that AHs 480
and PAHs in this coastal area are decoupled. Evidence for this decoupling can also be seen in 481
results of the PCA, in which AH and PAH variables are located on principal component 1 482
(PC1) and principal component 2 (PC2), respectively, thus underscoring their absence or very 483
low correlation (Fig. 3). TChl a concentrations are significantly positively correlated to those 484
of NO3-, PO43-, Si(OH)4, Phae a, SPM, POC and DOC (r = 0.40-0.70, n = 30, p < 0.05). This 485
underlines the strong coupling between phytoplankton biomass, nutrients and the organic 486
carbon pool (Table 4). The absence of any correlation between POC and DOC concentrations, 487
as well as the positive correlation observed between DOC and SPM concentrations, suggest 488
the presence of slightly different sources of particulate and dissolved organic carbon in the 489 surface waters. 490 491 492 4. Discussion 493 494
4.1. Comparisons with previously published data
495
21
4.1.1. Physical and biogeochemical parameters
497
Measured temperature and pH values in this study, which range from 18.0-27.3 °C and 498
7.90-8.30, respectively (Table 2), are within the same order of magnitude as those reported in 499
other studies in the Gulf of Gabès (Drira et al., 2014; 2016; Rekik et al., 2014) and in the 500
Western Mediterranean basin (Pujo-Pay et al., 2011). Salinity, however, displays a wider 501
range (32-42) than has been observed by previous works in this coastal area (i.e., 36-40 by 502
Drira et al., 2016). This is likely because stations in this study are located closer to the coast 503
and are thus more influenced by terrestrial freshwater inputs for the lower values and by a 504
thinner water column subjected to greater evaporation for the higher ones. 505
NO2- concentrations measured here (0.00-0.90 µM; Table 2) are similar to those already 506
reported in these coastal waters (0.01-0.83 µM), whereas NO3- and Si(OH)4 concentrations 507
(0.01-4.0 and 1.4-33.4 µM, respectively; Table 2) are lower than previously reported values 508
(1.2-13.4 and 2.6-55.2 µM, respectively) (Rekik et al., 2013; Drira et al., 2016). PO4 3-509
concentrations measured here (5.5-120.3 µM; Table 2) are higher than those that have 510
previously been recorded in this area (0.1-39.7 µM) (Rekik et al., 2012, 2013; Drira et al., 511
2016). The highest PO43- concentrations are found in the Sfax Southern coast (G3 group: 512
stations S16, S20, S22; Fig. 1, 2c; Table 2) and can be attributed, in part, to the release of 513
phosphogypsum from the SIAPE industry, which is known to be enriched in PO43-, as well as 514
to the release of domestic and industrial wastes from the Sidi Salem channel. The lowest 515
PO43- concentrations are observed mainly in the Sfax Northern coast (G2 group; Fig. 1, 2c; 516
Table 2), where phosphoric acid activities have not occurred for several years. 517
TChl a concentrations measured in the present work (1.7-40.7 µg L-1; Table 2) are 518
higher than those previously found in the same coastal waters (0.0-25.6 µg L-1) (Rekik et al., 519
2013; 2014), while our SPM concentrations (8.3-59.4 mg L-1; Table 2) are on the same order 520
22
of magnitude (0.7-30 mg L-1) (Katlane et al., 2013) and lower than those measured in the 521
Northern coast of Sfax (14-434 mg L-1) (Rekik et al., 2014). 522
Therefore, these data suggest that this coastal area is characterized by an enrichment in 523
PO43-, TChl a, POC, DOC and SPM concentrations compared to other Mediterranean systems 524
(The Mermex group; Pujo-Pay et al., 2011; Karydis and Kitsiou, 2012). PO43- anthropogenic 525
inputs from various industrial sources have led to the eutrophication (or the enhancement of 526
biological production) of these coastal waters (Ben Mustapha et al., 1999; Drira et al., 2014; 527
2016). The high variability in concentrations from station to station may be related not only to 528
different anthropogenic input contributions, but also to the complex bathymetry and 529
hydrodynamics of this area. 530
531
4.1.2. Dissolved n-alkane and PAH concentrations
532
Compared to PAHs, only a few studies have investigated dissolved n-alkanes in marine 533
waters. Dissolved total R concentrations (n-C15˗n-C40 with Pr and Phy) determined here in the 534
surface waters of the Sfax and Gabès coastal areas (0.02 to 6.3 µg L-1; Table 3) yield higher 535
values than those recorded in surface waters of the Marseille coastal area (Northwestern 536
Mediterranean Sea, France) (0.04-0.58 µg L-1) (Guigue et al., 2011; 2014), in offshore surface 537
waters of the Northwestern Mediterranean Sea (0.7-2.4 µg L-1) (Marty and Saliot, 1976) and 538
in surface waters of the Gulf of Tunis (Tunisia) (0.25-1 µg L-1; Mzoughi and Chouba, 2011). 539
Dissolved total PAH concentrations measured here in the surface waters of the Sfax and 540
Gabès coastal areas, i.e., 8.9-197.8 ng L-1 for ∑29 PAHs-P+A and 3.6-56.4 ng L-1 for∑19 PAHs -541
P, are high compared to those reported in the Western Mediterranean (∑16 PAHs-P+A: 0.4-2.2 542
ng L-1 and ∑19 PAHs-P+A: 0.16-0.8 ng L-1) and the Eastern Mediterranean (∑19 PAHs-P+A: 543
0.16-8.8 ng L-1) (Dachs et al., 1997; Berrojalbiz et al., 2011), as well as in coastal waters of 544
Barcelona (Spain) and Banyuls-sur-Mer (France) (∑15PAHs-P+A: 2.5-41.7 ng L-1 in surface 545
23
micro layer and 3.6-30.7 ng L-1 in surface waters) (Guitart et al., 2007). However, they are 546
within the same range as those observed in surface waters of the Marseille coastal area (∑32 547
PAHs-P+A: 5-162 ng L-1) (Guigue et al., 2011), the Rhone delta (France) (∑80 PAHs-P+A: 15-548
290 ng L-1) (Bouloubassi and Saliot, 1991), and the Venice Lagoon (Italy) (∑20 PAHs-P+A: 549
12.4-266.8 ng L-1) (Manodori et al., 2006). Our measured concentrations are also lower than 550
those found in the Gulf of Tunis (∑24 PAHs-P+A: 139-694 ng L-1 in summer and 150-1008 ng 551
L-1 in winter) (Mzoughi and Chouba, 2011) and the Saronikos Gulf (Greece) (∑17 PAHs-P+A: 552
103-459 ng L-1) (Valavanidis et al., 2008). El Nemr and Abd-Allah (2003) also reported 553
higher concentrations of P in surface waters of the Alexandria coast (Egypt) (∑7 PAHs-554
P: 13-120 ng L-1). Consequently, these AH and PAH concentration data indicate that the 555
surface coastal waters of the Gulf of Gabès are likely moderately-to-highly contaminated 556
when compared to other Mediterranean regions. Hence concentration levels of hydrocarbons 557
recorded in surface waters of the Gulf of Gabès are not so high compared to other 558
Mediterranean coastal environment despite strong anthropogenic releases. This could be 559
explained by the influence of hydrodynamic conditions, in particular tides. Tides of the Gulf 560
of Gabès, which present the highest amplitude of all the Mediterranean Sea, with the upper 561
Adriatic, may have a role of dispersing hydrocarbons at sea. 562
563
4.2. Origin and potential sources of dissolved hydrocarbons
564
565
4.2.1. Group G’1
566
AH and PAH concentrations and ratios (R/UCM > 0.3; CPI ~ 1 and Alk/Par > 2) 567
indicate the presence of recent and chronic petrogenic contaminations (Simoneit and 568
Mazurek, 1982; Wang et al., 1999; Commendatore and Esteves, 2004; Commendatore et al., 569
2012). Additionally, the cross plot and occurrence of Pyr and C1-Pyr suggest, for many of 570
24
these stations, a contribution of pyrogenic (combustion) sources (Fig. 7, 8). AH profiles 571
display a molecular distribution very close to that recorded for classic heavy fuels or residuals 572
used as marine diesel and for industrial power generation (Wang and Fingas, 2003). This 573
observed high proportion of alkylated homologues was also reported in Sfax surficial 574
sediments by Zaghden et al. (2014). The hydrocarbon contamination found in the 575
northernmost stations of Sfax and in the Gabès-Ghannouch stations may have several sources, 576
especially wadis, uncontrolled discharges, and harbour activities. The Ezzit wadi, which may 577
transport various uncontrolled domestic, industrial, and agricultural wastes, would thus 578
represent a significant source of petrogenic hydrocarbons for the Northern coast of Sfax. 579
Within the Gabès coastal area, the main sources of hydrocarbons include industrial discharges 580
(from the thermal power plant), commercial and fishing harbours (by means of oil spills, 581
ballast water, shipping, and air emissions) and wadis (El-Tine and Gabès wadis) (Fig. 1). 582
Despite the weak correlation between biogeochemical and hydrocarbon individual 583
parameters, this observed G’1 station contamination is supported by the presence of 584
widespread anthropisation occurring in the northernmost Sfax stations (G1) and in the Gabès-585
Ghannouch area (G5 + G6 stations). 586
587
4.2.2. Group G’2
588
This group is characterized by a range of diverse AH profiles, from the most petrogenic 589
distribution (S7, S11, close to G’1 profiles; Fig. 3, 6a) to increasingly biogenic origin markers 590
(away from G’1 profiles, Fig. 3, 6c-f). The emergence of odd n-alkanes n-C15, n-C17, n-C29, n-591
C33 may be attributed to phytoplankton or higher plant debris lysis (Douglas and Eglington, 592
1966; Blumer et al., 1971; Goutx and Saliot, 1980), as well as the suspected presence of 593
small-size phytoplankton cells (picophytoplankton). Since micro and macro algae are 594
abundant in the Gulf of Gabès (Bel Hassen et al., 2008; Drira et al., 2014; Rekik et al., 2014), 595
25
this assumption seems plausible. Even n-alkanes can be attributed to microbial activities such 596
as bacteria, fungi and yeast (Elias et al., 1997). Stations S9, S10, S12, S16, S18, S20-25, 597
which yield the lower CPI, exhibit higher abundances of these microbial signatures (Fig. 3, 598
6f). The hypothesised biogenic signatures of AHs within this group are supported by the 599
presence of Pr/Phy ratios > 1 (Fig. 4b, c). Also, the relatively low concentration levels of AHs 600
and PAHs, associated with low Alk/Par values (compared to the two other groups), suggest at 601
these sites less petrogenic inputs, and, at the same time, more pronounced weathering 602
processes, very likely through biodegradation. Indeed, it has been shown that the bacterial 603
degradation of PAHs could lead to a depletion of alkylated PAHs compared to their non 604
alkylated counterparts (Vila et al., 2010; Jiménez et al., 2011). 605
606
4.2.3. Group G’3
607
This group is mainly characterized by the highest PAH concentrations, LMW PAH 608
abundances, and Alk/Par values associated with CPI ~ 1, which indicate the importance of 609
local petrogenic inputs. These stations were sampled in March 2015 close to the coast and 610
were thus likely affected by anthropogenic inputs from Sidi Salem channel as well as by 611
fishing and commercial harbours located in the Southern coast of Sfax. The Sidi Salem 612
channel contains, among other things, untreated wastewater from slaughter-house, whose 613
flow rate is estimated at 55 m3 day-1, sludge from the WWTP, and pretreated wastewaters of 614
various industries (DGQEV, 2008). Therefore, all these inputs may substantially contribute to 615
the PAH content in this area. 616
617
4.2.4. Differences between Sfax and Gabès environments
618
In the Sfax region, we observe a combination of petrogenic inputs (G’1, G’3) and 619
biogenic sources (G’2), as well as the occurrence of weathering processes which are 620
26
supported by the decrease in both AH and PAH concentrations and Alk/Par ratio off of the 621
coast (G’2: S1-S3/S4, S5-S7, S8-S11, S12-S13, S16-S18, S19-S26). Even though these 622
weathering processes seem to be driven by biodegradation (Vila et al., 2010; Jiménez et al., 623
2011), we cannot exclude other processes such as volatilisation (Jiménez et al., 2012), 624
photodegradation (King et al., 2014) and particle sequestration (Dachs et al., 2002). These 625
biogenic AHs and weathering processes are not observed in the Gabès-Ghannouch region; we 626
assume that this is due to either the recurrence of larger releases in Gabès, with continuous 627
and direct discharge of phosphogypsum into the sea, or to a particular ecosystem in Sfax that 628
is more suitable for the biodegradation of hydrocarbons. Measurements of bacterial 629
abundance, diversity and activities in these two ecosystems should thus be considered as 630
complements to hydrocarbon analysis in future studies. Moreover, in the Sfax waters, we did 631
not observe coupling between the hydrocarbon and biogeochemical contents, whereas 632
hydrocarbons in the Gabès-Ghannouch area (G’1 stations) are associated with biogeochemical 633
groups G5 and G6, which exhibit the highest measured values of silica. These data may thus 634
reflect the influence of terrigenous inputs (Gabès and El-Tine wadis), chronic releases or 635
spills/plumes (harbour activities, phosphogypsum releases). 636
637
4.2.5. Inputs of PAHs from particles
638
For each of the three hydrocarbon groups, the cross plot shows the superposition of 639
pyrogenic inputs in addition to the widespread existence of petrogenic sources (Fig. 8). This 640
pyrogenic component probably reflects the influence of either high suspended matter contents 641
or of the proximity of sediment. Given the dynamics of the area, we may assume that we are 642
not in a particle-dissolved equilibrium position and thus that rearrangements may occur in 643
cases of environmental disturbance (Dong et al., 2015). Dissolved PAHs found here in surface 644
waters may partially originate from surficial sediments. Indeed, in these very shallow waters, 645
27
exchanges between sediment and the water column are exacerbated. Studies carried out on 646
surficial sediments of the Sfax coastal area have demonstrated that phenanthrenes (especially 647
alkylated homologues) are among the most abundant PAHs (Zaghden et al., 2007; 2014). 648
Consequently, some LMW PAHs recorded in surface waters may be released from sediments, 649
either by the resuspension of particulate matter or by passive diffusion. This process of 650
partitioning between the two matrixes (water and sediment) is highly related to the 651
octanol/water partition coefficients (Kow) of PAHs, as well as to the organic carbon content in 652
sediment that controls this partitioning through a linear free energy relationship (Zhou and 653
Maskaoui, 2003). 654
655
4.3. PAH partitioning in the dissolved phase
656
DOC is considered as one of the most important factors controlling the partitioning of 657
hydrocarbons in the dissolved phase. Although we record high DOC concentrations in these 658
coastal waters, no linear correlation is found between DOC and dissolved ∑29 PAHs-P+A 659
concentrations (r = 0.01, n = 30, p > 0.05). In addition, no linear correlation is observed 660
between individual PAH and DOC concentrations, except for Ace (data not shown). This lack 661
of correlation between DOC and dissolved PAHs may a reflect different sources for these two 662
pools in surface waters of the Gulf of Gabès, but also their low affinity at the molecular level. 663
Therefore, a fraction of dissolved LMW PAHs in this area could be under freely form (i.e., 664
not complexed to dissolved organic matter), which is in agreement with their physico-665
chemical properties (relatively low Kow and high solubility) (Shi et al., 2007). Besides, 666
significant negative linear relationships are found between individual PAH concentrations and 667
their respective Kow values (data not shown), which suggests that the molecular distribution 668
pattern observed, i.e., dominance of LMW PAHs in all samples, is driven by the hydrophobic 669
character of compounds. Interestingly, significant positive correlations are detected between 670
28
several dissolved PAHs (C2-Naph, C3-Naph, Ace, Flu, C1-Flu, C2-Flu and DBT) and POC or 671
SPM concentrations (data not shown). This could underline a “particle concentration effect” 672
(Zhou et al., 1999). The latter is observed when particle partition coefficient (Kp or Koc) is 673
inversely proportional to particle concentration. The increase in particle concentration is 674
generally associated to an increase in DOC concentration, which may explain this distribution 675
of PAHs towards the dissolved phase (Zhou et al., 1999). However, in our case, the increase 676
in POC/SPM concentrations was not concomitant to an increase in DOC concentrations. Our 677
results thus illustrate the complexity of the relationships between dissolved PAHs, DOC and 678
POC in marine coastal waters. 679
680
5. Conclusions
681
682
While some works have already reported hydrocarbon levels in surficial sediments of 683
the Sfax coastal area (Zaghden et al., 2007; 2014), this present study represents to our 684
knowledge the first assessment of concentrations of dissolved hydrocarbons (28 AHs and 29 685
PAHs) in surface waters of the Gulf of Gabès (in the Sfax and Gabès coastal areas), and their 686
associations with biogeochemical parameters. Overall, these areas are moderate-to-highly 687
impacted by hydrocarbons and show a relatively high eutrophication level compared to other 688
Mediterranean coastal environments. The highest hydrocarbon concentrations can be 689
attributed to recent petrogenic sources from industrial, domestic and harbour activities. 690
Interestingly, biogenic AHs and signatures of weathering processes are found in Sfax, but not 691
in Gabès, with lower hydrocarbon contents and decreasing Alk/Par ratios off the coast. 692
Concentrations in AHs, PAHs, and DOC do not correlated with each other, thus highlighting 693
that these three pools have different sources and are then submitted to different processes in 694
the Gulf of Gabès. Despite these relatively high DOC concentrations, dissolved PAHs do not 695
29
seem to show an affinity towards dissolved organic matter. These results demonstrate that the 696
dissolved phase can provide very interesting information about the dynamics of PAHs in 697
coastal waters. Further investigations should take into consideration the particulate organic 698
matter of water column to obtain a global view of PAH dynamics in coastal waters of the Gulf 699
of Gabès. 700
701
Acknowledgements. We are grateful to the “Institut de Recherche pour le
702
Développement” (IRD) for providing scholarship to R. Fourati through the “Allocations de 703
Rercherche pour une Thèse au Sud” (ARTS) program. This thesis was also supported by the 704
Tunisian Ministry of Higher Education and Scientific Research. This work was conducted in 705
the framework of the IRD Action South project “MANGA” and the IRD French-Tunisian 706
International Joint Laboratory (LMI) “COSYS-Med”. This study was carried out as a part of 707
the WP3 C3A-Action MERMEX/MISTRALS and is a contribution to the international 708
SOLAS, IMBER and LOICZ projects. We warmly thank Z. Drira from the laboratory of 709
Biodiversity and Aquatic Ecosystems (Faculty of Sciences, University of Sfax) as well as H. 710
Sahnoun and T. Omar for their technical help during cruises. We thank the core parameter 711
analytical platform (PAPB) of the Mediterranean Institute of Oceanography (MIO) for 712
performing biogeochemical analyses as well as R. Sempéré for the use of the Agilent GC-MS. 713
We acknowledge two anonymous reviewers for their relevant comments and corrections. 714 715 716 717 718 719 720
30
References
721
Adhikari, P.L., Maiti, K., Overton, E., 2015. Vertical fluxes of polycyclic aromatic 722
hydrocarbons in the northern Gulf of Mexico. Mar. Chem., 168, 60-68. 723
Akkanen, J., Tuikka, A., Kukkonen, J.V.K., 2012. On the borderline of dissolved and 724
particulate organic matter: Partitioning and bioavailability of polycyclic aromatic 725
hydrocarbons. Ecotoxicol. Environ. Saf. 78, 91–98. 726
Al-Lihaibi, S.S., 2003. Photo-oxidation products of petroleum hydrocarbons in the Eastern 727
Red Sea coastal waters. Environ. Inter. 28, 573–579. 728
Aloulou, F., Elleuch, B., Kallel, M., 2012. Benthic foraminiferal assemblages as pollution 729
proxies in the northern coast of Gabes Gulf, Tunisia. Environ. Monit. Assess. 184, 777–95. 730
Aloulou, F., Kallel, M., Dammak, M., Elleuch, B., Saliot, A., 2010. Evenumbered n-731
alkanes/n-alkenes predominance in surface sediments of Gabes Gulf in Tunisia. Environ. 732
Earth Sci. 61, 1–10. 733
Aminot A., Kérouel R., 2007. Dosage automatique des nutriments dans les eaux marines : 734
méthodesen flux continu. Ed. Ifremer, Méthodes d’analyse en milieu marin 188p. 735
Amorri, J., Geffroy-Rodier, C., Boufahja, F., Mahmoudi, E., Aïssa, P., Ksibi, M., Amblès, A., 736
2011. Organic matter compounds as source indicators and tracers for marine pollution in a 737
western Mediterranean coastal zone. Environ. Sci. Pollut. Res. 18, 1606–1616. 738
Asia, L., Mazouz, S., Guiliano, M., Doumenq, P., Mille, G., 2009. Occurrence and 739
distribution of hydrocarbons in surface sediments from Marseille Bay (France). Mar. 740
Pollut. Bull. 58, 443–451. 741
Barth, A., Alvera Azcarate, A., Troupin, C., Ouberdous, M., Beckers, J.-M., 2010. A web 742
interface for griding arbitrarily distributed in situ data based on Data-Interpolating 743
Variational Analysis (DIVA). Adv. Geosci. 28, 29–37. 744
Bel Hassen, M., Drira, Z., Hamza, a., Ayadi, H., Akrout, F., Issaoui, H., 2008. Summer 745
31
phytoplankton pigments and community composition related to water mass properties in 746
the Gulf of Gabes. Estuar. Coast. Shelf Sci. 77, 645–656. 747
Bel Hassen, M., Drira, Z., Hamza, a., Ayadi, H., Akrout, F., Messaoudi, S., Issaoui, H., 748
Aleya, L., Bouaïn, A., 2009. Phytoplankton dynamics related to water mass properties in 749
the Gulf of Gabes: Ecological implications. J. Mar. Syst. 75, 216–226. 750
Ben Mustapha, K., Hattour, A., Mhetli, M., El Abed, A., Tritar. B., 1999. Bionomie des 751
étages infra et circalittoral du golfe de Gabès. Bull. Inst. Natl. Sci. Tech. Mer (Tunisie) 26, 752
5–48. 753
Berrojalbiz, N., Dachs, J., Ojeda, M.J., Valle, M.C., Castro-Jiménez, J., Wollgast, J., Ghiani, 754
M., Hanke, G., Zaldivar, J.M., 2011. Biogeochemical and physical controls on 755
concentrations of polycyclic aromatic hydrocarbons in water and plankton of the 756
Mediterranean and Black Seas. Global Biogeochem. Cycles 25, 1–14. 757
Blumer, M., Guillard, R.R.L., Chase, T., 1971. Hydrocarbons of marine phytoplankton. Mar. 758
Biol. 8, 183. 759
Bouaziz, S., Jedoui, Y., Barrier, E., Angelier, J., 2003. Néotectonique affectant les dépôts 760
marins tyrrhéniens du littoral sud-est tunisien: implications pour les variations du niveau 761
marin. C. R. Géosci. 335, 247–254. 762
Bouloubassi, I., Saliot, A., 1991. Composition and sources of dissolved and particulate PAH 763
in surface waters from the Rhone delta (NW Mediterranean). Mar. Pollut. Bull. 22, 588– 764
594. 765
Bouloubassi, I., Saliot, A., 1993. Investigation of anthropogenic and natural organic inputs in 766
estuarine sediments using hydrocarbon markers (NAH, LAB, PAH). Oceanol. Act. 16, 767
145–161. 768
32
Budzinski, H., Jones, I., Bellocq, J., Pierard, C., Garrigues, P., 1997. Evaluation of sediment 769
contamination by polycyclic aromatic hydrocarbons in the Gironde estuary. Mar. Chem. 770
58, 85–97. 771
Castro-Jiménez, J., Berrojalbiz, N., Wollgast, J., Dachs, J., 2012. Polycyclic aromatic 772
hydrocarbons (PAHs) in the Mediterranean Sea: Atmospheric occurrence, deposition and 773
decoupling with settling fluxes in the water column. Environ. Pollut. 166, 40–47. 774
Chen, J., Henderson, G., Grimm, C.C., Lloyd, S.W., Laine, R.A., 1998. Termites fumigate 775
their nests with naphthalene. Nature 392, 558. 776
Cincinelli, A., Martellini, T., Bittoni, L., Russo, A., Gambaro, A., Lepri, L., 2008. Natural and 777
anthropogenic hydrocarbons in the water column of the Ross Sea (Antarctica). J. Mar. 778
Syst. 73, 208–220. 779
Commendatore, M.G., Esteves, J.L., 2004. Natural and anthropogenic hydrocarbons in 780
sediments from the Chubut River (Patagonia, Argentina). Mar. Pollut. Bull. 48, 910–918. 781
Commendatore, M.G., Nievas, M.L., Amin, O., Esteves, J.L., 2012. Sources and distribution 782
of aliphatic and polyaromatic hydrocarbons in coastal sediments from the Ushuaia Bay 783
(Tierra del Fuego, Patagonia, Argentina). Mar. Environ. Res. 74, 20–31. 784
Cripps, G.C., 1989. Problems in the identification of anthropogenic hydrocarbons against 785
natural background levels in the Antarctic. Antart. Sci. 1, 307–312. 786
Dachs, J., Bayona, J.M., Raoux, C., Albaigés, J., 1997. Spatial distribution, vertical profiles 787
and budget of polycyclic aromatic hydrocarbons in western Mediterranean. Env. Sci. 788
Technol. 31, 682–688. 789
Dachs, J., Lohman, R., Ockenden, W.A., Méjanelle, L., Eisenrich, S., Jones, K.C., 2002. 790
Oceanic biogeochemical controls on global dynamics of persistent organic pollutants. 791
Environ. Sci. Technol. 36, 4229–4237. 792
Dachs, J., Méjanelle, L., 2010. Organic pollutants in coastal waters, sediments, and biota: A 793